

Indicator That Detects RSI Reversal Patterns (Titan_Failure_Swing_Signal)
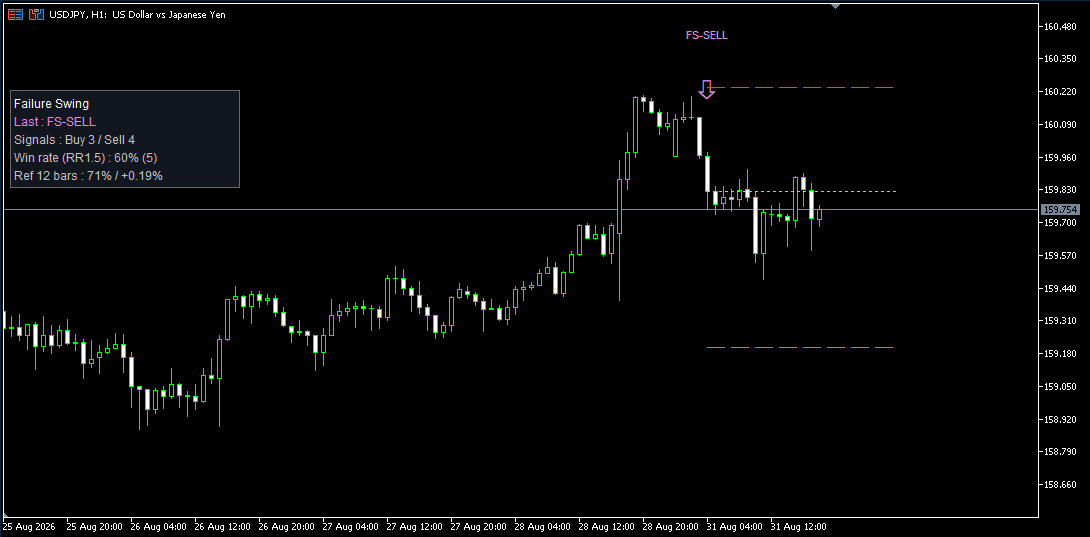
Indicator Overview
Titan Failure Swing Signal is a trading signal indicator that automatically detects the "Failure Swing," which J. Welles Wilder, the creator of the RSI, regarded as one of the most reliable reversal signals.
A failure swing refers, for example, to the following pattern appearing near a market top.
①The RSI forms a peak in the overbought zone (70 or above)
②It then declines to form a trough and rebounds, but——
③It loses momentum without exceeding the previous peak (= failure)
④The moment the RSI breaks below the preceding trough, upward momentum is considered exhausted → Sell signal
A buy signal is the reverse of this pattern (a double bottom in the oversold zone). This is a classic method that evaluates only the shape of the RSI rather than the price chart, mechanically identifying "double tops and double bottoms in momentum." Continuously monitoring this pattern visually can be difficult, but this indicator monitors it at all times and displays a signal on the confirmed candle when the pattern is completed.
In addition, each signal automatically includes three lines indicating the entry, suggested stop-loss, and suggested take-profit levels. The stop-loss is placed slightly beyond the most recent low/high (a practical stop position), while the take-profit is set at 1.5 times the stop-loss distance (risk-reward ratio of 1:1.5). The panel displays the actual historical win rate of past signals based on these levels.
How It Works
RSI peaks and troughs are confirmed by comparison with several bars on both sides (pivot detection), and a state machine tracks the entire structure: "initial peak → pullback trough → lower peak → break below the trough." If the RSI exceeds the initial peak during this process, the structure is considered invalid and the setup is reset. All evaluations are performed using confirmed candles only, and the indicator recalculates from historical data using the same procedure each time, so signals will not disappear or move afterward (no repainting).
Display
・ Buy signals are shown with Aqua upward chevron arrows + "FS-BUY" labels, while sell signals are shown with Violet downward chevron arrows + "FS-SELL" labels.
・Each signal displays lines for the entry (Silver, dotted) / suggested take-profit (Green, dashed) / suggested stop-loss (Red, dashed), with a simple label-free display. ・In addition to the latest signal and the number of detected signals, the panel in the upper-left displays "Win Rate (RR1.5)" = the actual measured result of whether the displayed stop-loss or take-profit line was reached first.
This indicator is a supplementary tool designed to identify potential reversal points. Although the Failure Swing is classically regarded as a highly reliable pattern, it does not guarantee that the market will move in accordance with its signals. Please note that reversal signals may be less effective, particularly in markets where a strong trend continues.
How to Read This Indicator
- Aqua upward arrow + FS-BUY: A double bottom has been completed from the oversold zone. A potential point for an upward rebound.
- Violet downward arrow + FS-SELL: A double top has been completed from the overbought zone. A potential point for a downward reversal.
- Green dashed line (suggested take-profit) and Red dashed line (suggested stop-loss): A bracket with a risk-reward ratio of 1:1.5. Because the Red line is positioned beyond the most recent swing, it is a practical level that is less likely to be triggered by minor wicks.
- The panel's Win Rate (RR1.5) is simply the "percentage of cases in which the Green line was reached first." With a risk-reward ratio of 1.5, a win rate above 40% is theoretically considered a benchmark for positive returns.
- This indicator is particularly effective in ranging markets and reversal phases following overextended price moves. During strong one-directional trends, we recommend using it together with trend-following signals (such as Break & Retest).
※This indicator works only with Titan FX's Windows versions of MT5 and MT4.
Indicator Terms of Use
Only those who agree to all the following items may use the indicators distributed on this website (https://research.titanfx.com):
1.The indicators and related descriptions are based on various data believed to be reliable, but their accuracy and completeness are not guaranteed.
2.The data displayed by the indicators do not guarantee your investment results. Also, the displayed content may vary due to market conditions and communication environments.
3.Please make investment decisions using indicators at your own risk. We are not responsible for any disadvantages or damages arising from the use of indicators.
4.Specifications of the indicators are subject to change without notice. Changes will be announced on the indicator description pages, etc.
5.Indicators should only be used by customers who have downloaded them. Transferring or selling the indicators to third parties is prohibited.
Indicator Settings
Settings in the Inputs Tab (MT5) / Inputs Tab (MT4)
| Variable Name | Description | Default |
|---|---|---|
| Bars to analyze | Number of historical bars to include in detection | 500 |
| RSI Period | RSI calculation period | 14 |
| Overbought level (sell anchor) | A peak at or above this level serves as the starting point for a sell setup | 70 |
| Oversold level (buy anchor) | A trough at or below this level serves as the starting point for a buy setup | 30 |
| RSI pivot bars (each side) | Conditions for confirming RSI peaks and troughs | 2 |
| Evaluation bars | Reference tracking period for determining wins and losses | 12 |
| Swing lookback for stop (bars) | The stop-loss level is placed beyond the high/low within this number of bars | 10 |
| Stop buffer (ATR multiple) | Additional margin beyond the high/low | 0.2 |
| Take-profit risk-reward ratio | Suggested take-profit = stop-loss distance × this multiplier | 1.5 |
| ATR Period | ATR period used to calculate the buffer | 14 |
| Max signals shown | Number of most recent signals retained on the chart | 8 |
| Take-Profit/Stop-Loss Reference Lines | Display lines for all signals currently shown | true |
| Performance panel | Whether to display the actual performance panel in the upper-left corner | true |
| Alert on new signal | Whether to send a notification when a new signal is confirmed | false |
| Buy Signal | Color of arrows and labels | Aqua |
| Sell Signal | Color of arrows and labels | Violet |
Settings in the Colors Tab (MT5) / Colors Tab (MT4)
This indicator does not use these settings.