

Subwindow Chart Indicator (Titan_SubChartViewer)
Indicator Overview
Subchart for Displaying a Different Instrument or Timeframe Without Opening Additional Charts
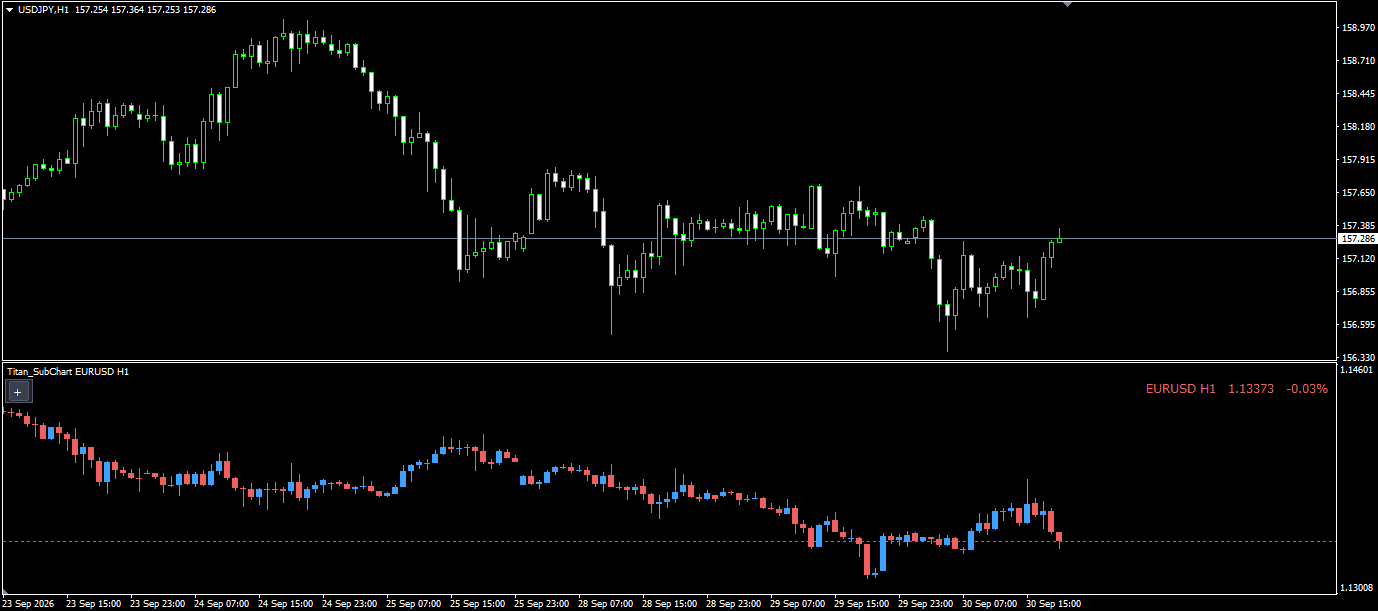
This indicator creates a subwindow at the bottom of the chart and displays the chart of another instrument in that subwindow.
Without arranging multiple charts, you can compare the price movements of the main instrument and another instrument vertically within a single chart.
The subwindow shares the same time axis as the main chart, so when you scroll, zoom in, or zoom out on the main chart, the subwindow display moves together with it.
The instrument displayed in the subwindow can be switched simply by pressing the instrument buttons on the panel. You can choose between candlestick and line (close price) display formats, and the instrument name, current price, and change from the previous day's close are also displayed.
You can also monitor three or more instruments at the same time by applying the indicator multiple times, which adds additional subwindows vertically.
In addition, the timeframe of the subwindow can be specified separately from the main chart.
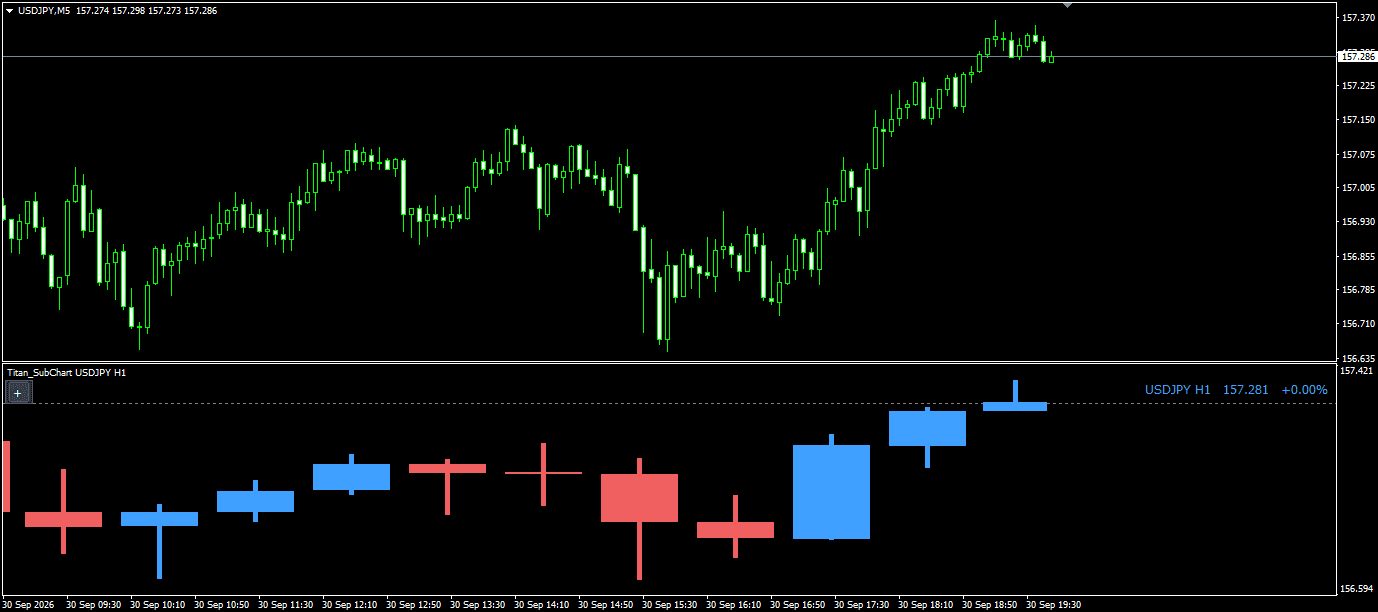
For example, if you display USDJPY on the 5-minute timeframe above and the same USDJPY on the 1-hour timeframe below, each higher-timeframe bar is displayed as one wide candlestick, allowing you to look for timing on the lower timeframe while checking the trend on the higher timeframe.
[Example of displaying EURUSD below a USDJPY chart]
[Example of displaying H1 of the same instrument below an M5 chart]
How to Use
① Apply this indicator to a chart. A subwindow is created at the bottom of the chart and a chart is displayed there (by default, the same instrument as the main chart).
② Press an instrument button at the top of the subwindow to switch the displayed instrument. The green button indicates the currently selected instrument, and the [ < ] [ > ] buttons allow you to switch between pages of instrument buttons.
③ Press the [Candles] / [Line] buttons to switch between candlestick and close-price line displays.
④ Press the timeframe button (such as [H1 ▼]) to open a list and select the timeframe to display in the subwindow.
⑤ If you want to display two or more instruments, apply the same indicator again. Additional subwindows are added vertically, and each can display a different instrument.
The height of the subwindow can be adjusted by dragging the boundary line between it and the main chart. The button row can be hidden using the [−] button.
It is recommended to use the same timeframe as the main chart or a longer timeframe for the subwindow. If you specify a shorter timeframe than the main chart, the display will be discontinuous.
*Because the subwindow uses the time axis of the main chart, periods where there are no candlesticks on the main chart will not be displayed. When comparing instruments with different trading hours, display the instrument with longer trading hours on the main chart (for example, when comparing cryptocurrencies and FX, use a cryptocurrency as the main chart).
*This indicator works only with the Windows versions of MT5 and MT4 provided by Titan FX.
Indicator Terms of Use
Only those who agree to all the following items may use the indicators distributed on this website (https://research.titanfx.com):
1.The indicators and related descriptions are based on various data believed to be reliable, but their accuracy and completeness are not guaranteed.
2.The data displayed by the indicators do not guarantee your investment results. Also, the displayed content may vary due to market conditions and communication environments.
3.Please make investment decisions using indicators at your own risk. We are not responsible for any disadvantages or damages arising from the use of indicators.
4.Specifications of the indicators are subject to change without notice. Changes will be announced on the indicator description pages, etc.
5.Indicators should only be used by customers who have downloaded them. Transferring or selling the indicators to third parties is prohibited.
Indicator Settings
Settings in the Inputs Tab (MT5) or Parameters Tab (MT4)
| Parameter | Description | Default |
|---|---|---|
| Symbol at start (blank = chart symbol) | Sets the symbol displayed in the sub window at startup. If left blank, the same symbol as the chart is displayed. | (blank) |
| Symbol list for buttons (blank = Market Watch) | Sets the symbols shown on the symbol buttons, separated by commas. If left blank, the symbols in Market Watch are listed automatically. | (blank) |
| Number of symbol buttons | Sets the number of symbol buttons per page. Symbols that do not fit are shown on the following pages. | 4 |
| Timeframe (current = same as chart) | Sets the timeframe displayed in the sub window. It can also be changed with the button on the panel. | Current (same as chart) |
| Display type | Sets the display type at startup: "Candlestick" or "Line (close)". | Candlestick |
| Max bars to draw | Sets the maximum number of bars drawn in the sub window. Reduce this value if the indicator runs slowly. | 500 |
| Bull candle color | Sets the color of bullish candles. | 64,160,255 |
| Bear candle color | Sets the color of bearish candles. | 240,96,96 |
| Line color | Sets the color of the line when Display type is set to Line. | Silver |
| Body width px (0 = auto) | Sets the width of the candle bodies. If set to 0, it is adjusted automatically to the bar spacing (MT4 only). | 0 |
| Show current price line | Sets whether to show a line indicating the current price of the displayed symbol. | true |
| Current price line color | Sets the color of the current price line. | 128,128,128 |
| Info display (symbol, price, change) | Sets whether to show the symbol name, timeframe, current price and change from the previous day's close. | true |
| Info position | Sets the position of the info display: "Upper right", "Upper left", "Lower right" or "Lower left". | Upper right |
| Info X (px) | Sets the horizontal distance from the corner selected in Info position. | 8 |
| Info Y (px) | Sets the vertical distance from the corner selected in Info position. | 18 |
| Show symbol buttons | If set to false, the buttons are not shown in the sub window. | true |
| Language | Sets the language displayed on the panel. | English |
| Panel X (px) | Sets the horizontal distance from the upper left of the sub window to the row of buttons. | 6 |
| Panel Y (px) | Sets the vertical distance from the upper left of the sub window to the row of buttons. | 18 |
| Font | Sets the font of the text displayed on the panel. | Meiryo UI |
| Font size | Sets the size of the text displayed on the panel. The button size changes accordingly. | 8 |
| Panel background color | Sets the background color of the panel. | 32,36,44 |
| Button color (normal) | Sets the color of unselected buttons. | 58,64,76 |
| Button color (selected) | Sets the color of the selected button. | 0,122,94 |
| Text color | Sets the color of the text displayed on the panel. | WhiteSmoke |
| Border color | Sets the color of the panel and button borders. | 84,92,106 |
| Sub window height px (0 = manual) | Sets the height of the sub window. If set to 0, adjust it by dragging the border. If a value is entered, the height is fixed to that value. | 0 |
| Refresh interval (ms) | Sets the interval for checking scrolling and other changes. Increase this value if the indicator runs slowly. | 300 |
Settings in the Colors Tab (MT5) or Color Settings Tab (MT4)
This indicator does not use this tab. Set the candlestick and line colors using "Bullish Candle Color," "Bearish Candle Color," and "Line Display Color" in the Inputs tab (MT5) or Parameters tab (MT4).