Bollinger Bands %B (Titan_BB%B)
Indicator Overview
Displaying Price Levels Relative to Bollinger Bands
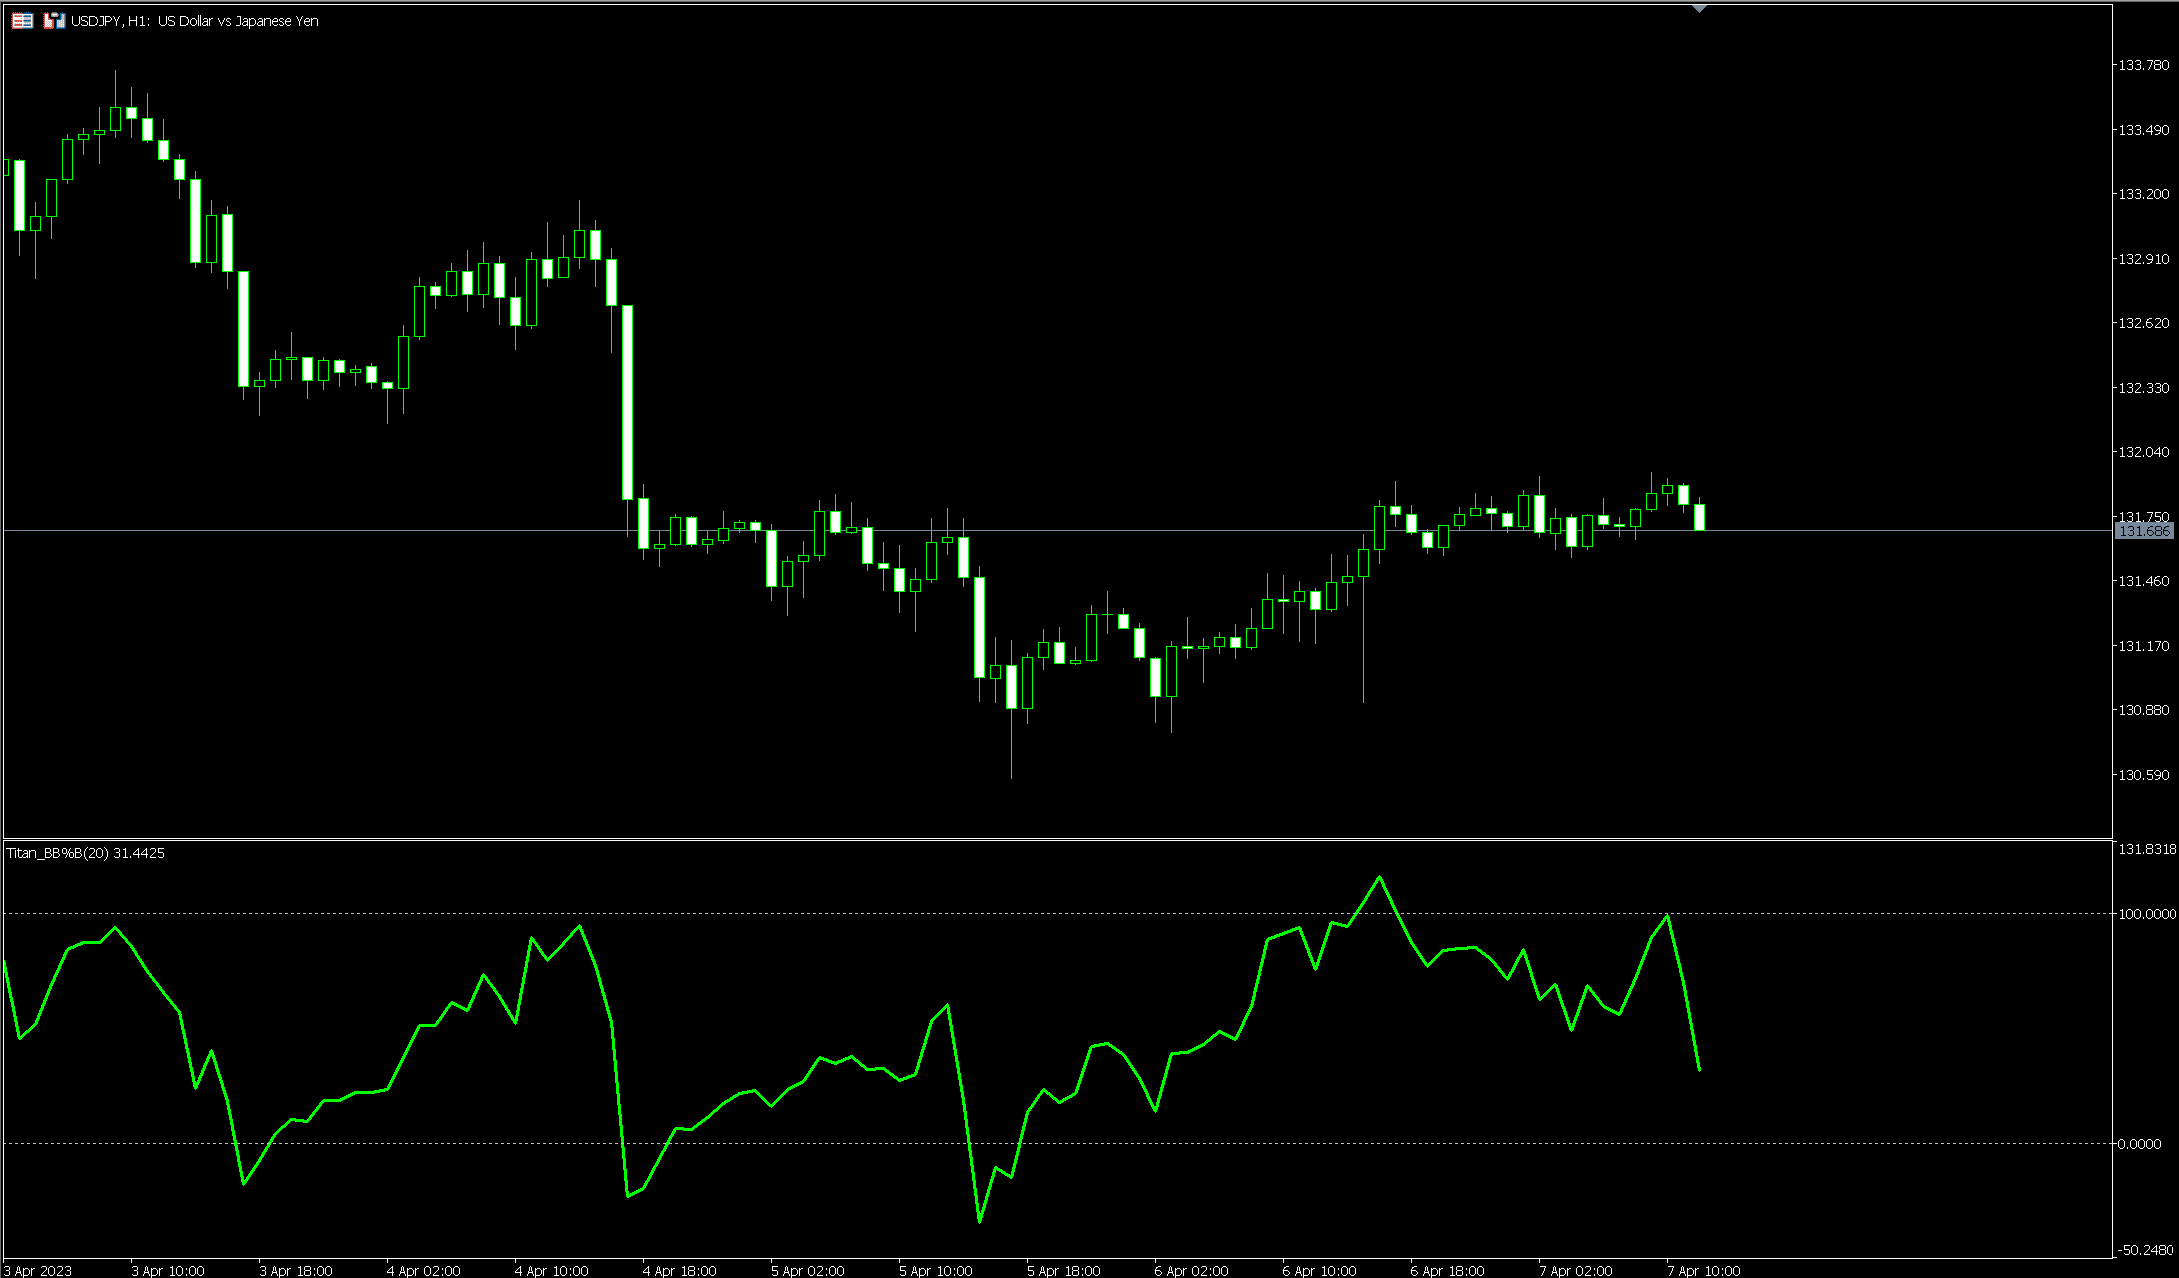
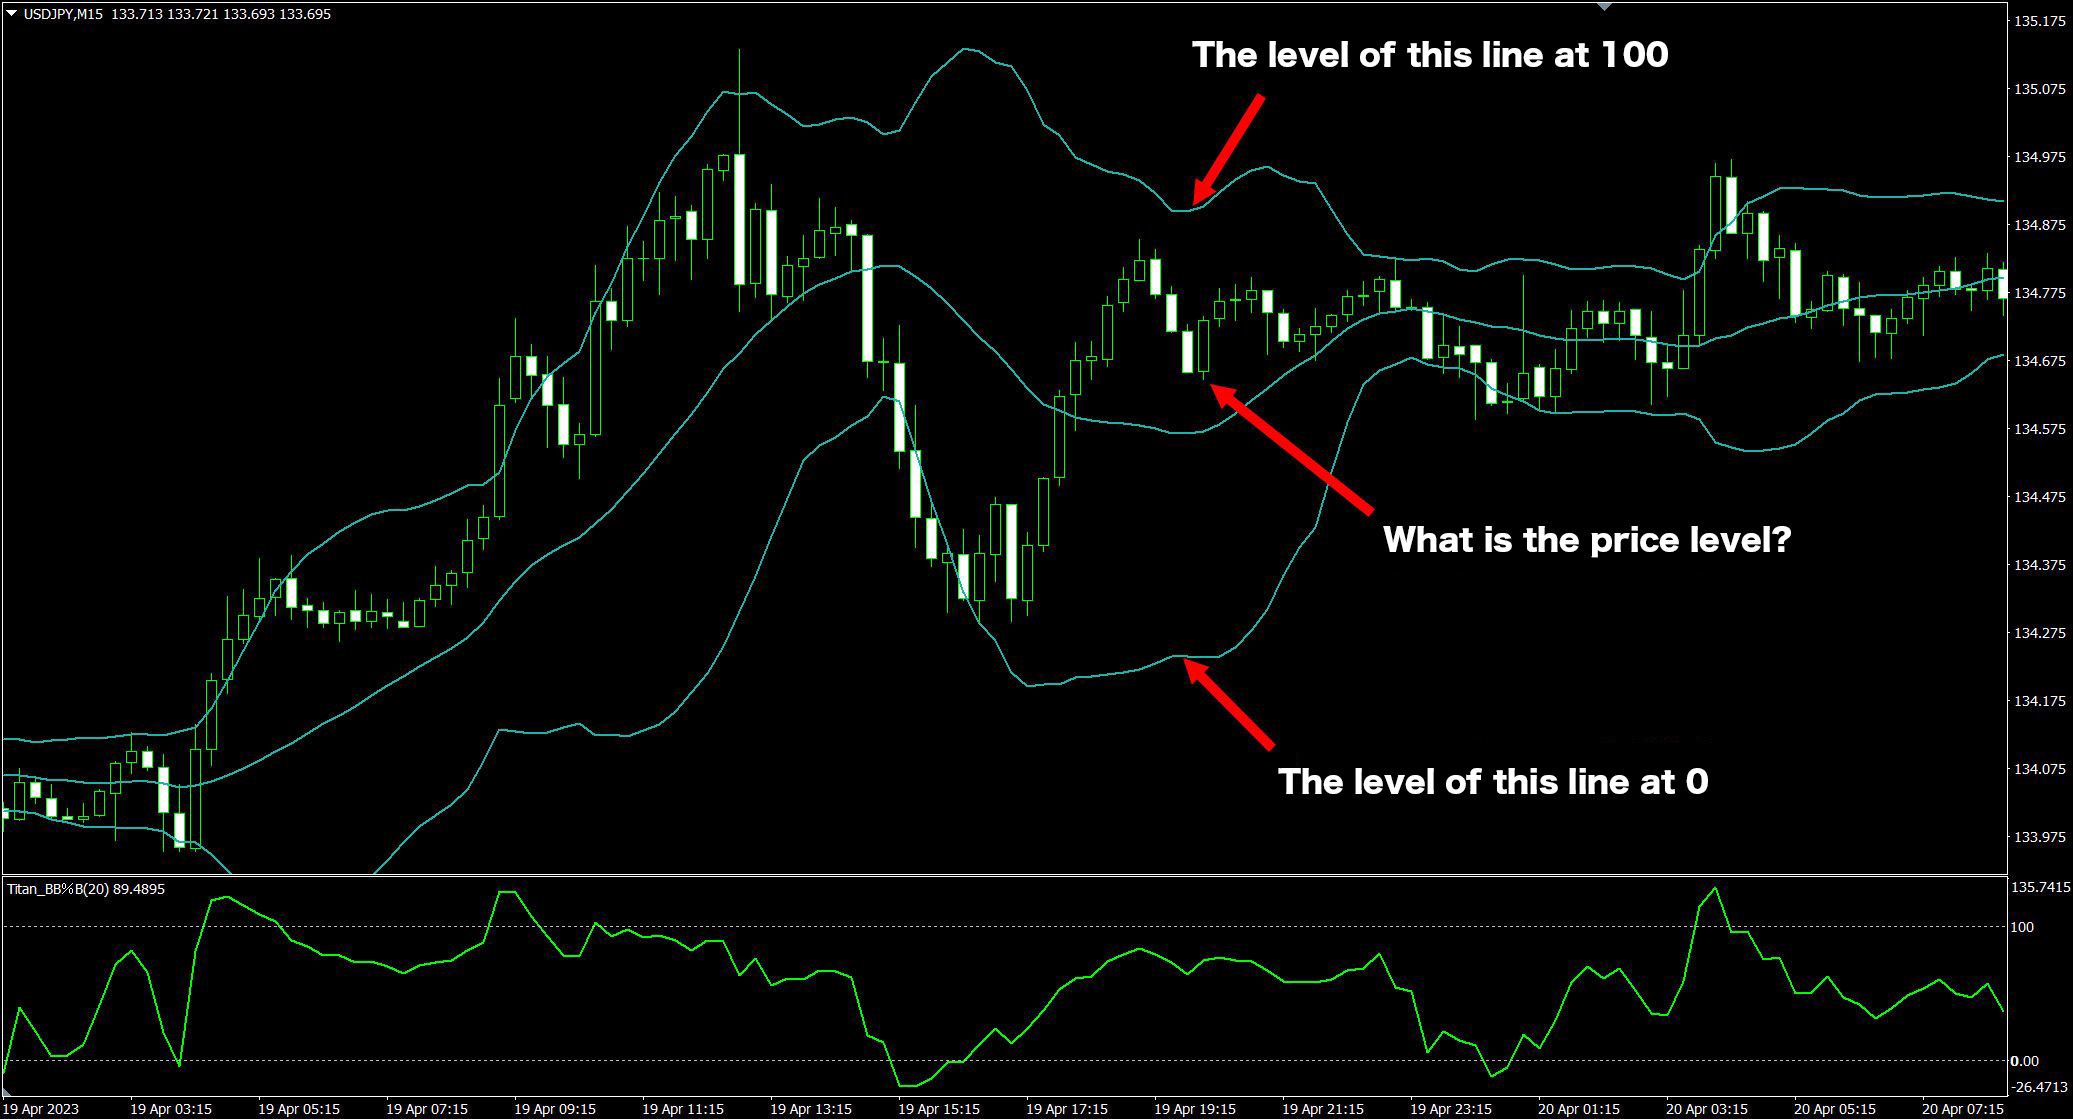
Bollinger Bands %B is an indicator that shows the position of the price within the Bollinger Bands.
Specifically, if the standard deviation parameter is set to 2, the -2σ line is set at 0 and the +2σ line at 100, indicating the level at which the price was located.
【Image of Bollinger Bands %B (displaying regular Bollinger Bands on the main chart and Bollinger Bands %B on the sub-chart)】
Various Analyses Possible by Changing Standard Deviation
By changing the value of the standard deviation, you can use this indicator in various situations such as identifying the emergence of trends or exploring overheated market conditions.
Specifically, by setting the standard deviation to 1 or 2, you can analyze the onset of trends, or set it to 2 or 3 to explore short-term overheating.
Looking at Bollinger Bands from different angles allows for efficient analysis.
Example of Analysis with Standard Deviation Set to 1
When the Bollinger Bands are set to a standard deviation of ±1, the lines are drawn slightly away from the moving average. Therefore, if the price exceeds the levels of ±1 standard deviation, it might indicate the initiation of a trend.
Setting the standard deviation to 1 in Bollinger Bands %B makes the +100 level correspond to standard deviation 1 and 0 to standard deviation -1, allowing you to check the status of the price relative to ±1 standard deviation levels easily, thus facilitating the identification of potential trend starts.
【Example of analyzing the potential for trend emergence with standard deviation set to 1】
Example of Analysis with Standard Deviation Set to 2
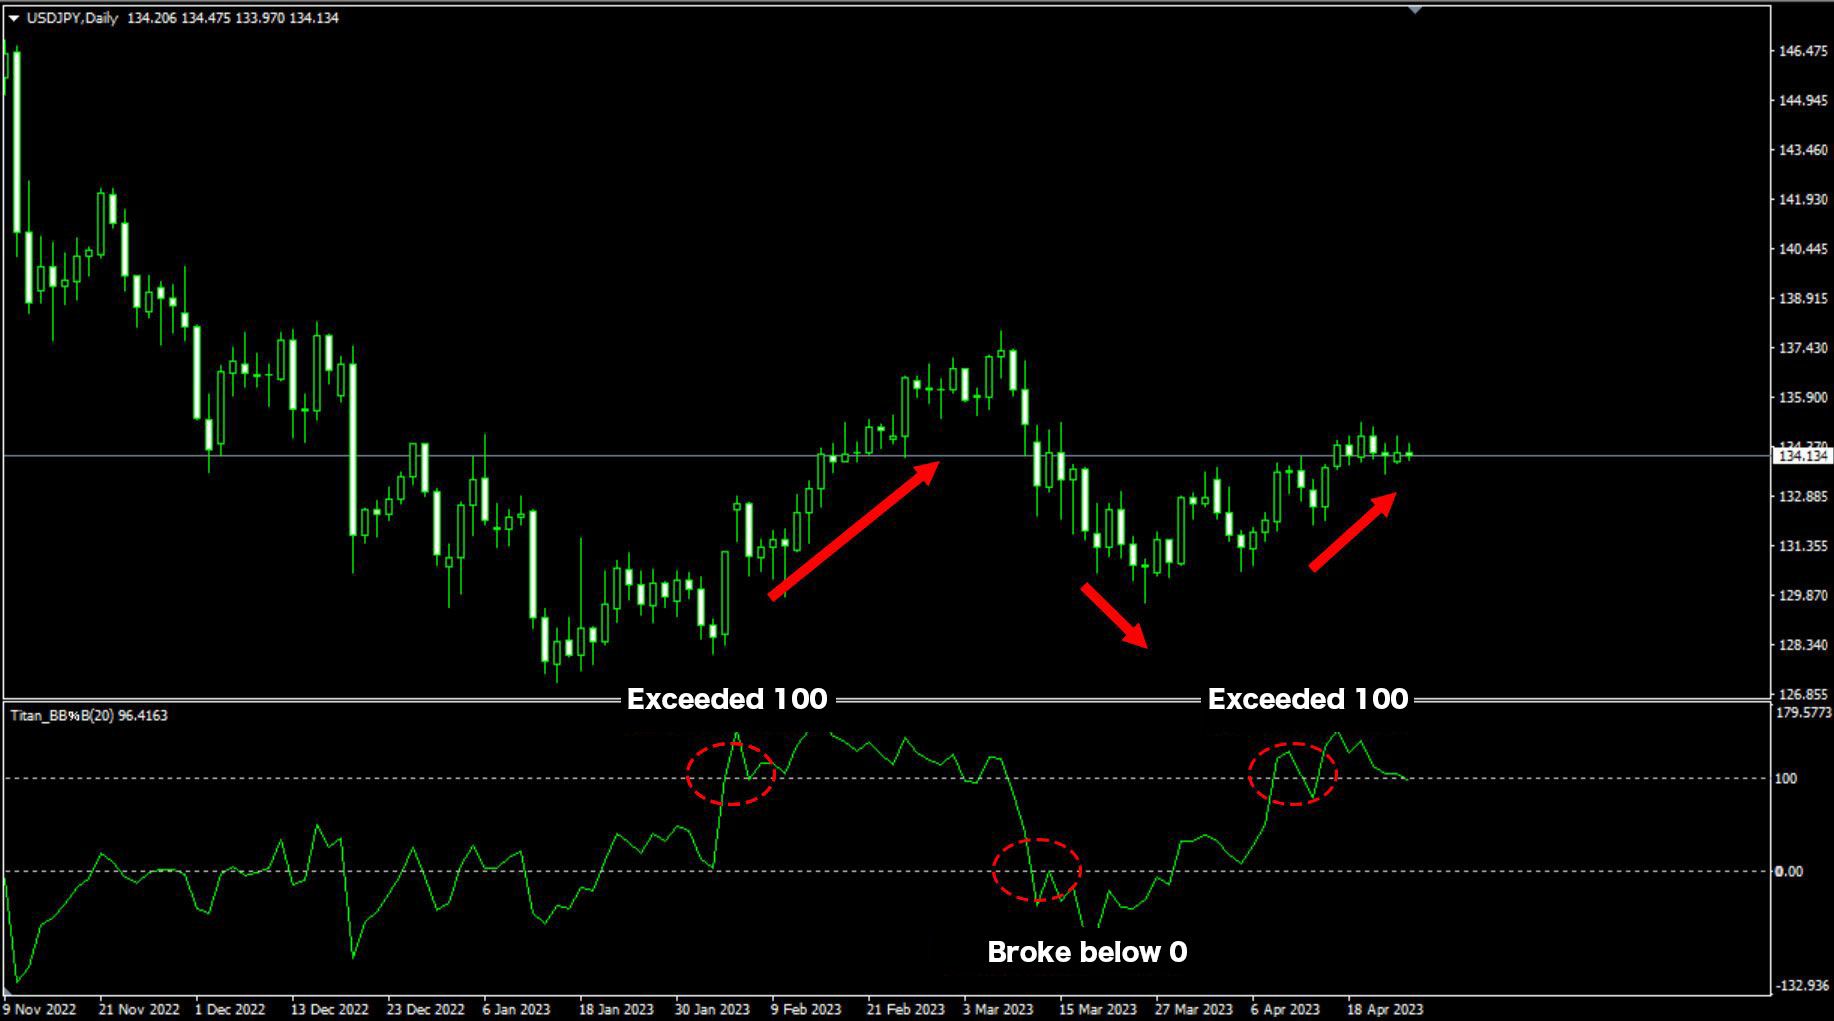
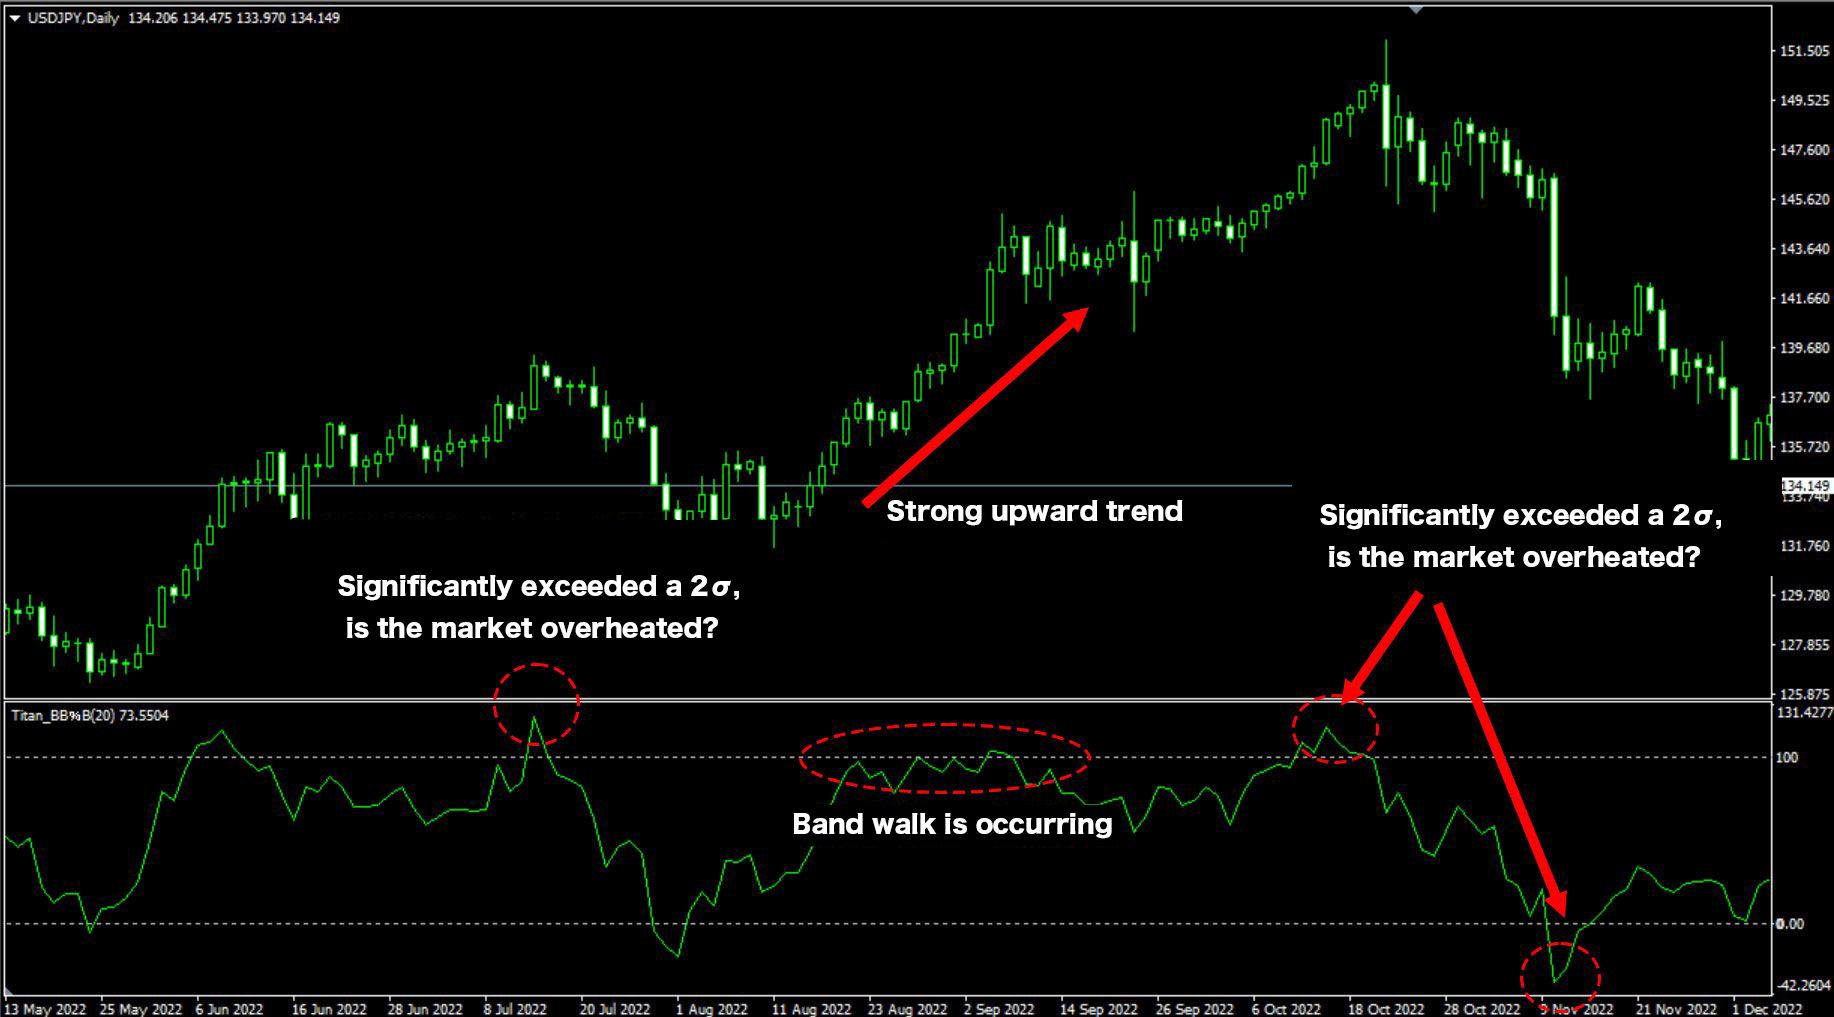
Using the lines at ±2 standard deviations of the Bollinger Bands allows for analysis of trend emergence, band walking, and short-term overheating of the market.
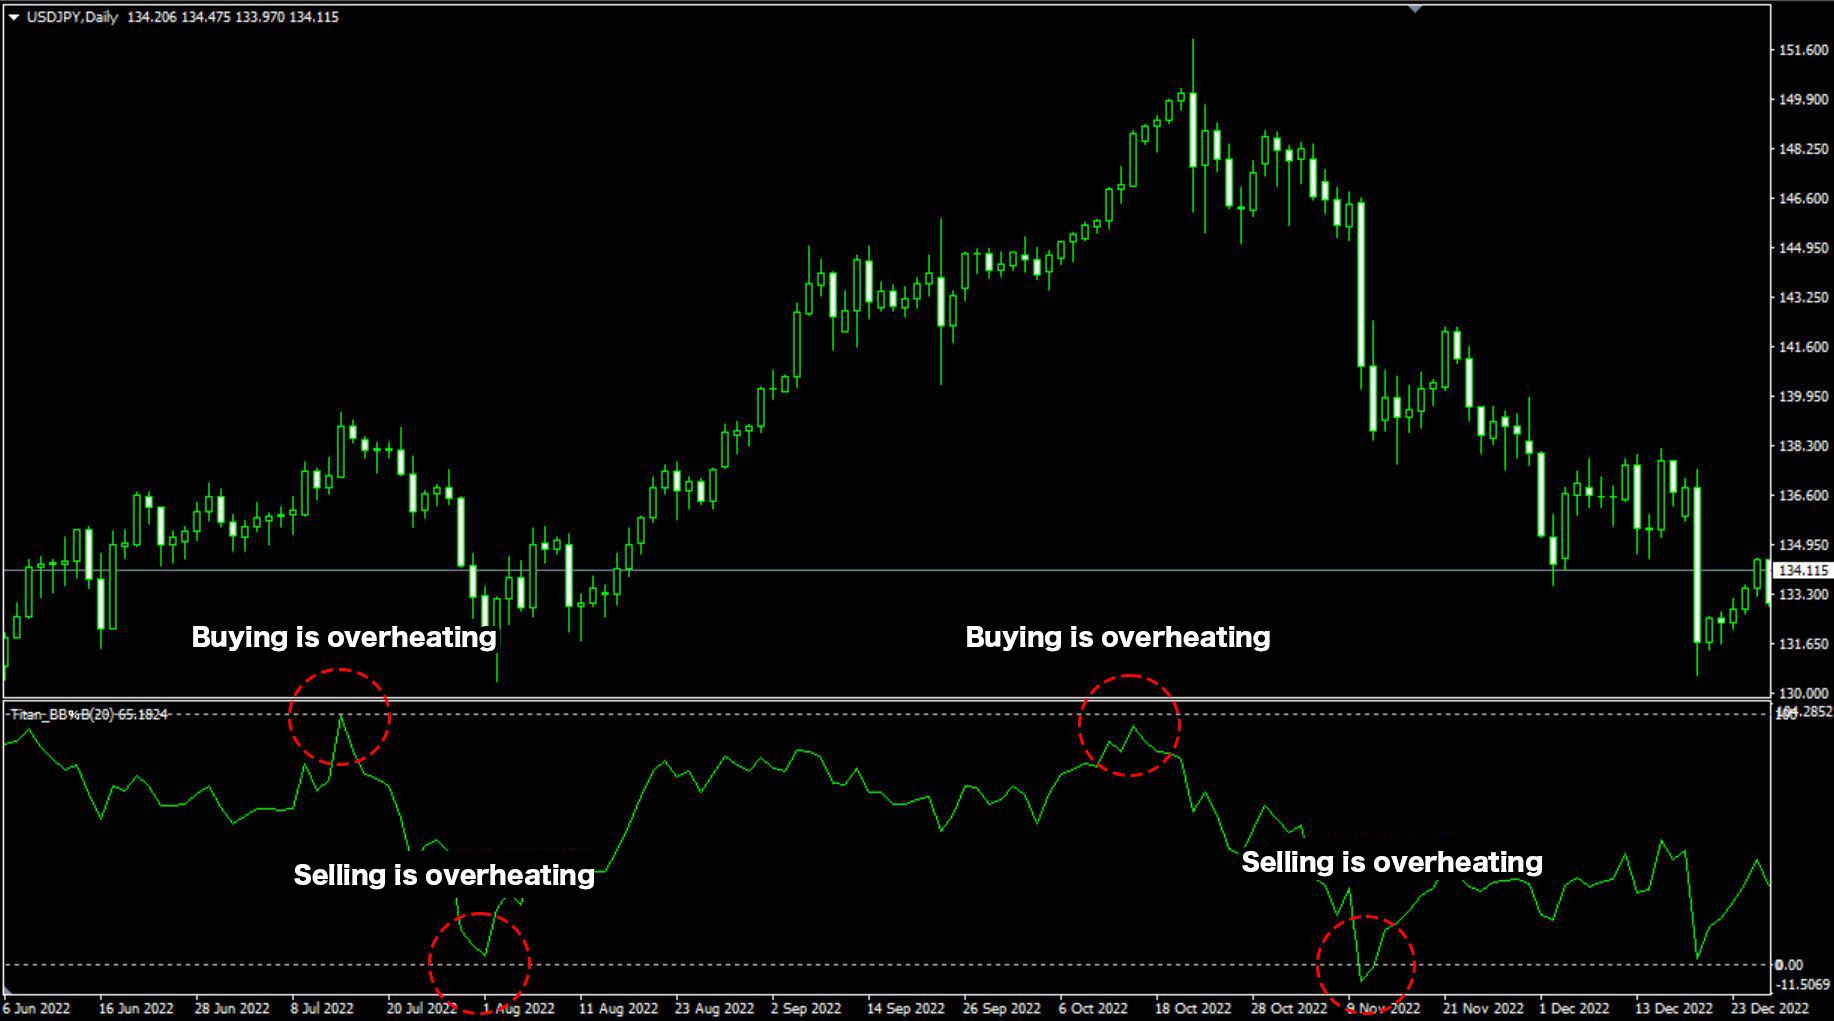
Setting the standard deviation to 2 in Bollinger Bands %B makes the +100 level correspond to standard deviation 2 and 0 to standard deviation -2, allowing for exploration of band walks and market overheating even without displaying the Bollinger Bands.
【Example of analysis with standard deviation set to 2】
Example of Analysis with Standard Deviation Set to 3
Similarly, setting the standard deviation to 3 allows for checking short-term overbought or oversold conditions.
If the movement approaches or exceeds standard deviation 3, it can be determined that the market is temporarily overheated.
【Example of analysis with standard deviation set to 3】
※This indicator only works with the Windows versions of MT5 and MT4 from TitanFX.
Indicator Terms of Use
Only those who agree to all the following items may use the indicators distributed on this website (https://research.titanfx.com):
1.The indicators and related descriptions are based on various data believed to be reliable, but their accuracy and completeness are not guaranteed.
2.The data displayed by the indicators do not guarantee your investment results. Also, the displayed content may vary due to market conditions and communication environments.
3.Please make investment decisions using indicators at your own risk. We are not responsible for any disadvantages or damages arising from the use of indicators.
4.Specifications of the indicators are subject to change without notice. Changes will be announced on the indicator description pages, etc.
5.Indicators should only be used by customers who have downloaded them. Transferring or selling the indicators to third parties is prohibited.
Indicator Settings
Input (for MT5), Parameter Input (for MT4) Tab Settings
| Variable Name | Description | Default |
|---|---|---|
| Moving average type | Choose the type of moving average for the center line. Options include Simple (SMA), Exponential (EMA), Smoothed (SMMA), and Linear weighted (LWMA). | Simple |
| Term | Specifies the period of the moving average. | 20 |
| Standard deviation | Specifies the value of the standard deviation, selectable from 1 to 3. | 2 |
| Which candlestick price | Specifies the price to be used. | Close price |
| Shift | Use this to shift the display position left or right. Entering a positive integer shifts it right, and a negative integer shifts it left. | 0 |
Color (for MT5), Color Settings (for MT4) Tab Settings
| MT5 | MT4 | Description |
|---|---|---|
| 0 | 0 | Color, thickness, and type of the line |