Moving Average Band (Titan_Multi_MA_Bands)
Indicator Overview
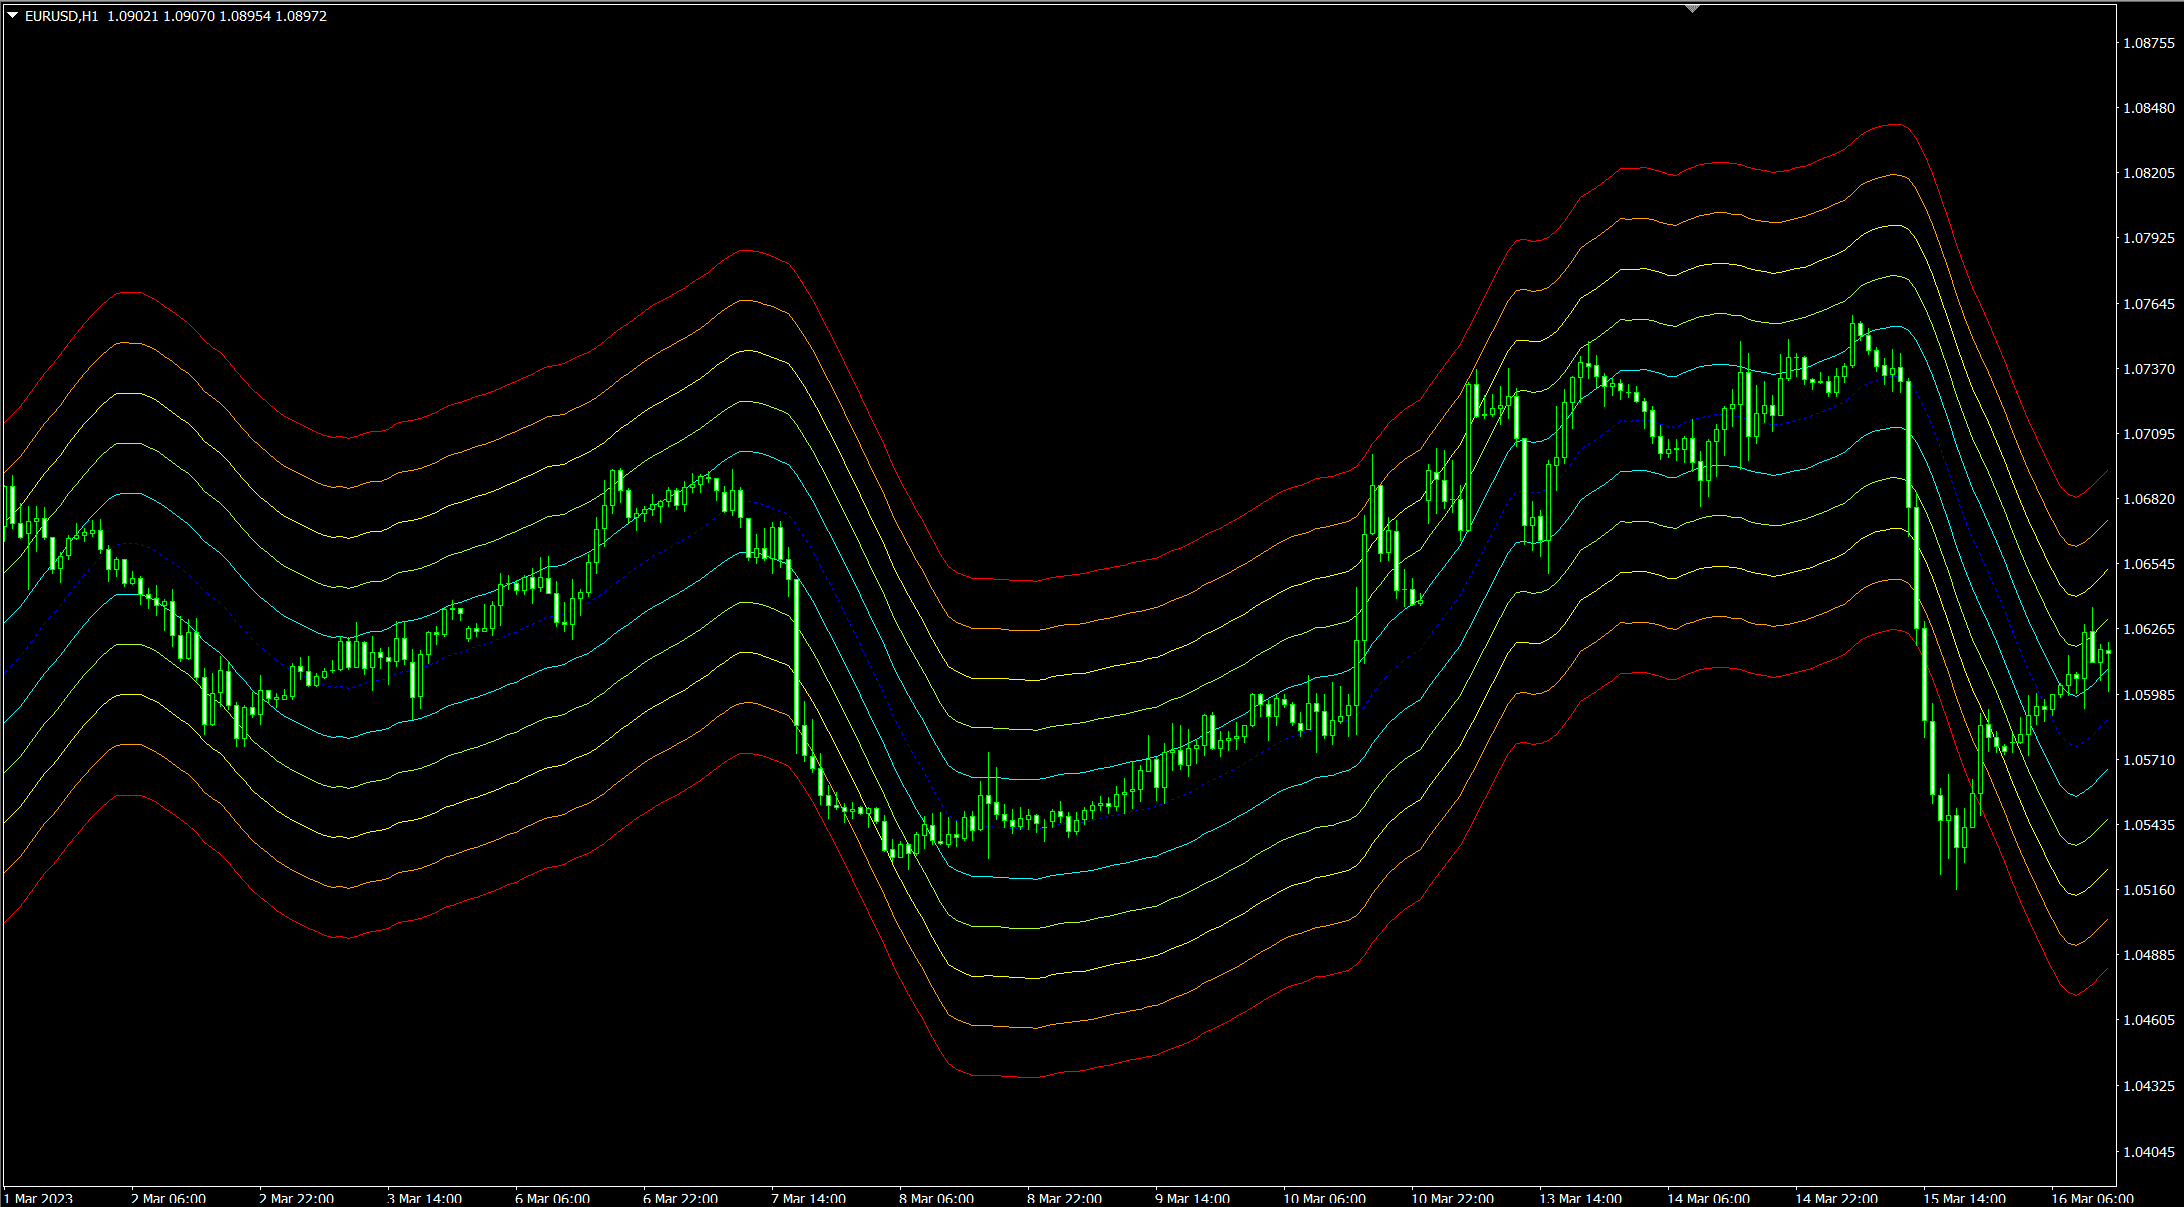
Displaying bands a specific percentage above and below the moving average
The Moving Average Band indicator displays lines (bands) at levels specified as a percentage above and below the moving average.
It allows for the drawing of up to five lines both above and below, which is useful for detecting the onset of trends, the strength of trends, and market overheat situations based on the deviation from the moving average.
Choice of four types of moving averages
You can choose from four types of moving averages: Simple Moving Average (SMA), Exponential Moving Average (EMA), Smoothed Moving Average (SMMA), and Linear Weighted Moving Average (LWMA).
Supports long-term moving averages
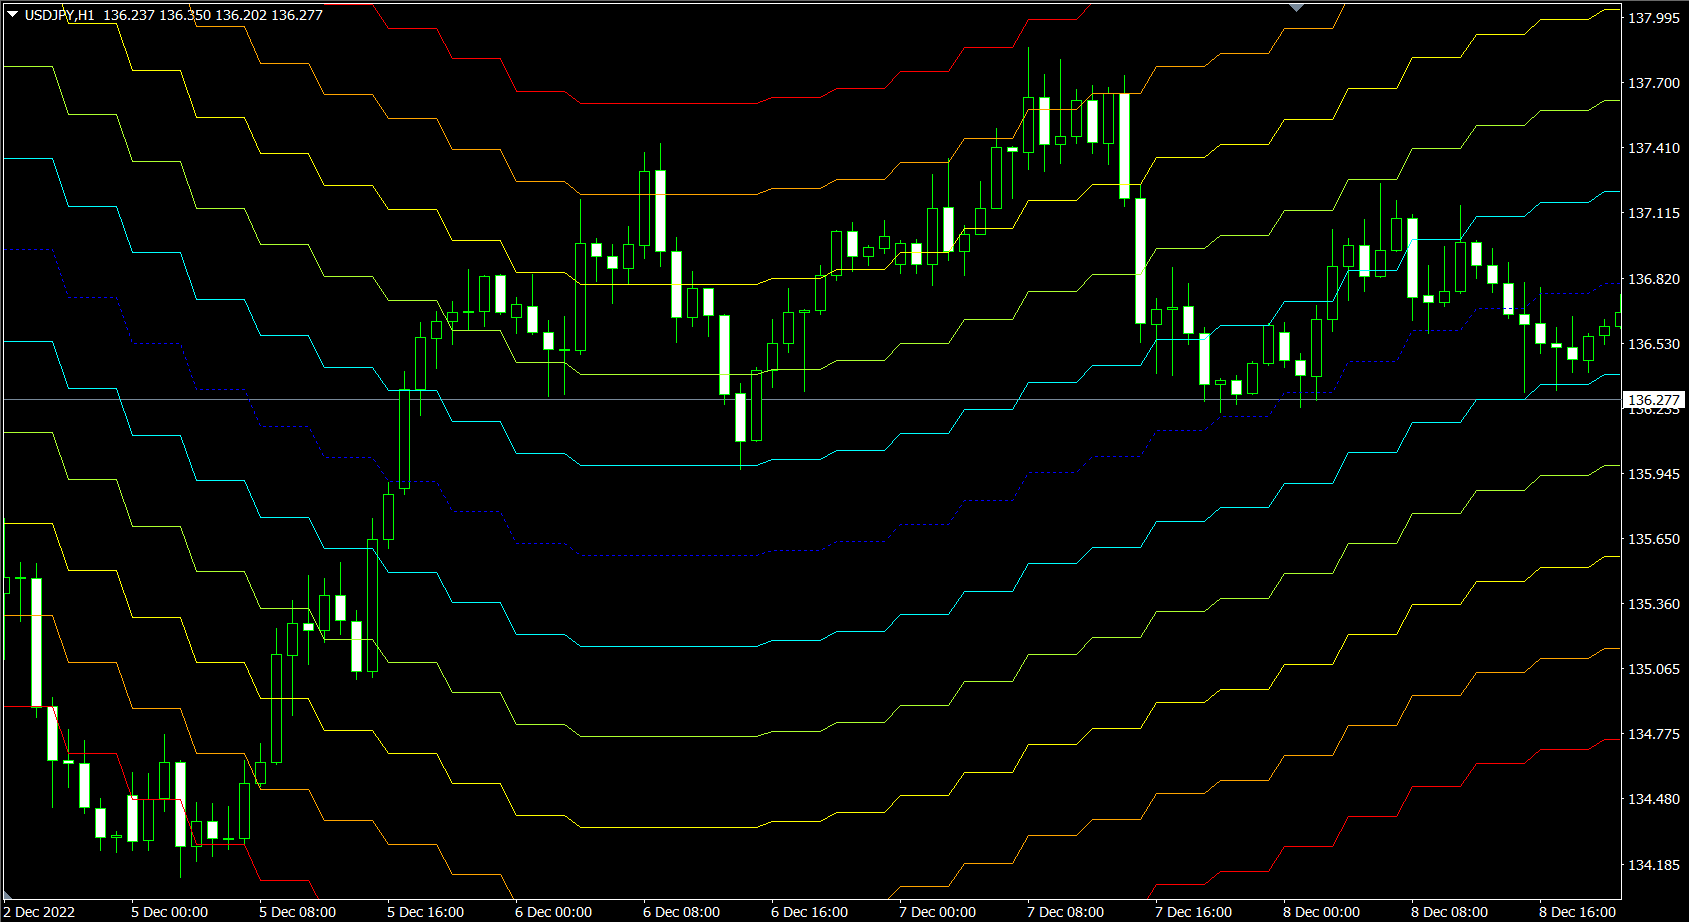
This indicator supports multi-timeframe functionality, allowing you to display long-term moving averages on your chart. For example, you can display a 4-hour moving average and its bands on a 1-hour chart.
【Example of displaying 4-hour moving average bands on a 1-hour chart】
Flexible analysis methods
You can set the deviation percentage for each line according to the asset and timeframe. Experiment with various combinations to find what works best for you.
Analysis methods vary among traders, but here are some examples of how you can use these moving average bands:
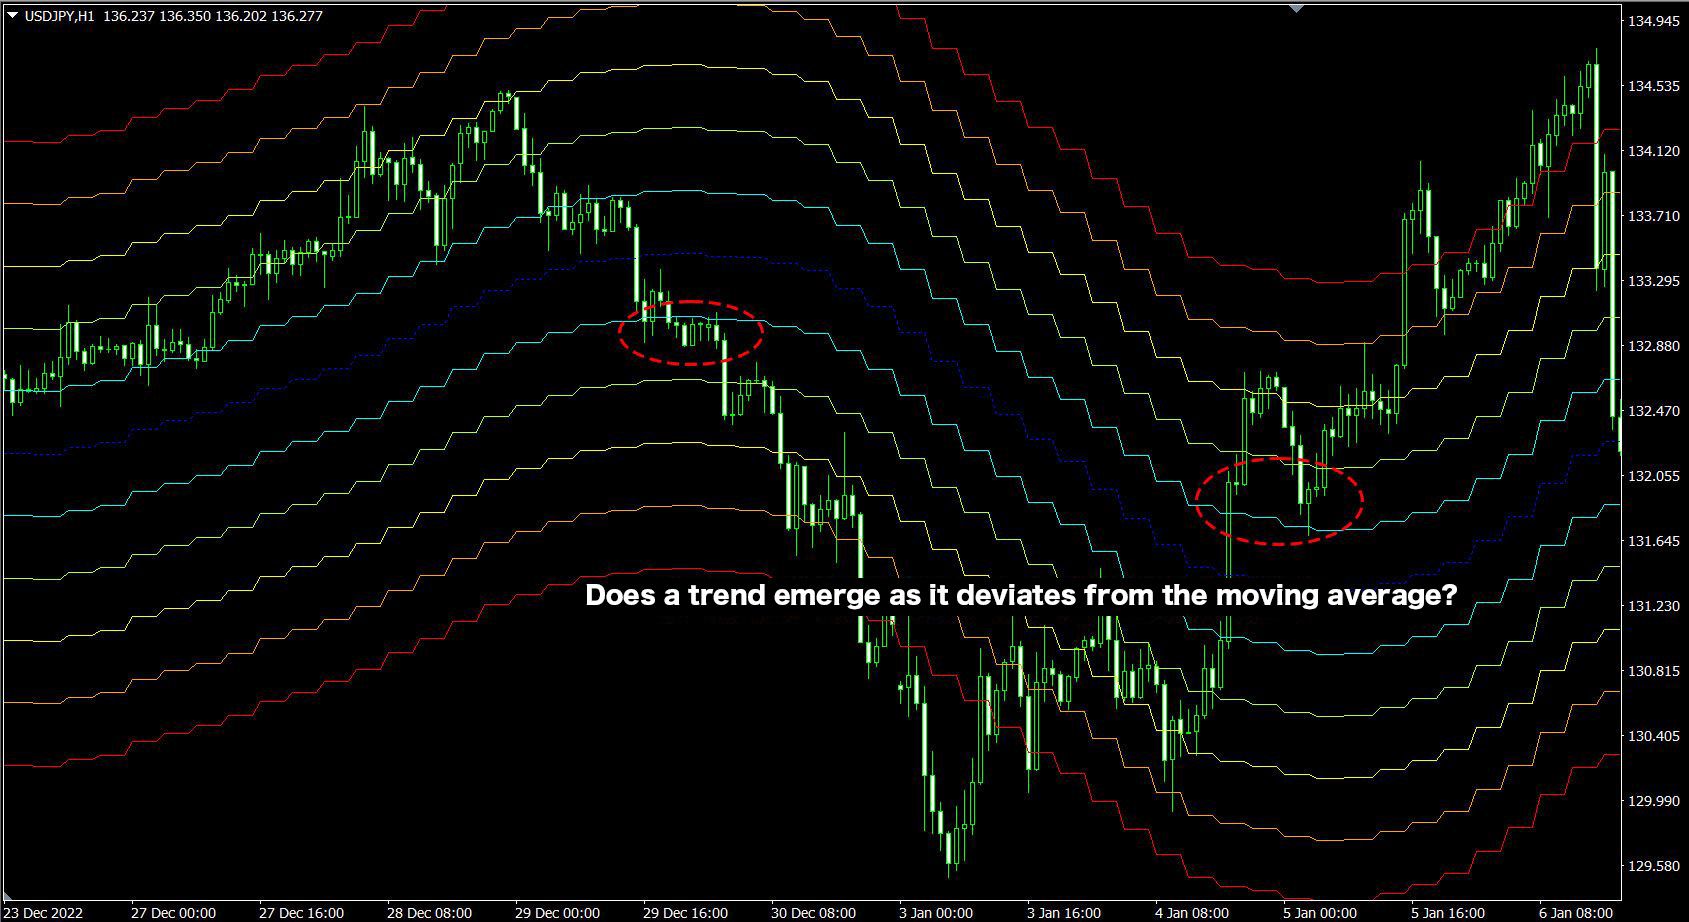
Analysis Example 1: Checking for signs of trend initiation When prices deviate from the moving average, it can indicate the start of a trend. Analyzing how much deviation typically leads to trend formation can be insightful.
【Example of analyzing signs of trend initiation】
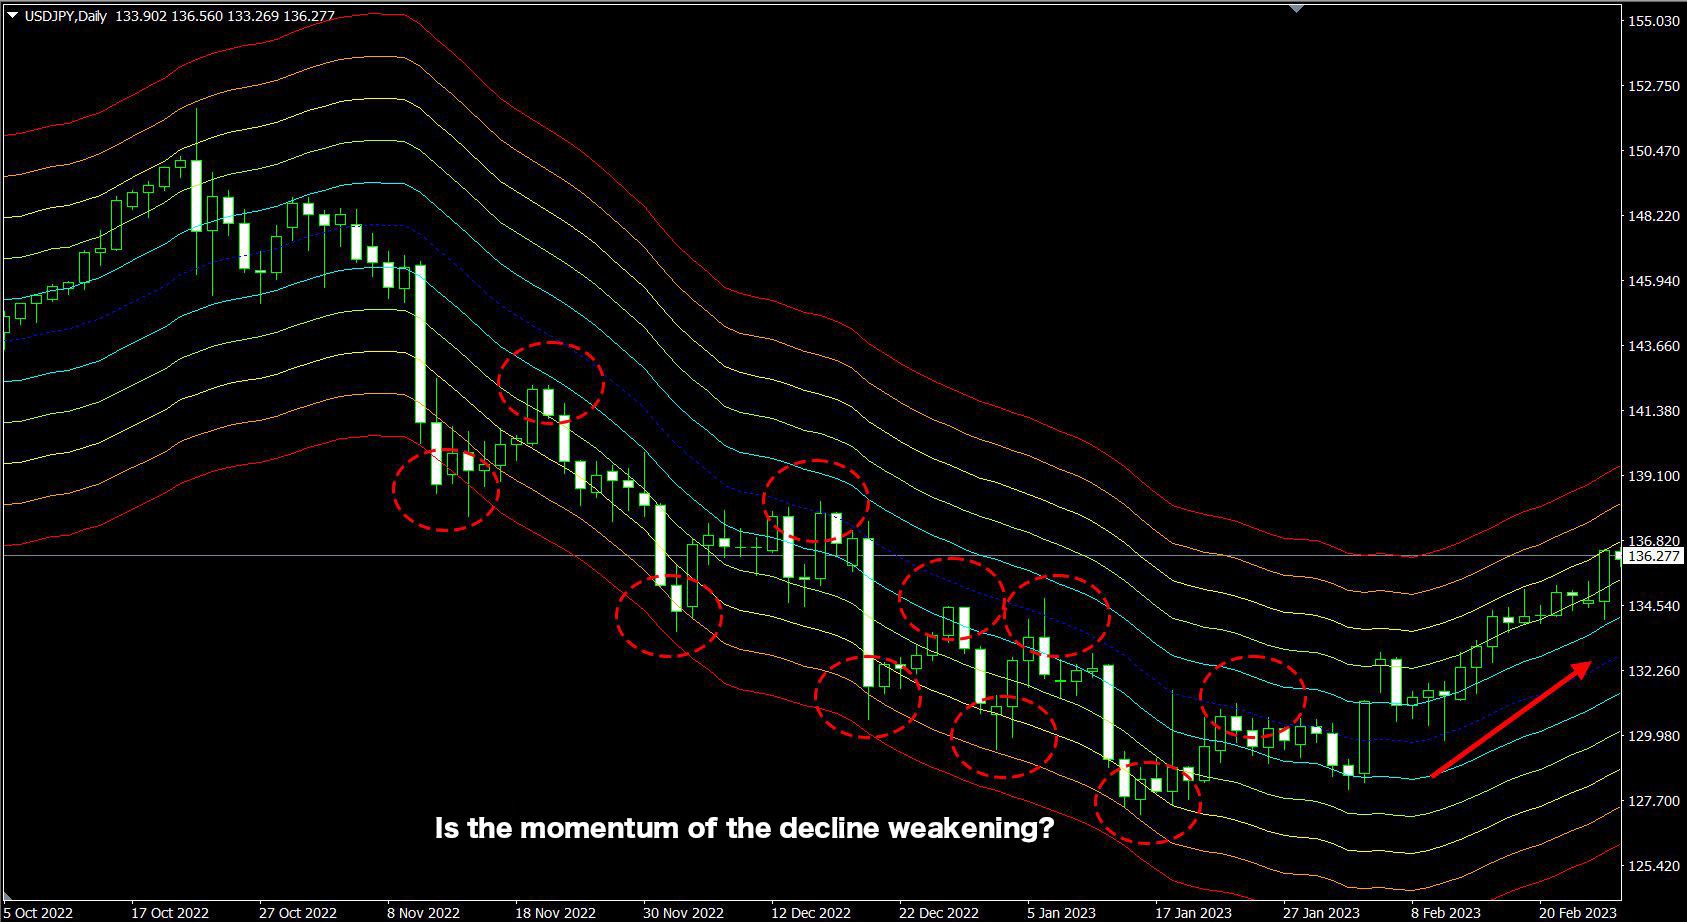
Analysis Example 2: Analyzing the momentum of a trend Observing how far prices deviate from the moving average during a trend can help you analyze its momentum.
Being aware of changes in momentum can help you respond quickly to trend reversals.
【Example of analyzing trend momentum】
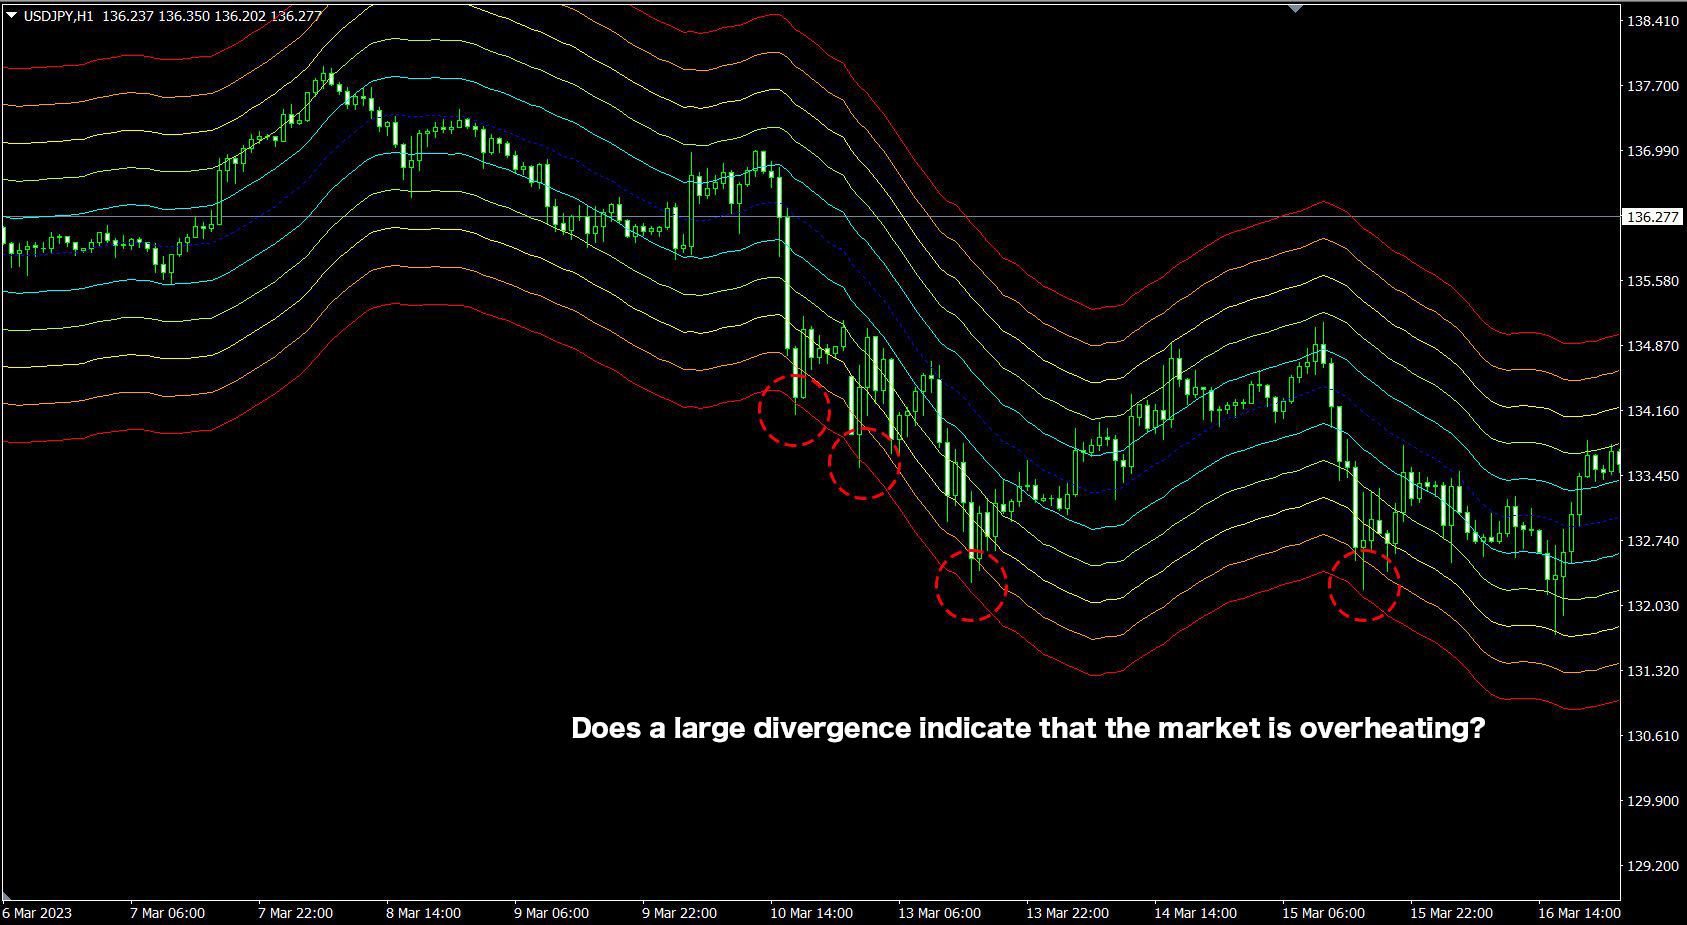
Analysis Example 3: Analyzing market overheat A large deviation from the moving average may indicate that the market is overheating, which could lead to a potential reversal in the short term.
Analyzing the extent of past deviations can help anticipate future price movements.
【Example of analyzing market overheat】
※ This indicator only operates on TitanFX's Windows version of MT5 and MT4.
Indicator Terms of Use
Only those who agree to all the following items may use the indicators distributed on this website (https://research.titanfx.com):
1.The indicators and related descriptions are based on various data believed to be reliable, but their accuracy and completeness are not guaranteed.
2.The data displayed by the indicators do not guarantee your investment results. Also, the displayed content may vary due to market conditions and communication environments.
3.Please make investment decisions using indicators at your own risk. We are not responsible for any disadvantages or damages arising from the use of indicators.
4.Specifications of the indicators are subject to change without notice. Changes will be announced on the indicator description pages, etc.
5.Indicators should only be used by customers who have downloaded them. Transferring or selling the indicators to third parties is prohibited.
Indicator Settings
Input (MT5) / Parameter Entry (MT4) Tab Settings
| Variable Name | Description | Default |
|---|---|---|
| Timeframe | Specifies which timeframe's MA to display. Select 'current' to display the MA of the chart's timeframe. | current |
| Period | Specifies the period for the moving average. | 20 |
| Moving average type | Choose from Simple (SMA), Exponential (EMA), Smoothed (SMMA), and Linear Weighted (LWMA). | Simple |
| Applied price | Specifies the price to be used. | Close price |
| Shift | Used to shift the display position left or right. Entering a positive integer shifts it right, a negative integer shifts it left. | 0 |
| Band 1-5 | Specifies whether to display each band. 'true' to display, 'false' to not display. | true |
| Band 1-5 deviation rate | Specifies the deviation width for each band in percentage. | 1.0、 1.5、2.0、2.5、3.0 |
Color (MT5) / Color Settings (MT4) Tab Settings
| MT5 | MT4 | Description |
|---|---|---|
| 0 | 0 | Color, thickness, and type of the top line of band 5 |
| 1 | 1 | Color, thickness, and type of the top line of band 4 |
| 2 | 2 | Color, thickness, and type of the top line of band 3 |
| 3 | 3 | Color, thickness, and type of the top line of band 2 |
| 4 | 4 | Color, thickness, and type of the top line of band 1 |
| 5 | 5 | Color, thickness, and type of the moving average line |
| 6 | 6 | Color, thickness, and type of the bottom line of band 1 |
| 7 | 7 | Color, thickness, and type of the bottom line of band 2 |
| 8 | 8 | Color, thickness, and type of the bottom line of band 3 |
| 9 | 9 | Color, thickness, and type of the bottom line of band 4 |
| 10 | 9 | Color, thickness, and type of the bottom line of band 5 |