Multi-timeframe moving averages (Titan_Multi_MA)
Indicator Overview
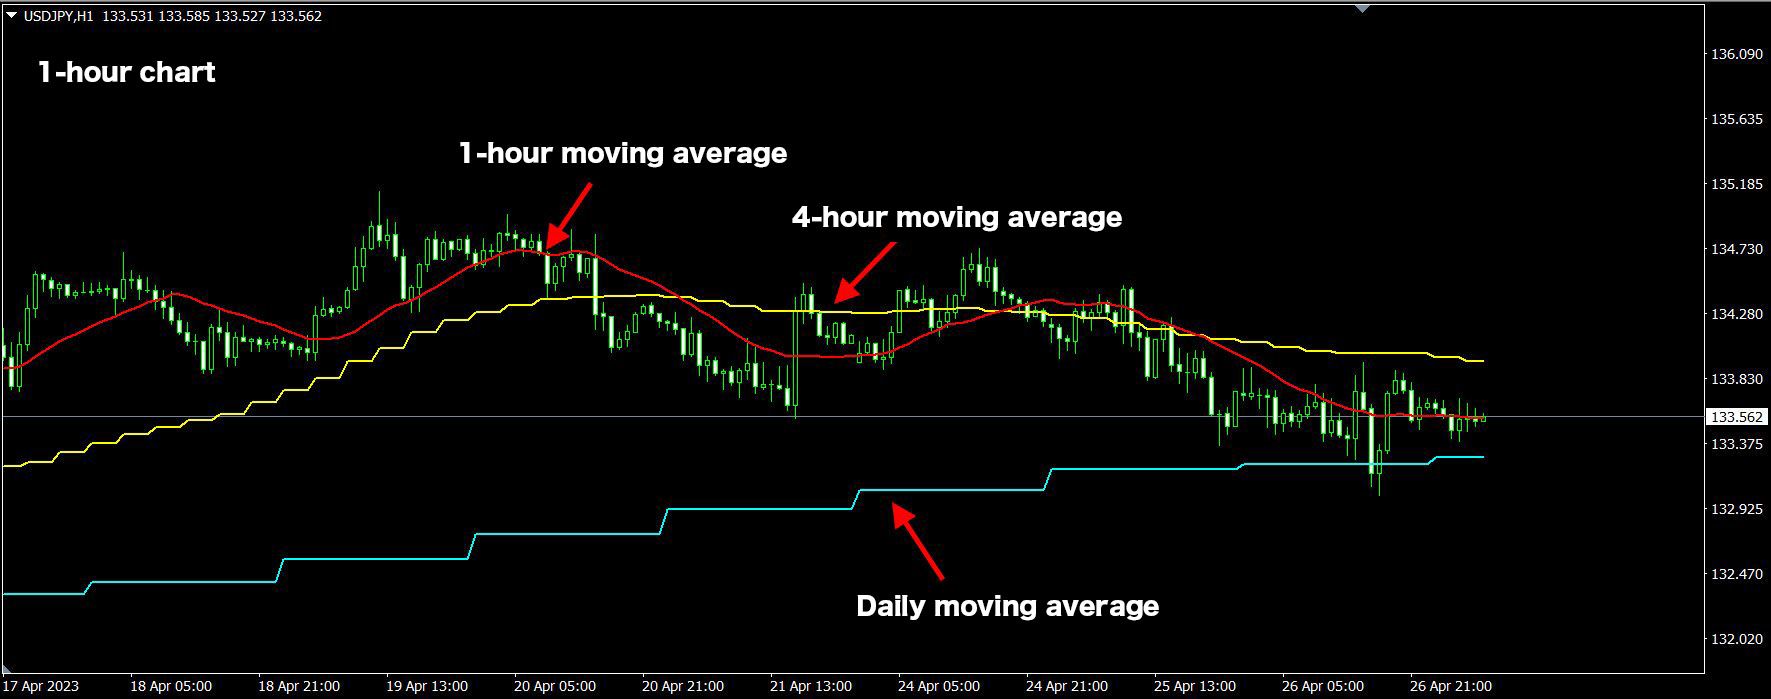
Displaying Overlaid Timeframes of Higher Periods
The multi-timeframe moving averages indicator allows not only for the display of moving averages of the chart's timeframe but also for those of longer timeframes than the chart's.
By analyzing with the levels of long-term moving averages, you can quickly notice potential support and resistance levels and significant changes in the trend.
【Example of displaying 1-hour, 4-hour, and daily moving averages on a 1-hour chart】
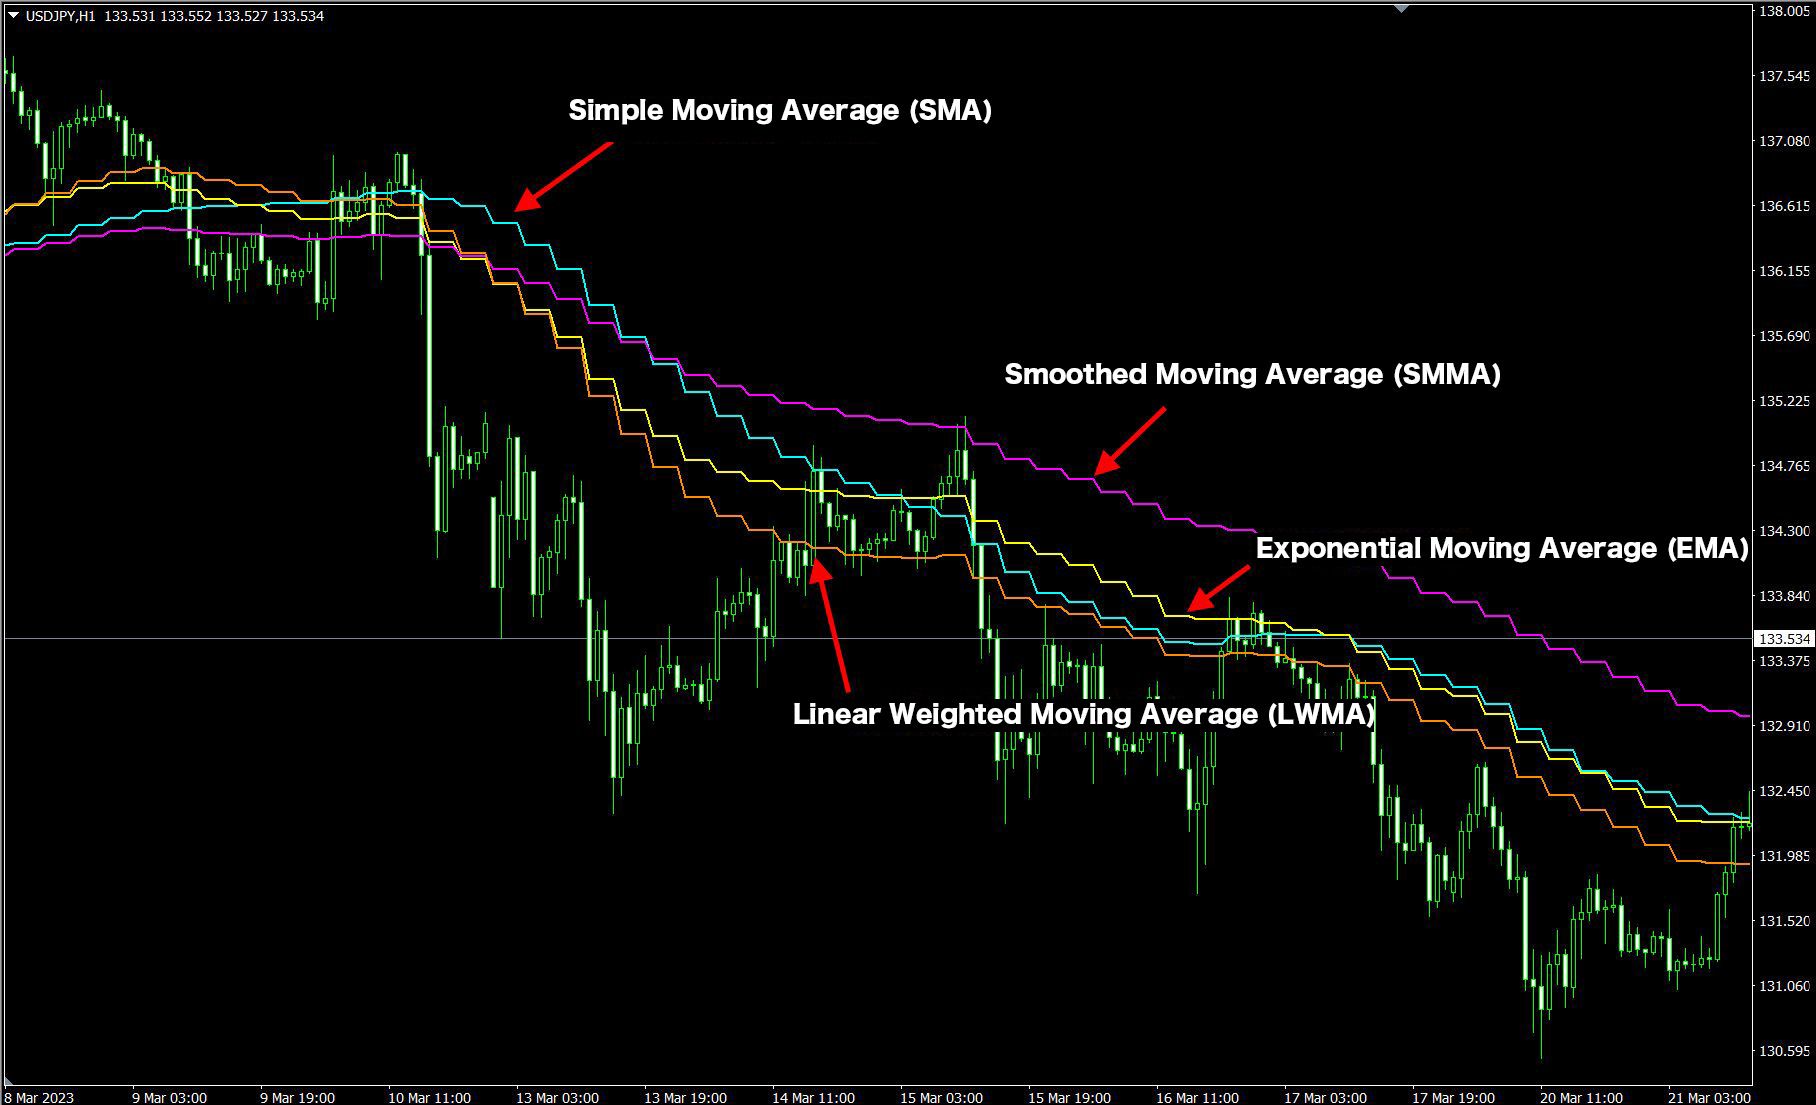
Four Types of Moving Averages Available for Display
You can display four types of moving averages: Simple Moving Average (SMA), Exponential Moving Average (EMA), Smoothed Moving Average (SMMA), and Linear Weighted Moving Average (LWMA), allowing for analysis using your preferred type of moving average.
Characteristics of Each Moving Average
Simple Moving Average (SMA): A basic moving average that simply averages the prices over a specified period. Exponential Moving Average (EMA): A moving average that gives more weight to recent prices, thus it is more sensitive to recent price changes. Smoothed Moving Average (SMMA): A moving average adjusted not to react too quickly to price movements. It is the smoothest moving average. Linear Weighted Moving Average (LWMA): A moving average that increases the weight of prices closer to the current period. It reacts slower than the EMA but gets closer to the price when a trend occurs.
【Comparison of the four moving averages】
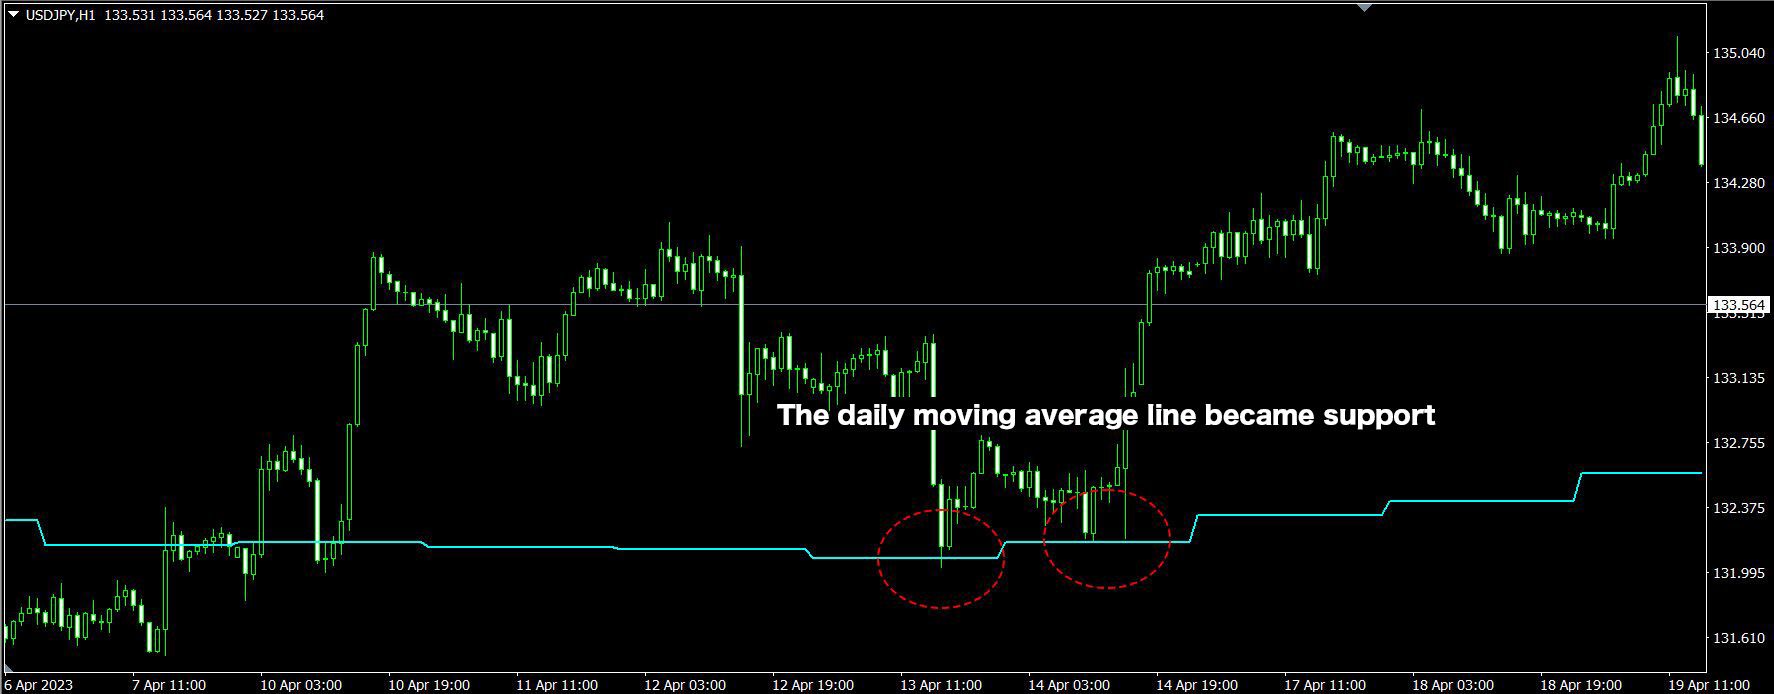
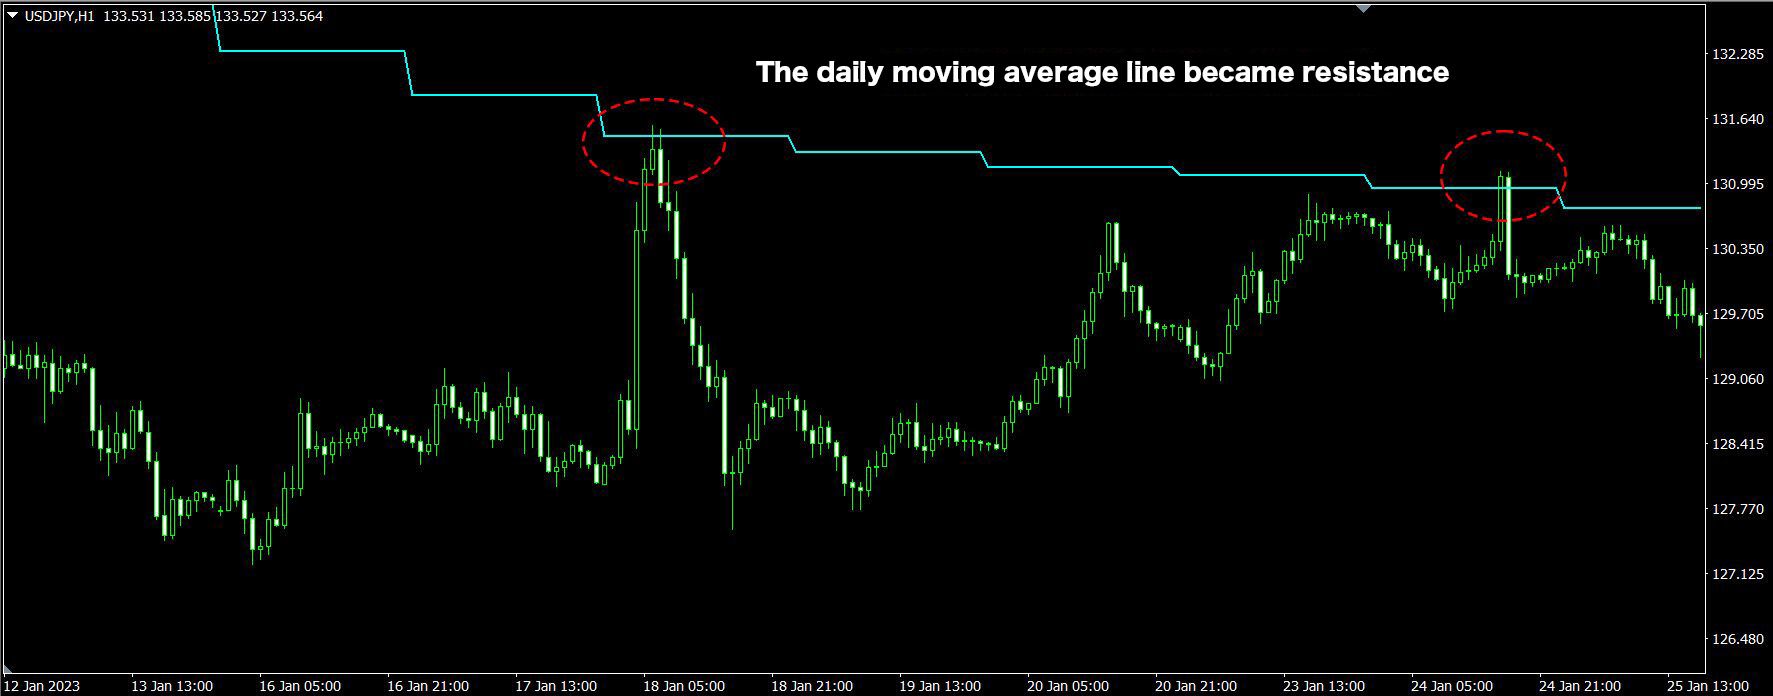
Long-Term Moving Averages as Support and Resistance
Moving averages are widely used by many traders, and levels close to moving averages are often regarded as potential support or resistance.
Long-term moving averages, such as those of daily charts, are more prominent compared to short-term ones and frequently act as support or resistance.
Displaying long-term moving averages can be invaluable for identifying opportunities for buying dips or selling rallies, as well as for determining levels for stop-loss and take-profit.
【Example where the level near the daily moving average acted as support】
【Example where the level near the daily moving average acted as resistance】
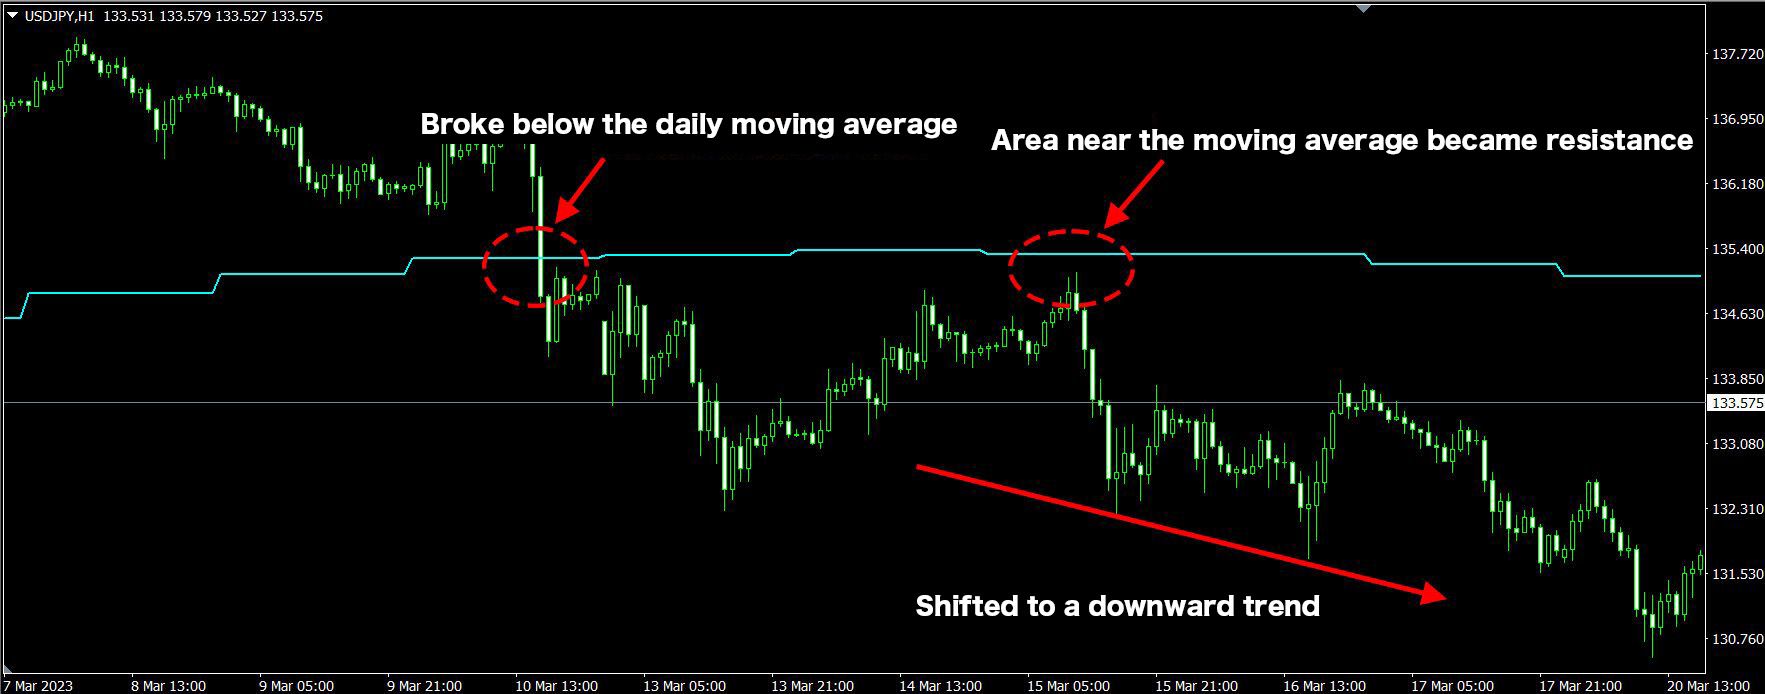
Potential Major Shifts When Prices Break Long-Term Moving Averages
Moving averages can help identify trends through the relationship between prices and the moving averages, and the direction of the averages.
When prices move beyond long-term moving averages, it often signals a potential major trend reversal.
【Example where price dropped below the daily moving average, signaling a downtrend】
※This indicator only works with the Windows versions of MT5 and MT4 from TitanFX.
Indicator Terms of Use
Only those who agree to all the following items may use the indicators distributed on this website (https://research.titanfx.com):
1.The indicators and related descriptions are based on various data believed to be reliable, but their accuracy and completeness are not guaranteed.
2.The data displayed by the indicators do not guarantee your investment results. Also, the displayed content may vary due to market conditions and communication environments.
3.Please make investment decisions using indicators at your own risk. We are not responsible for any disadvantages or damages arising from the use of indicators.
4.Specifications of the indicators are subject to change without notice. Changes will be announced on the indicator description pages, etc.
5.Indicators should only be used by customers who have downloaded them. Transferring or selling the indicators to third parties is prohibited.
Indicator Settings
Input Tab (for MT5), Parameter Input Tab (for MT4)
| Variable Name | Description | Default |
|---|---|---|
| Timeframe | Specifies which timeframe's moving average to display. Select current to display the chart’s timeframe moving average. | current |
| Period | Specifies the period for the moving average. | 20 |
| Moving average type | Specifies the type of moving average. Choices include Simple (SMA), Exponential (EMA), Smoothed (SMMA), and Linear weighted (LWMA). | Simple |
| Applied price | Specifies the price to use. | Close price |
Color Tab (for MT5), Color Settings Tab (for MT4)
| MT5 | MT4 | Description |
|---|---|---|
| Titan_Multi_MA | 0 | Color, thickness, and type of the moving average line |