Multi-Timeframe Parabolic SAR (Titan_Multi_Parabolic)
Indicator Overview
Displaying Multi-Timeframe Parabolic SAR
The Multi-Timeframe Parabolic SAR indicator allows for displaying the Parabolic SAR from a longer timeframe than the one currently being viewed. By showing the Parabolic SAR from longer timeframes, it quickly alerts traders to the possibility of major trend reversals, facilitating efficient analysis.
Analyzing while checking the levels of long-term moving averages helps in quickly identifying potential support or resistance levels and significant changes in the trend.
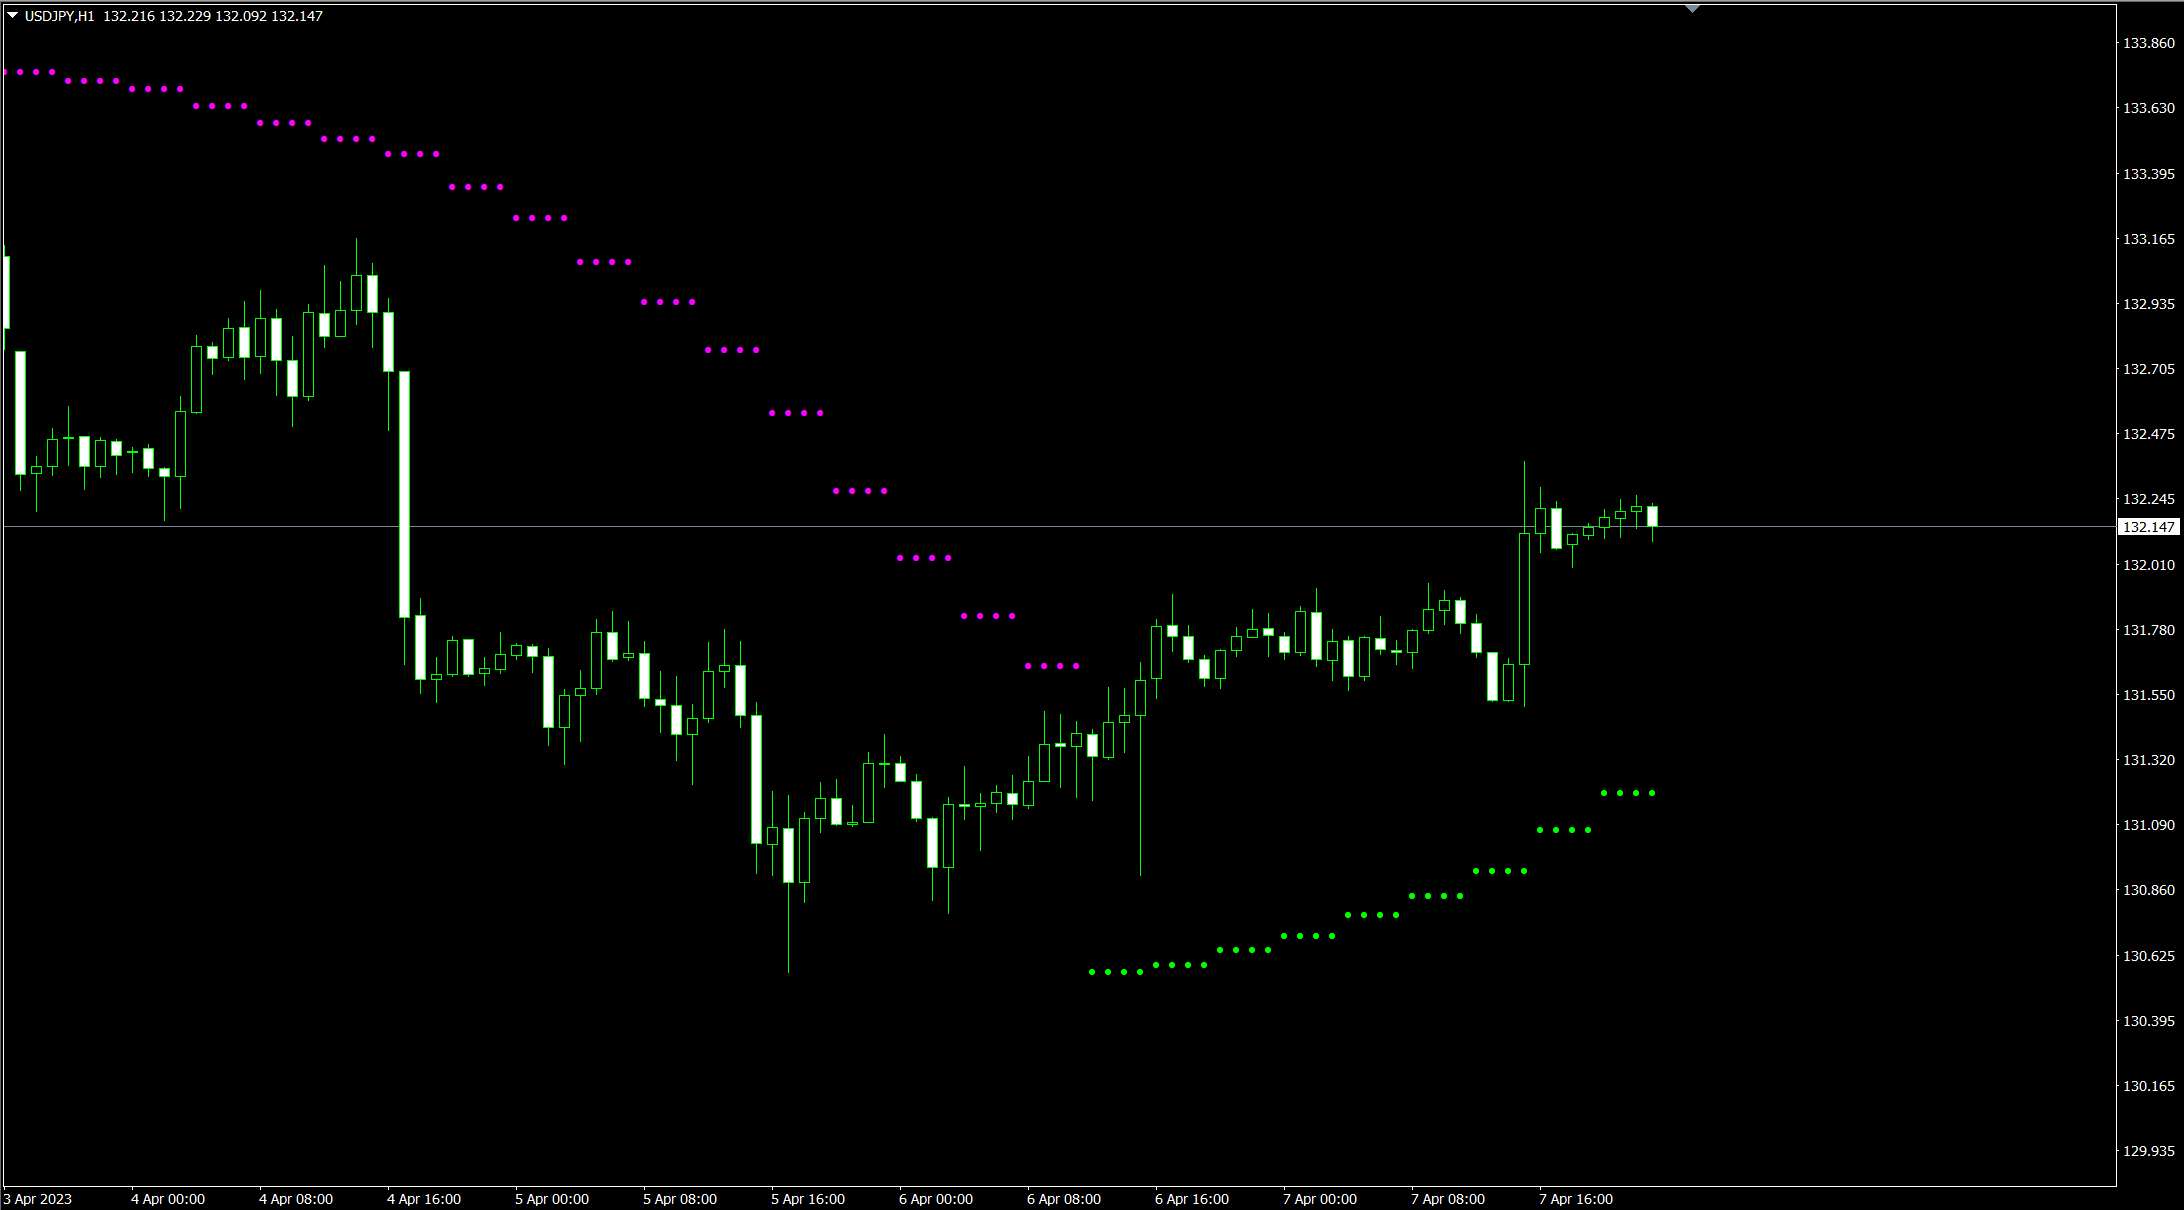
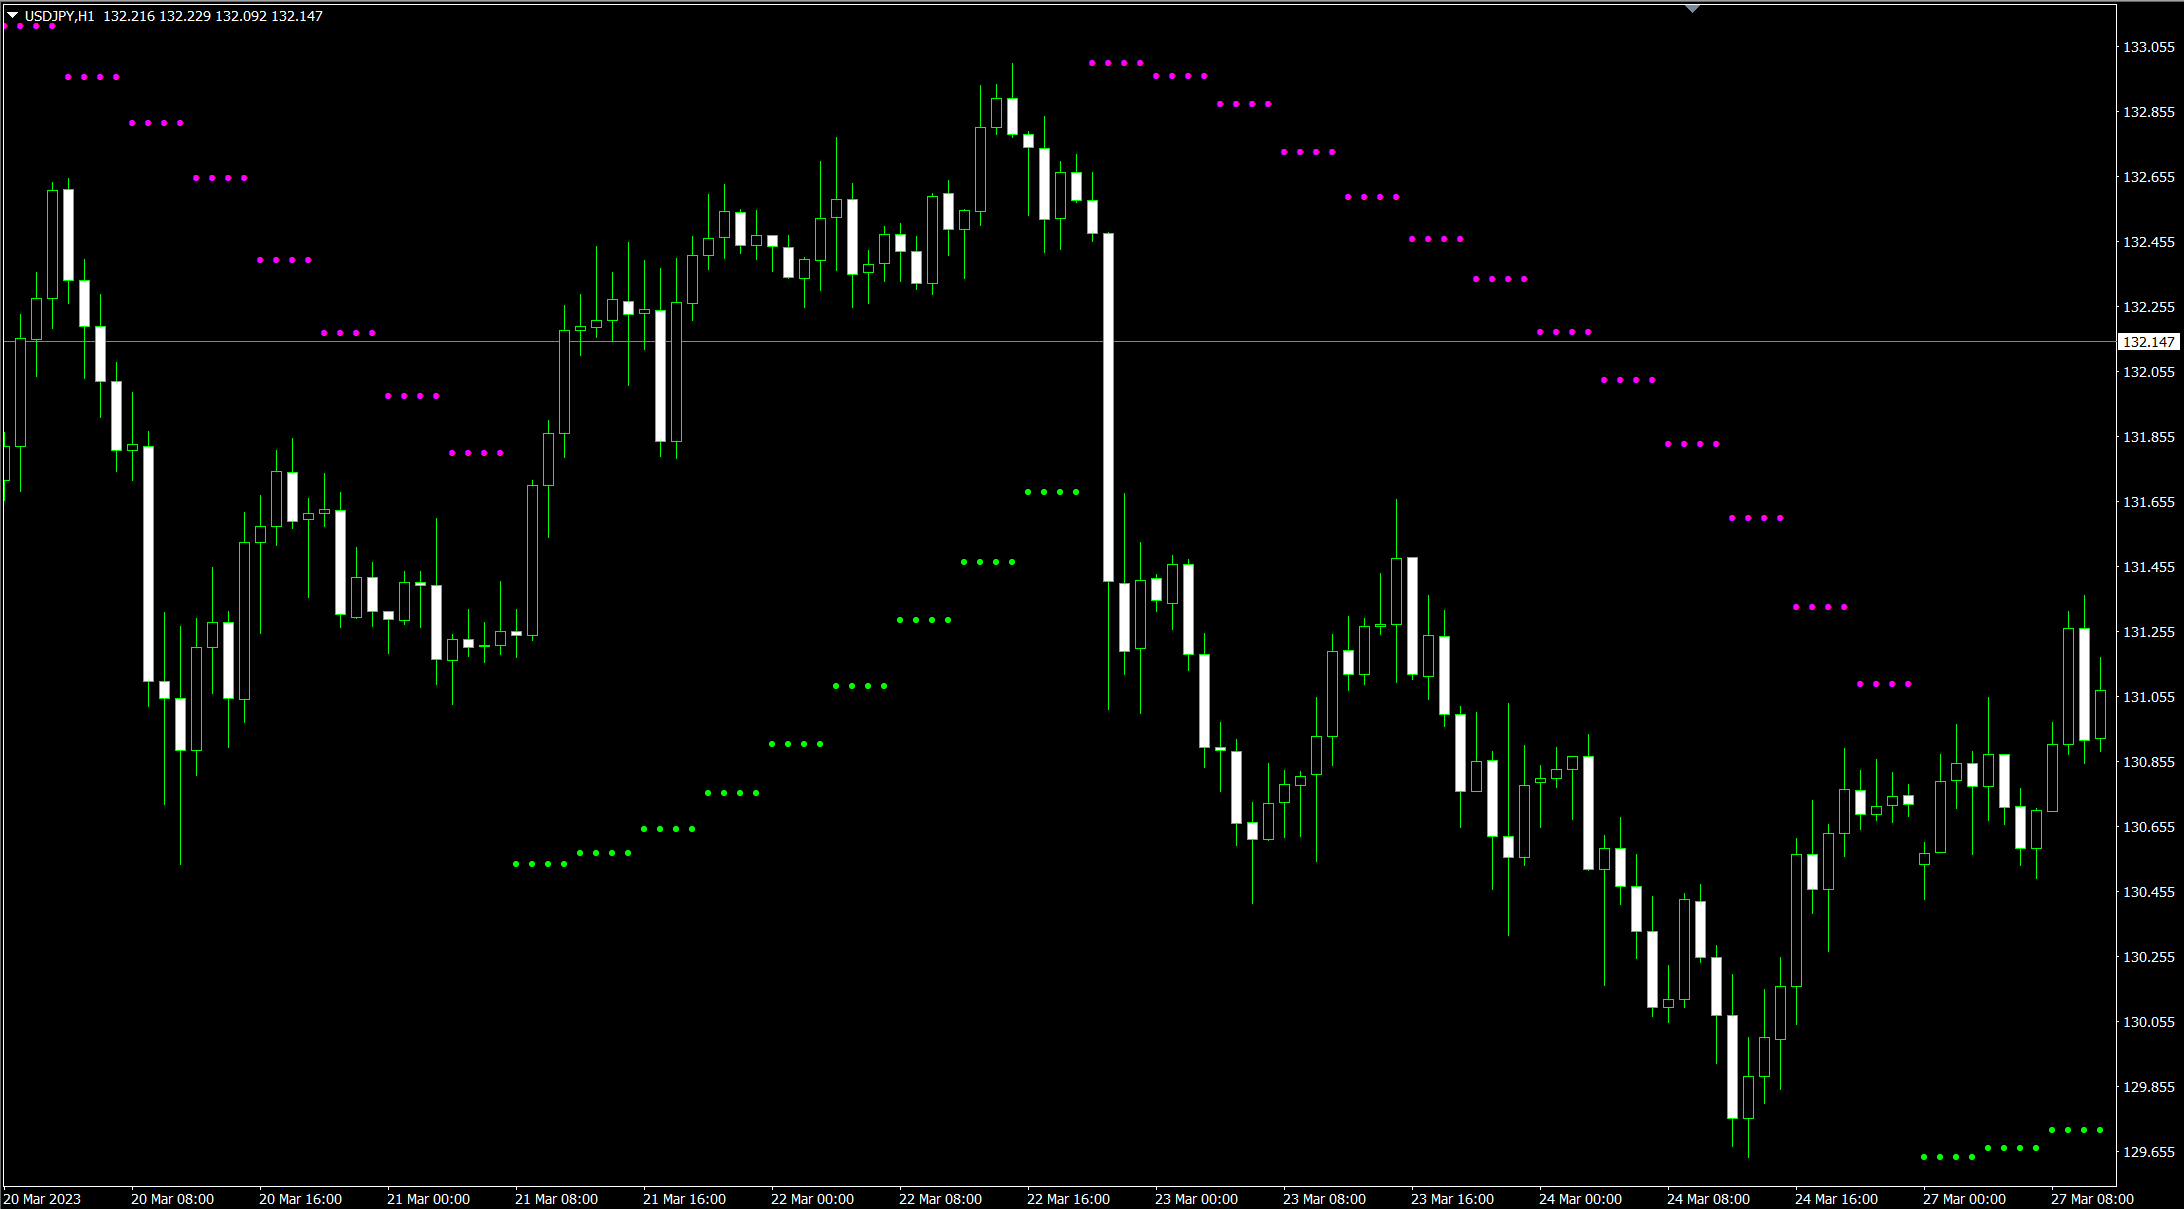
【Example of Displaying 4-hour Parabolic SAR on a 1-hour Chart】
What is Parabolic SAR?
Parabolic SAR is an indicator that displays points, known as SAR (Stop and Reverse), on the chart in a parabolic pattern that serve as markers for potential trend reversals.
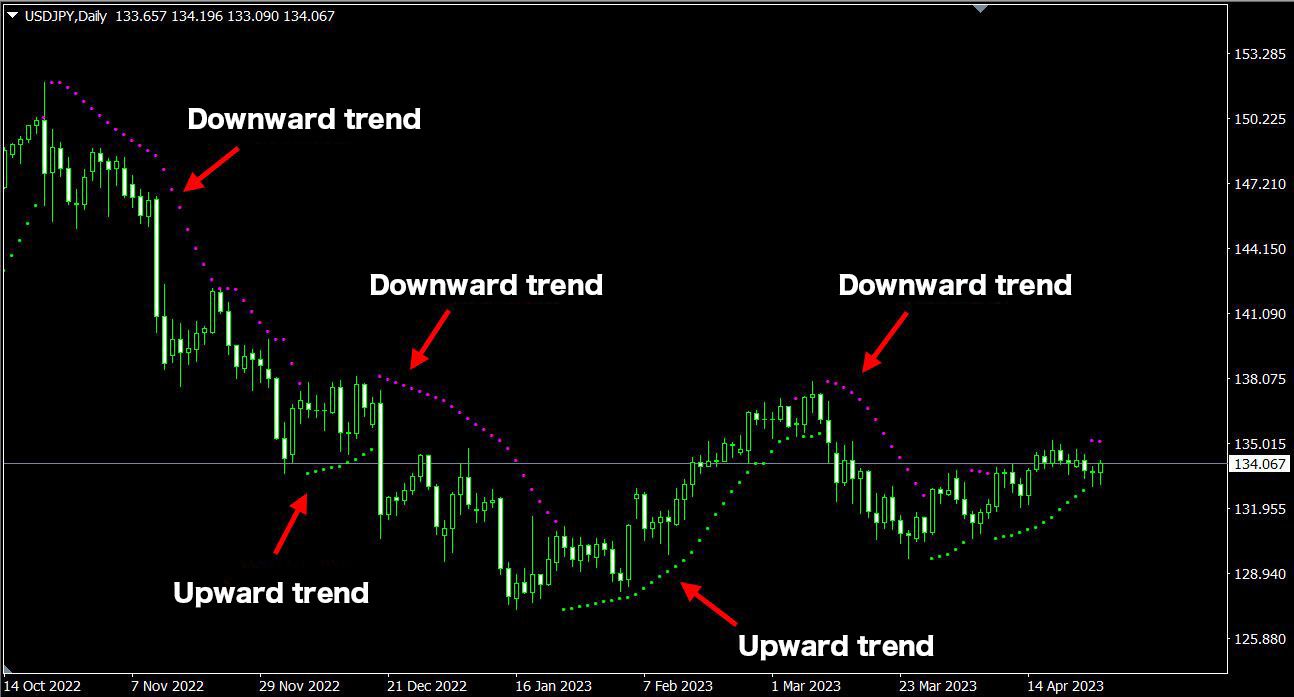
During an uptrend, the SAR is plotted below the price, and during a downtrend, it is plotted above the price. When the price reaches these points, it is considered a trend reversal, and the position of the SAR switches.
The SAR starts from the previous high or low before a trend reversal and gradually moves closer to the price. The position of the SAR alone can indicate the direction of the trend and also provide levels for potential trend reversals, making it a valuable tool for setting stop-loss levels and finding entry points for counter-trend trades.
However, caution is needed as it tends to produce more false signals when the price lacks a clear direction.
【Trends Indicated by the Parabolic SAR】
※ This indicator is only compatible with TitanFX's Windows version of MT5 and MT4.
Indicator Terms of Use
Only those who agree to all the following items may use the indicators distributed on this website (https://research.titanfx.com):
1.The indicators and related descriptions are based on various data believed to be reliable, but their accuracy and completeness are not guaranteed.
2.The data displayed by the indicators do not guarantee your investment results. Also, the displayed content may vary due to market conditions and communication environments.
3.Please make investment decisions using indicators at your own risk. We are not responsible for any disadvantages or damages arising from the use of indicators.
4.Specifications of the indicators are subject to change without notice. Changes will be announced on the indicator description pages, etc.
5.Indicators should only be used by customers who have downloaded them. Transferring or selling the indicators to third parties is prohibited.
Indicator Settings
Input Settings (For MT5), Parameter Input (For MT4)
| Variable Name | Description | Default |
|---|---|---|
| Timeframe | Specifies which timeframe's Parabolic SAR to display. Select 'current' to display the Parabolic SAR of the chart's timeframe. | current |
| Step (AF) | Specifies the AF value for calculating the Parabolic SAR. | 0.02 |
| Maximum (EP) | Specifies the EP value for calculating the Parabolic SAR. | 0.2 |
| Applied price | Specifies the price to be used. | Close price |
Color Settings (For MT5), Color Configuration (For MT4)
| MT5 | MT4 | Description |
|---|---|---|
| 0 | 0 | Color and size of the Parabolic during an uptrend |
| 0 | 0 | Color and size of the Parabolic during a downtrend |