Multi-Timeframe RSI (Titan_Multi_RSI)
Indicator Overview
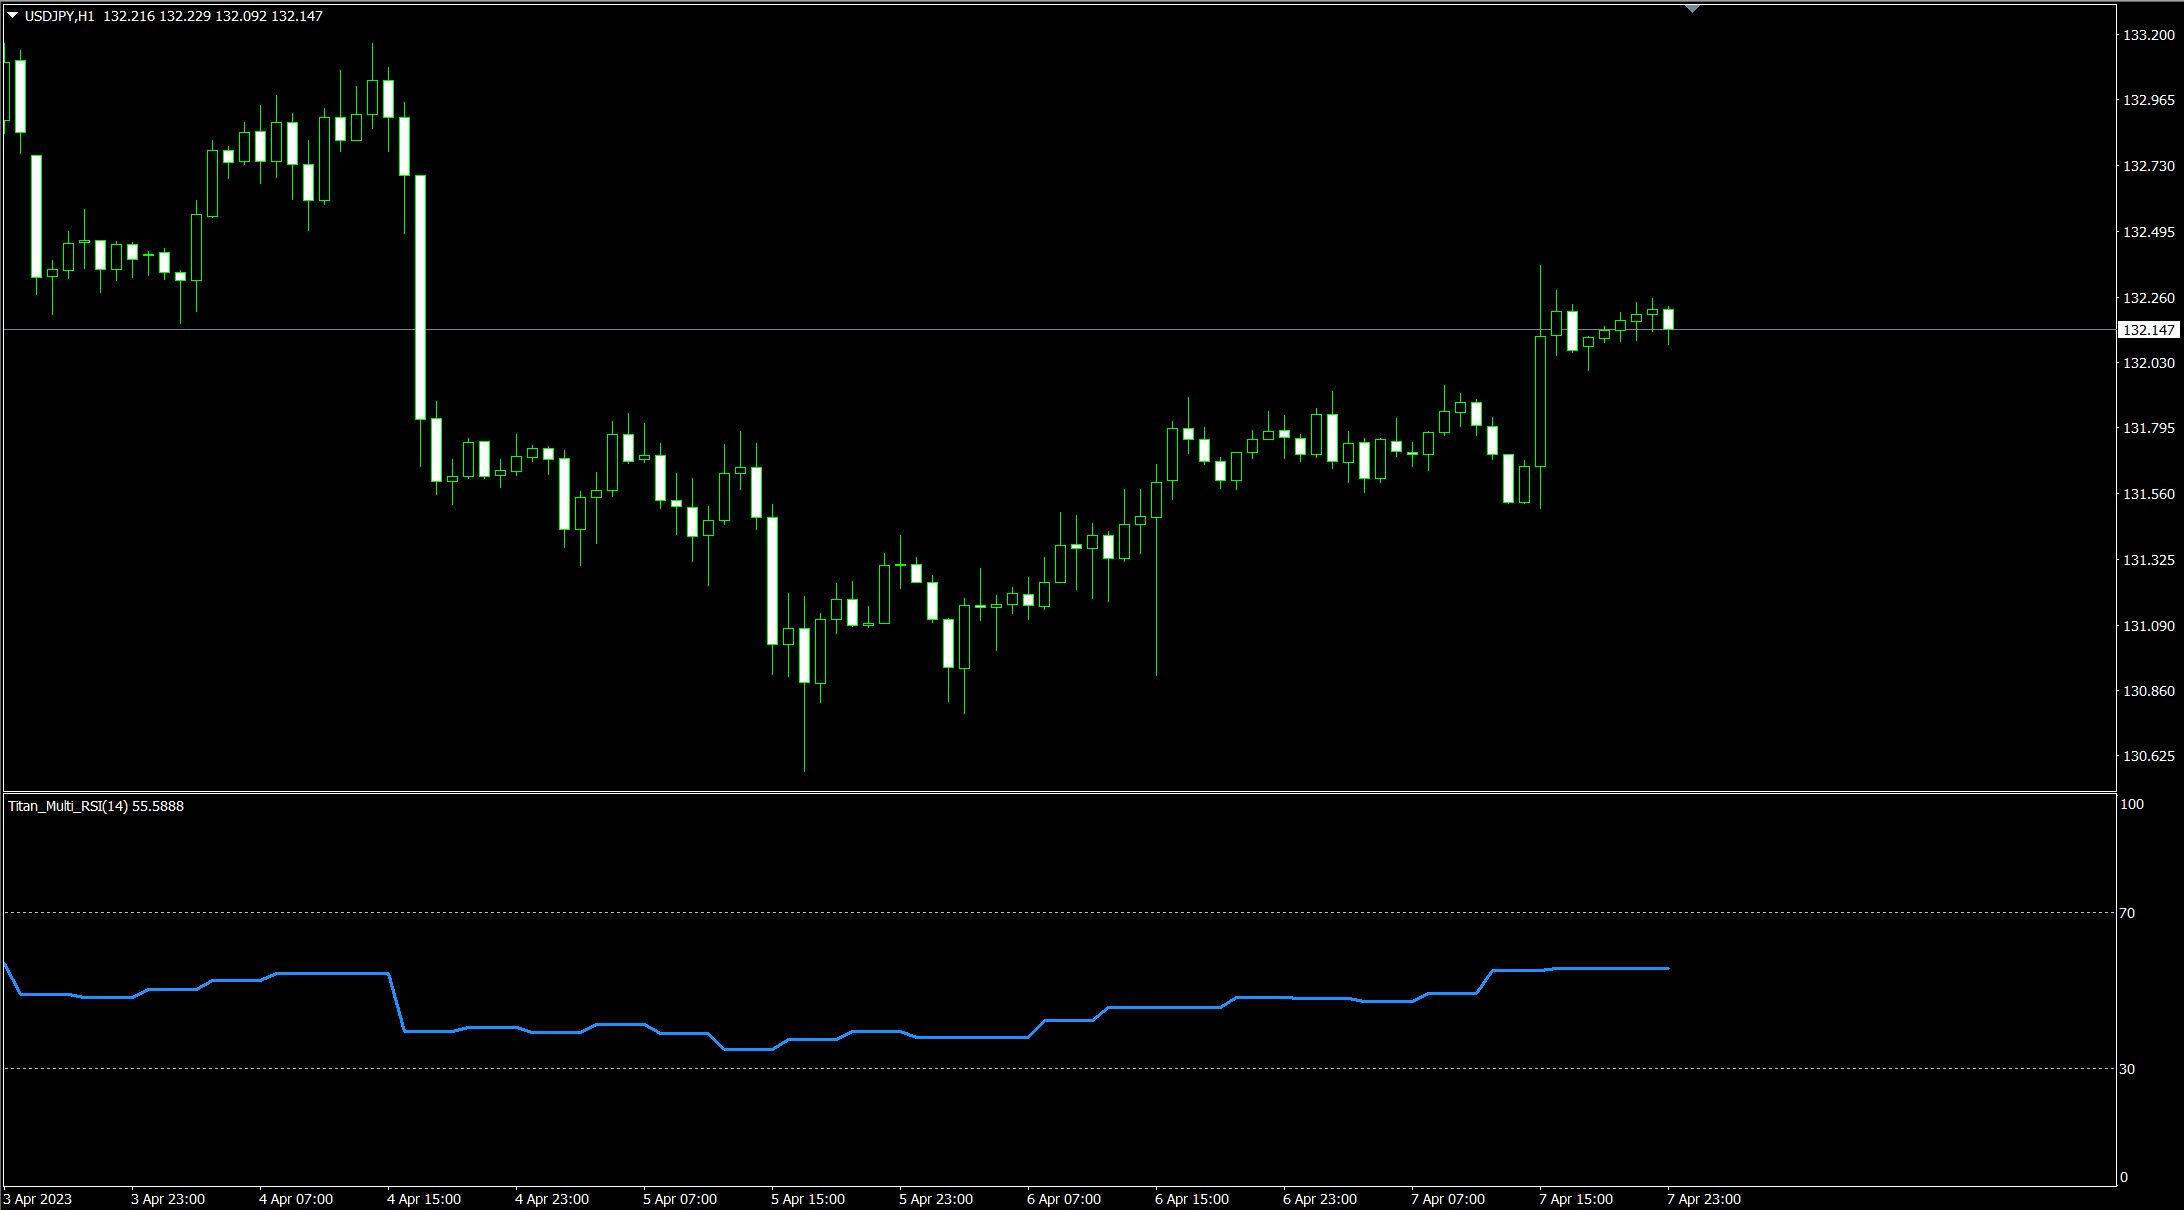
Displaying Multi-Timeframe RSI
The Multi-Timeframe RSI indicator allows for the display of RSI not only for the chart's timeframe but also from longer timeframes. This capability enhances the analysis of market conditions such as overbought and oversold states in longer timeframes and allows for the identification of divergences—when the direction of the price and RSI diverge—which are early signs of potential trend reversals.
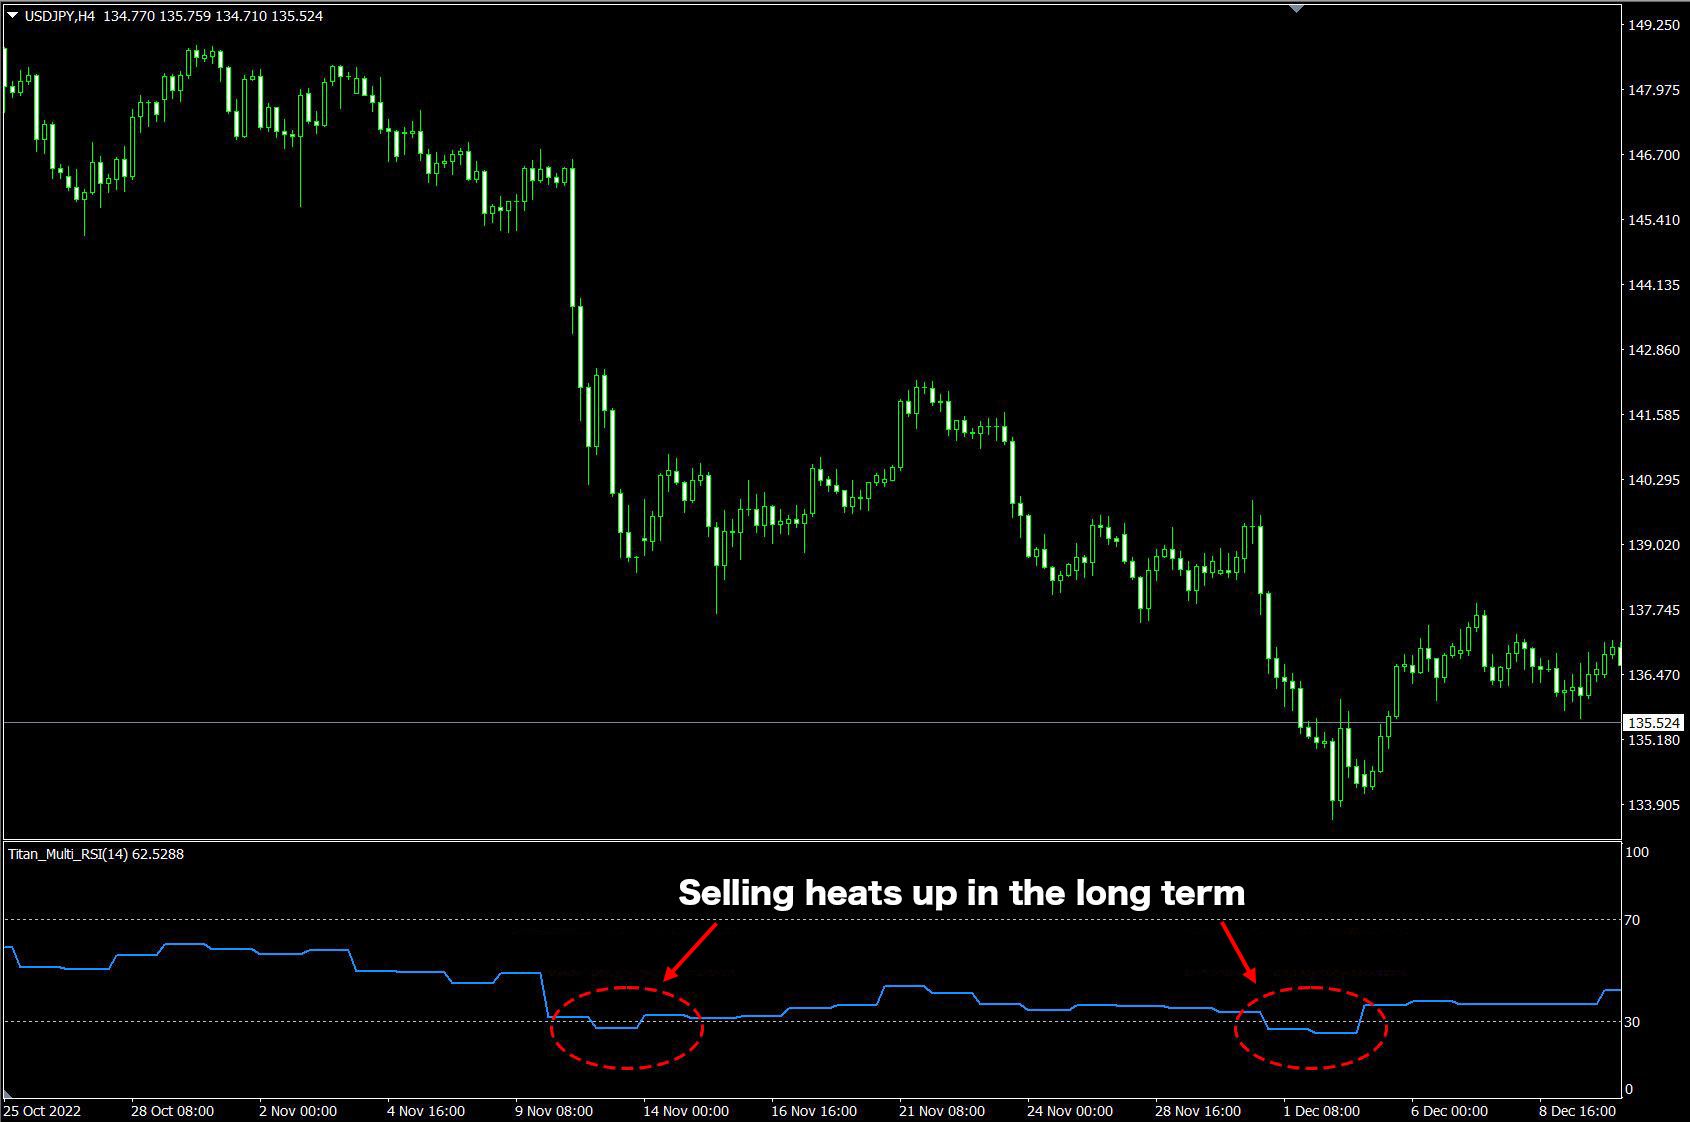
【Example of Analyzing Market Overheating by Displaying Daily RSI on a 4-hour Chart】
What is RSI?
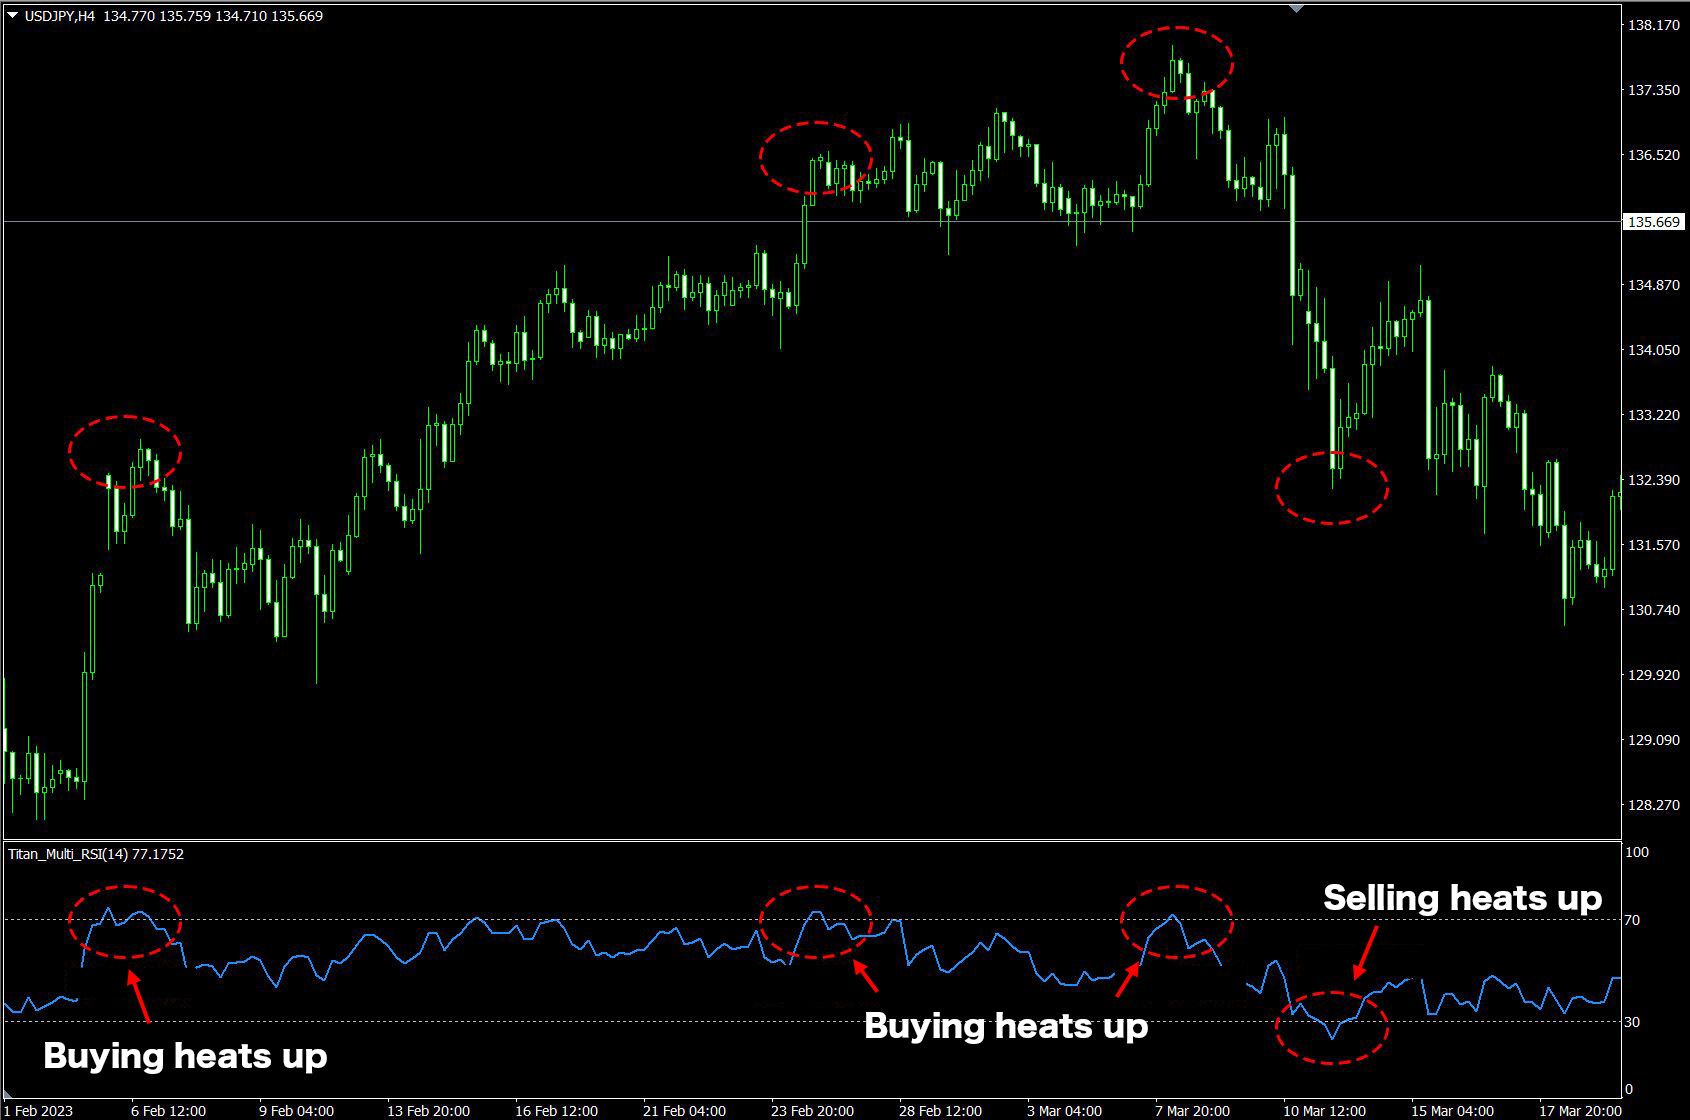
RSI stands for Relative Strength Index. It is an indicator that measures the extent of recent price changes to evaluate overbought or oversold conditions in the price of a stock or other asset. Typically, an RSI above 70 suggests that a security is becoming overbought or overvalued and may be primed for a trend reversal or corrective pullback in price. Conversely, an RSI reading below 30 indicates an oversold or undervalued condition.
When the RSI exceeds 70, indicating an overbought condition, one might consider closing existing long positions or holding off on taking new ones. A sell could be considered if the RSI falls back below 70. Similarly, if the RSI drops below 30, suggesting an oversold condition, one might consider closing short positions or holding off on new ones, and buying if the RSI moves back above 30.
However, it's important to note that during strong trends, the RSI can remain overbought or oversold for extended periods, so reliance on this indicator alone can lead to false signals.
【Example of Analysis Using RSI】
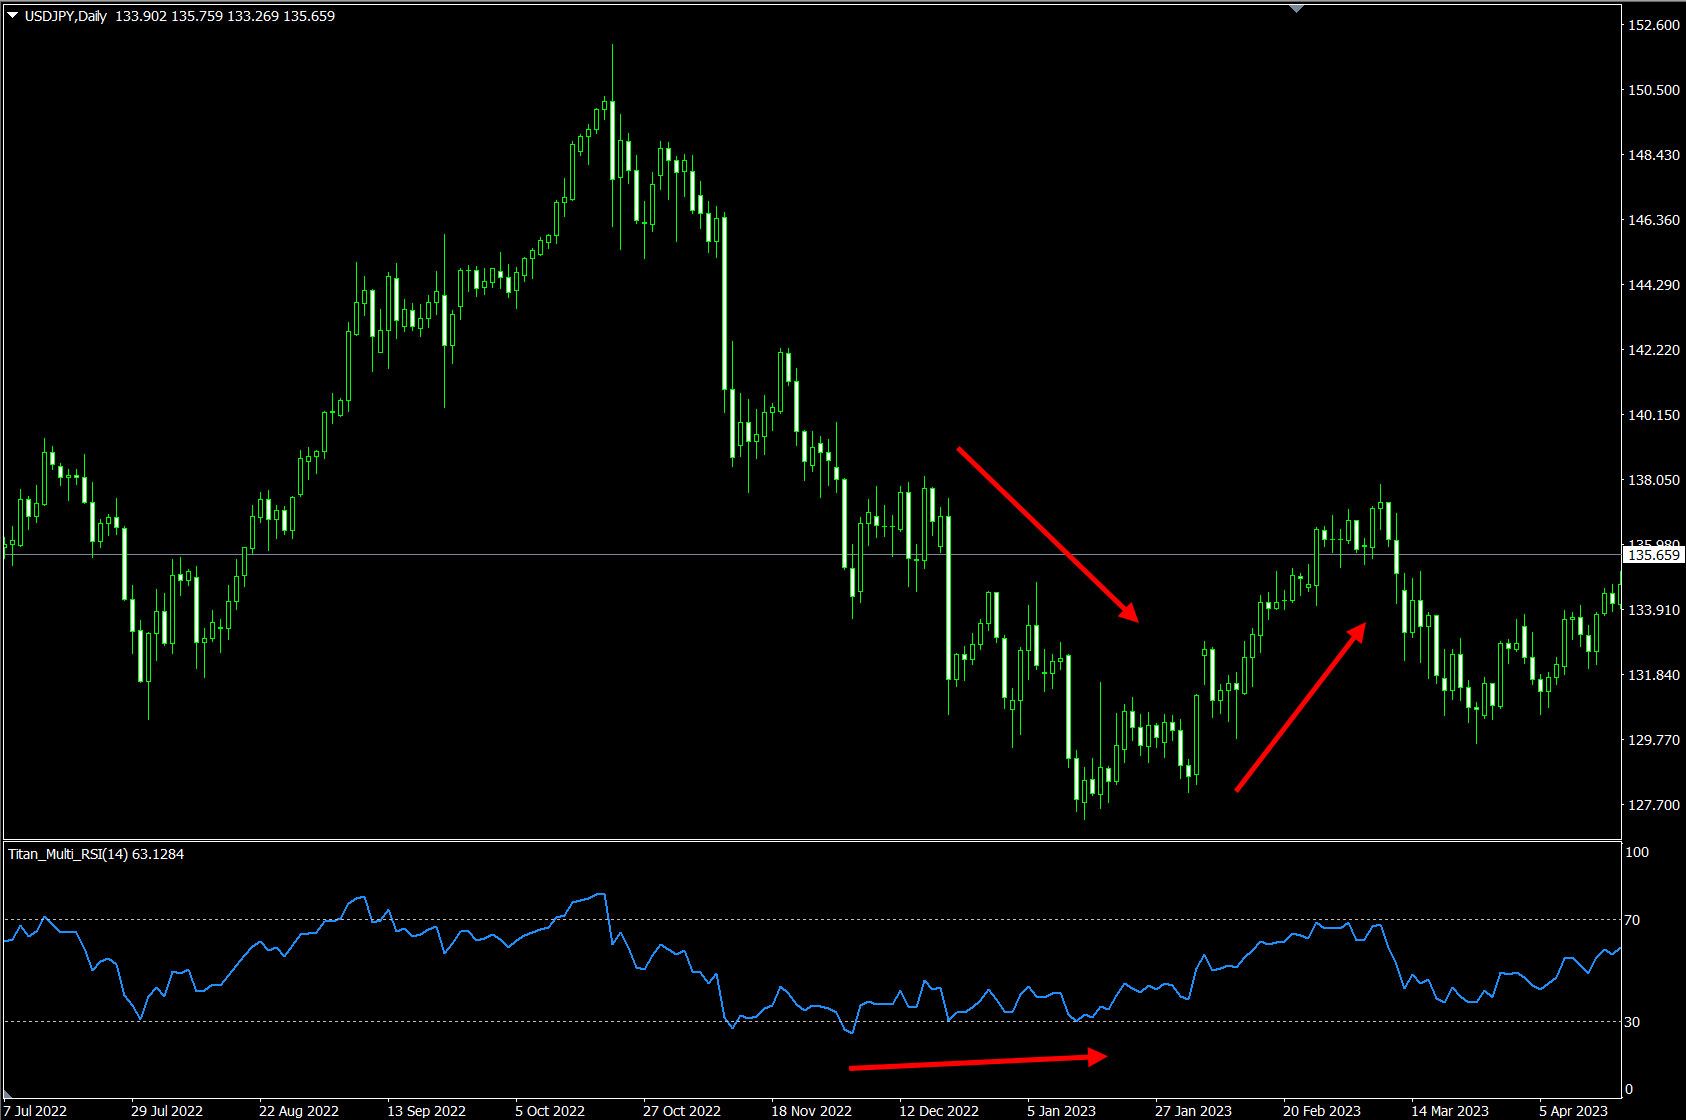
Signs of a Trend Reversal? Pay Attention to Divergence
One key aspect to monitor with RSI is the occurrence of divergences. Divergence, in technical analysis, refers to the contradiction between the price and an indicator.
For example, if the price is rising but the RSI is trending downwards, it suggests that the upward momentum is weakening and the price might peak soon.
Conversely, if the price is falling but the RSI is rising, it indicates that the downward momentum is weakening, and a bottom could be forming.
【Example of Divergence】
※ This indicator is only compatible with TitanFX's Windows version of MT5 and MT4.
Indicator Terms of Use
Only those who agree to all the following items may use the indicators distributed on this website (https://research.titanfx.com):
1.The indicators and related descriptions are based on various data believed to be reliable, but their accuracy and completeness are not guaranteed.
2.The data displayed by the indicators do not guarantee your investment results. Also, the displayed content may vary due to market conditions and communication environments.
3.Please make investment decisions using indicators at your own risk. We are not responsible for any disadvantages or damages arising from the use of indicators.
4.Specifications of the indicators are subject to change without notice. Changes will be announced on the indicator description pages, etc.
5.Indicators should only be used by customers who have downloaded them. Transferring or selling the indicators to third parties is prohibited.
Indicator Settings
Input Settings (For MT5), Parameter Input (For MT4)
| Variable Name | Description | Default |
|---|---|---|
| Timeframe | Specifies which timeframe's RSI to display. Select 'current' to display the RSI of the chart's timeframe. | current |
| Period | Specifies the period for calculating the RSI. | 14 |
| Applied price | Specifies the price to be used. | Close price |
Color Settings (For MT5), Color Configuration (For MT4)
| MT5 | MT4 | Description |
|---|---|---|
| 0(Titan_Multi_RSI) | 0 | Color, thickness, and style of the RSI line |