Multi-Timeframe Stochastics (Titan_Multi_Stochastic)
Indicator Overview
What is Multi-Timeframe Stochastics?
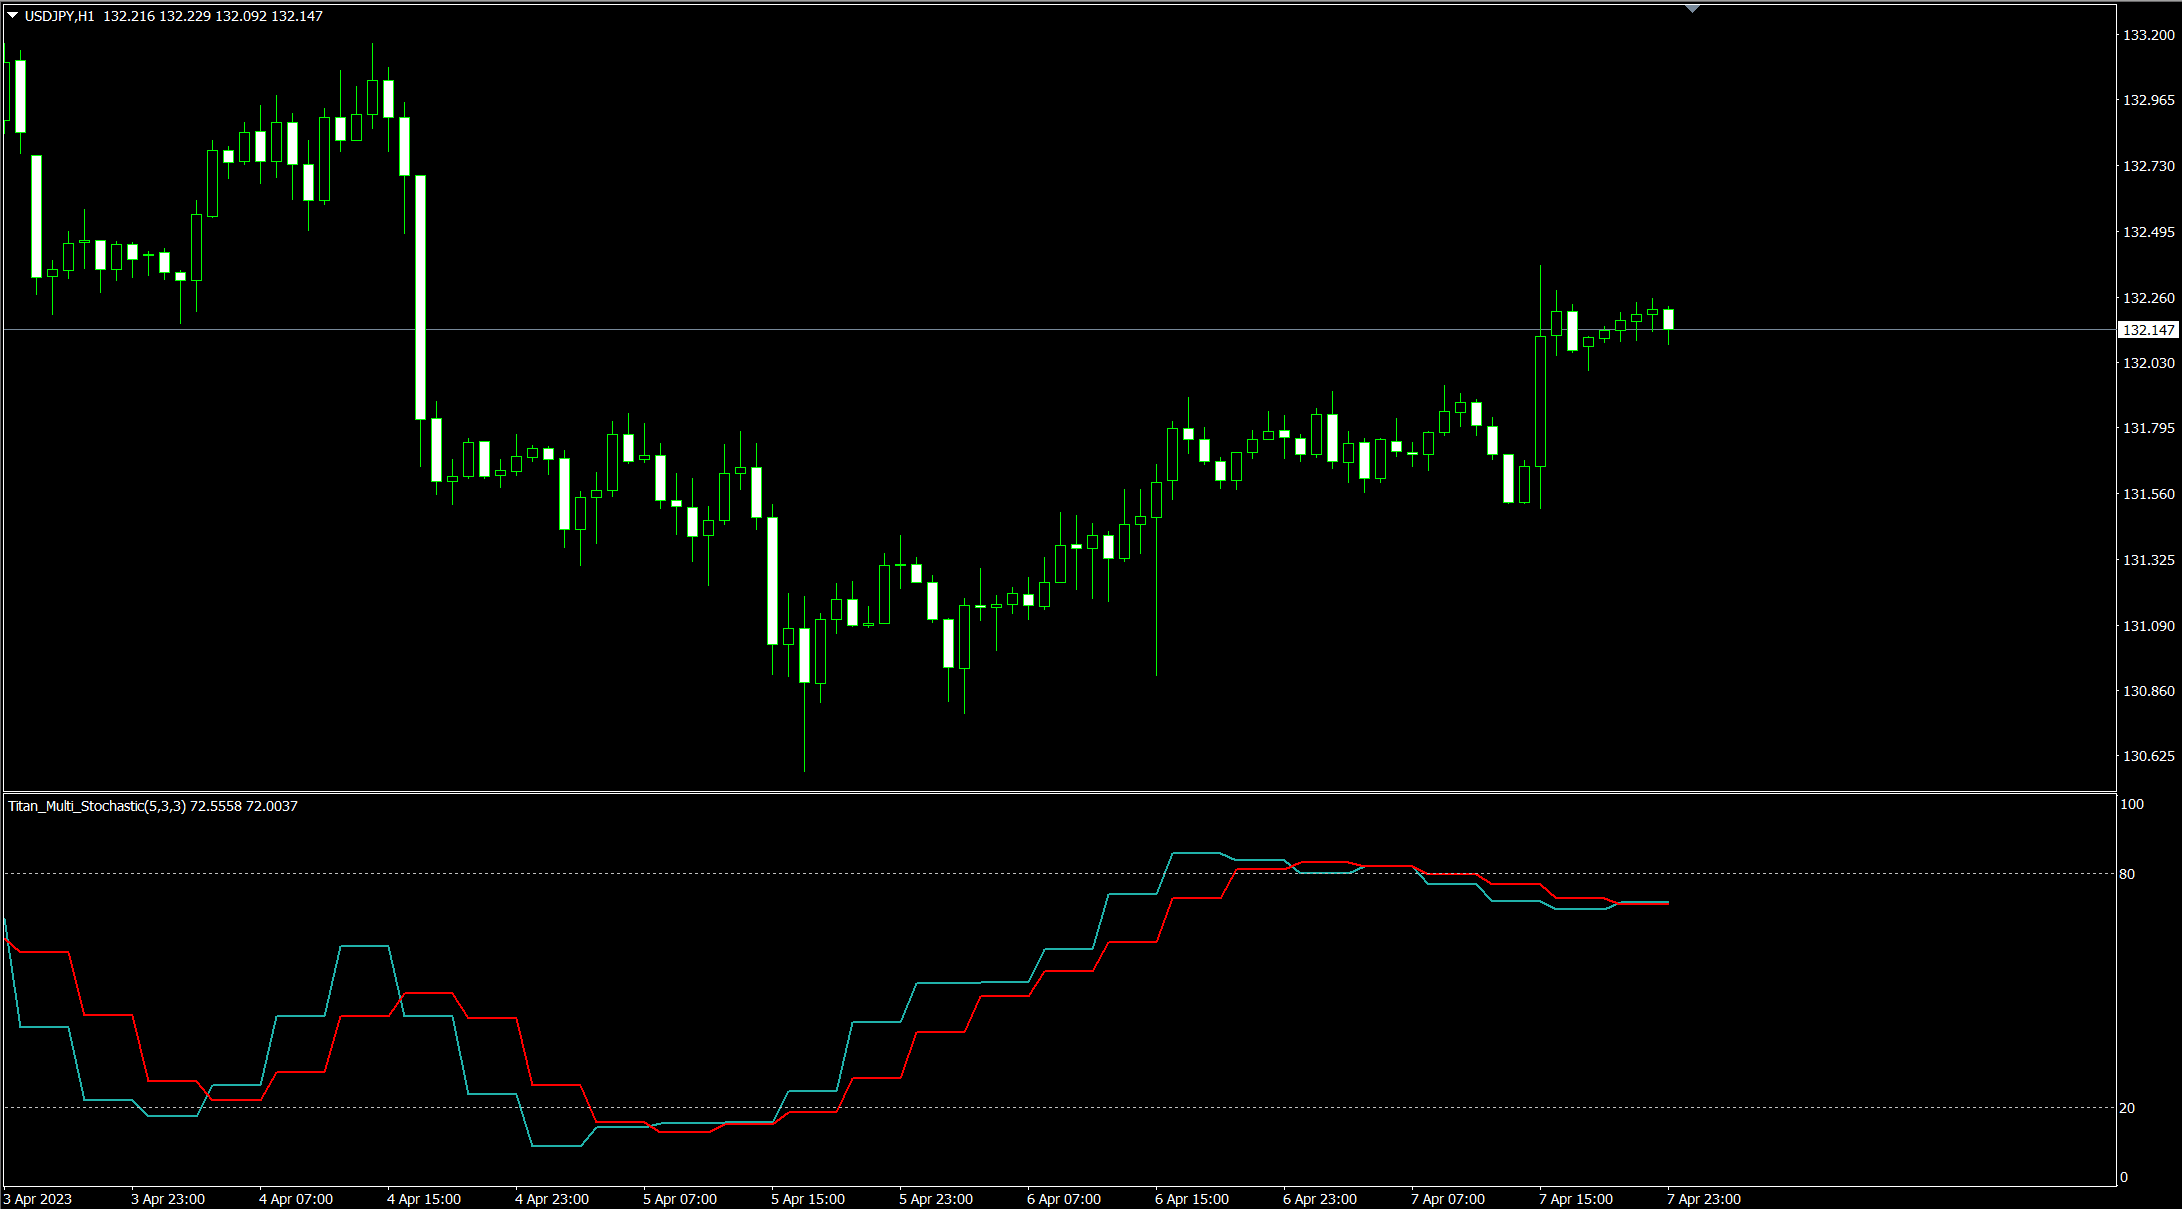
The Multi-Timeframe Stochastics indicator can display the stochastics for not only the chart's current timeframe but also for longer timeframes.
【Example of displaying 4-hour Stochastics on a 1-hour chart】
What is Stochastics?
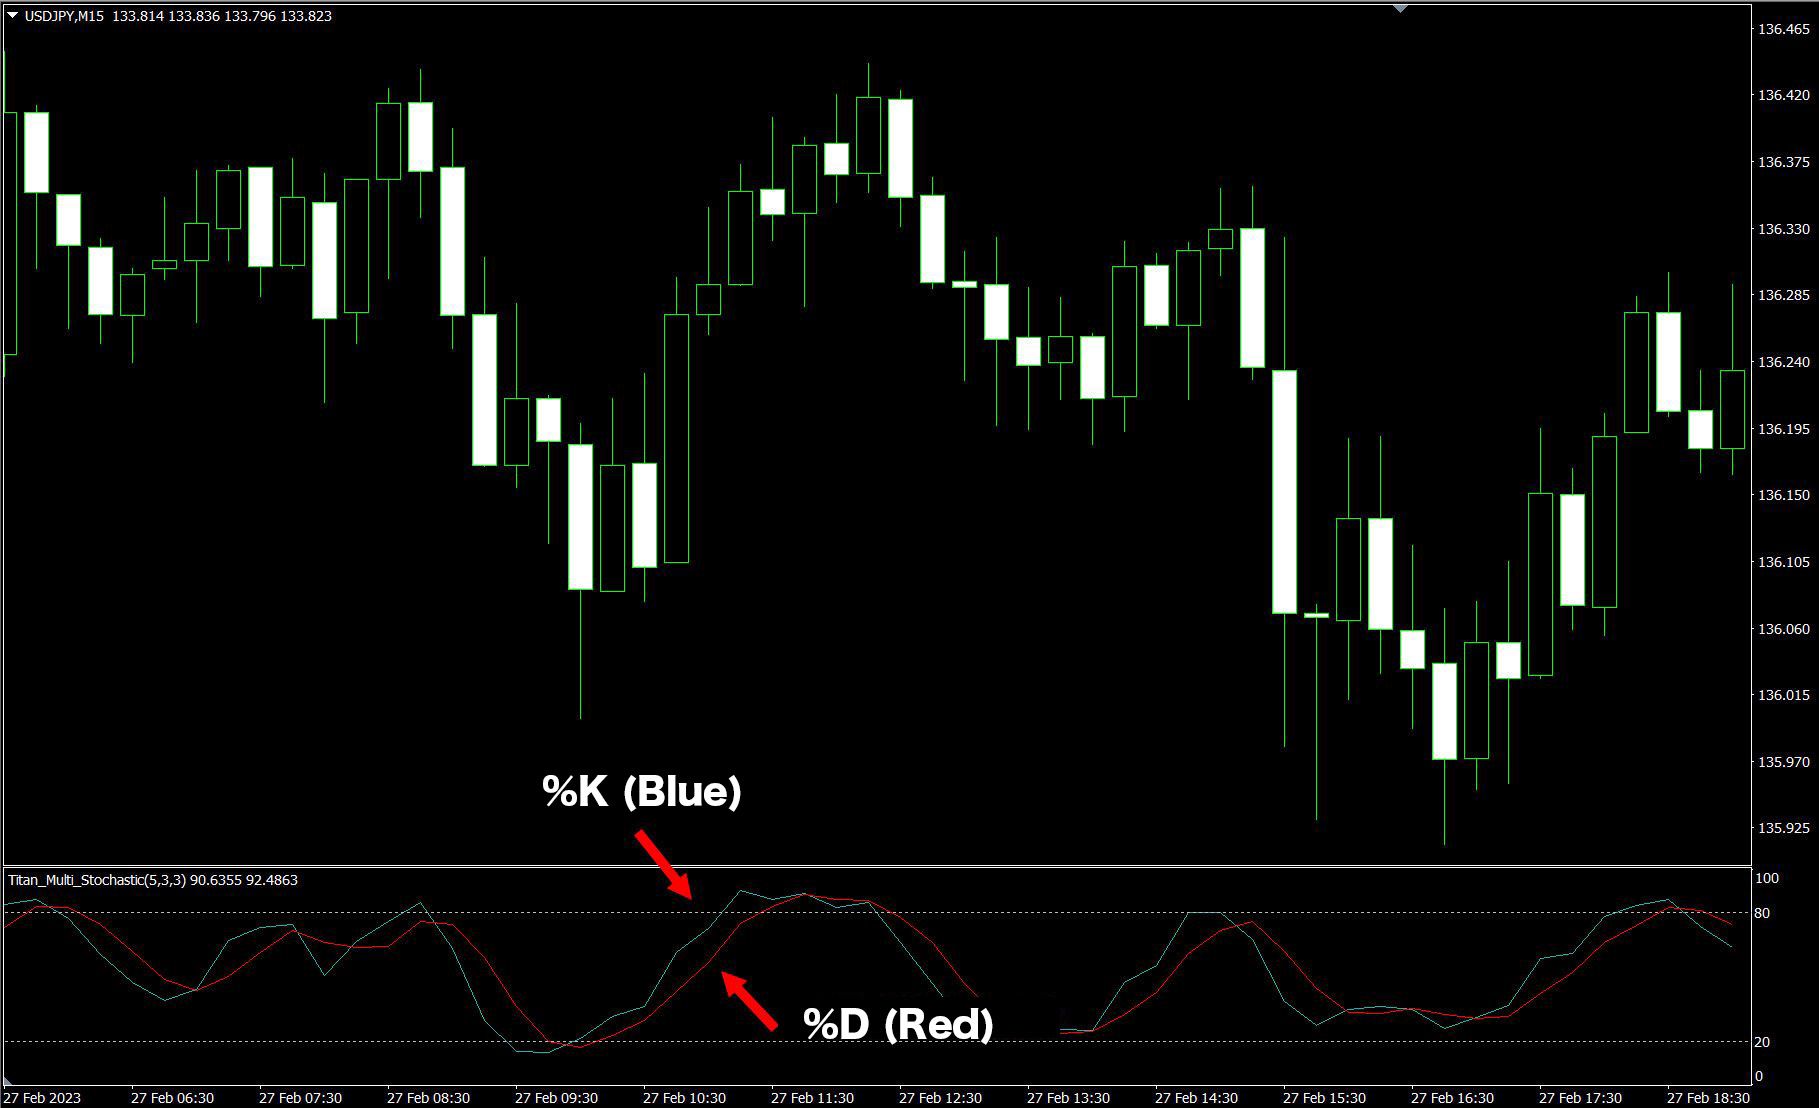
Stochastics is an oscillator-type indicator that shows the level at which prices are moving in relation to their past movements. It displays two lines within the subchart, %K and %D. %K indicates the current position level of the price, while %D is the moving average of %K.
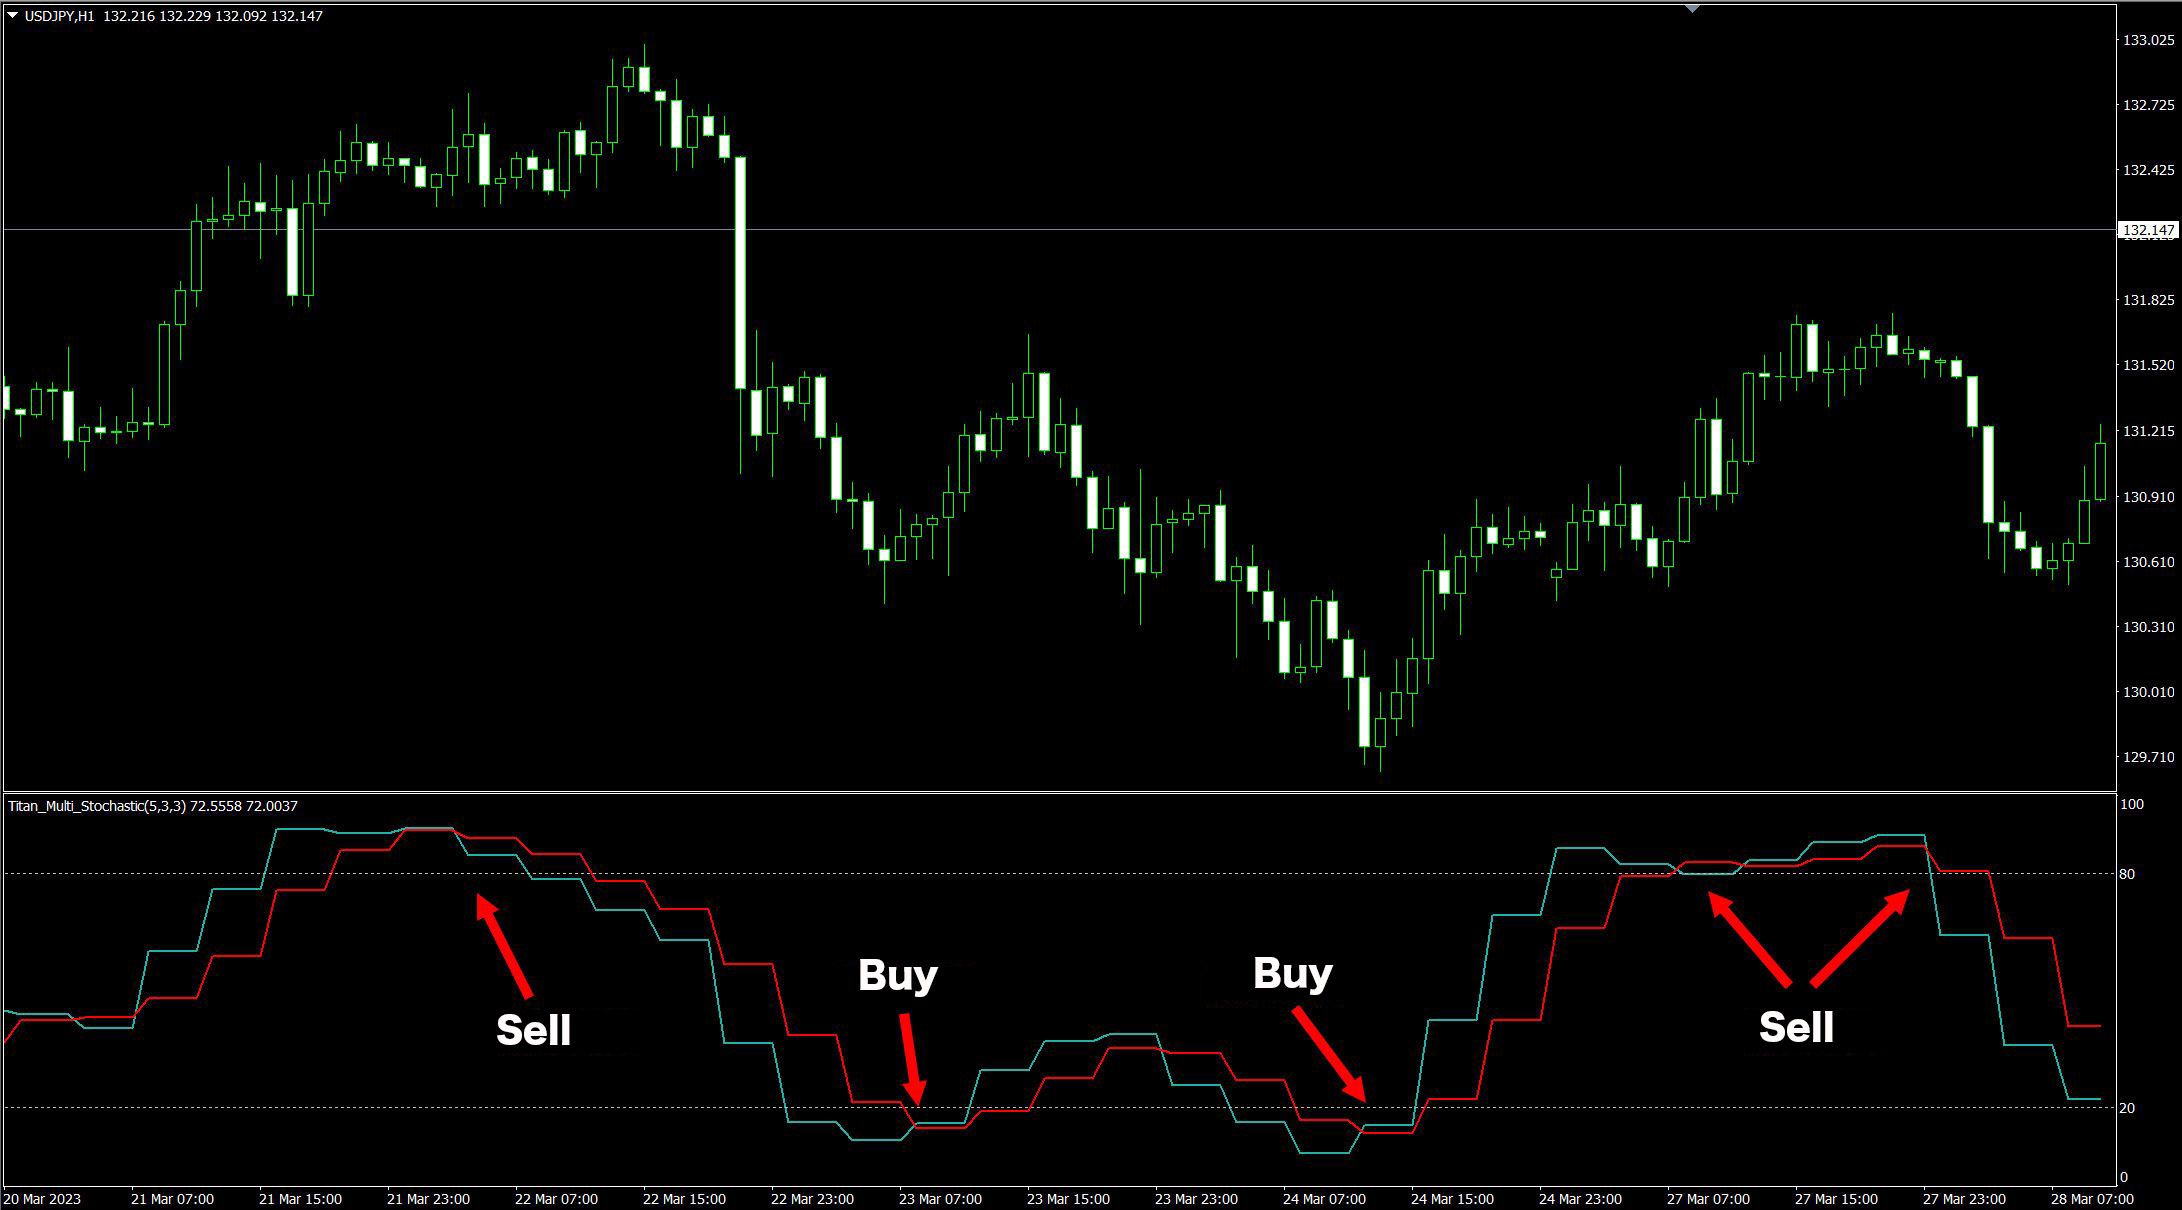
Generally, when %K exceeds 80, it is considered overbought, and if %K crosses below %D, it is a signal that the upward trend might have peaked, suggesting a sell signal. Conversely, when %K drops below 20, it is considered oversold, and if %K crosses above %D, it is a signal that the downward trend might have bottomed out, suggesting a buy signal.
Both Fast and Slow Stochastics Can Be Displayed
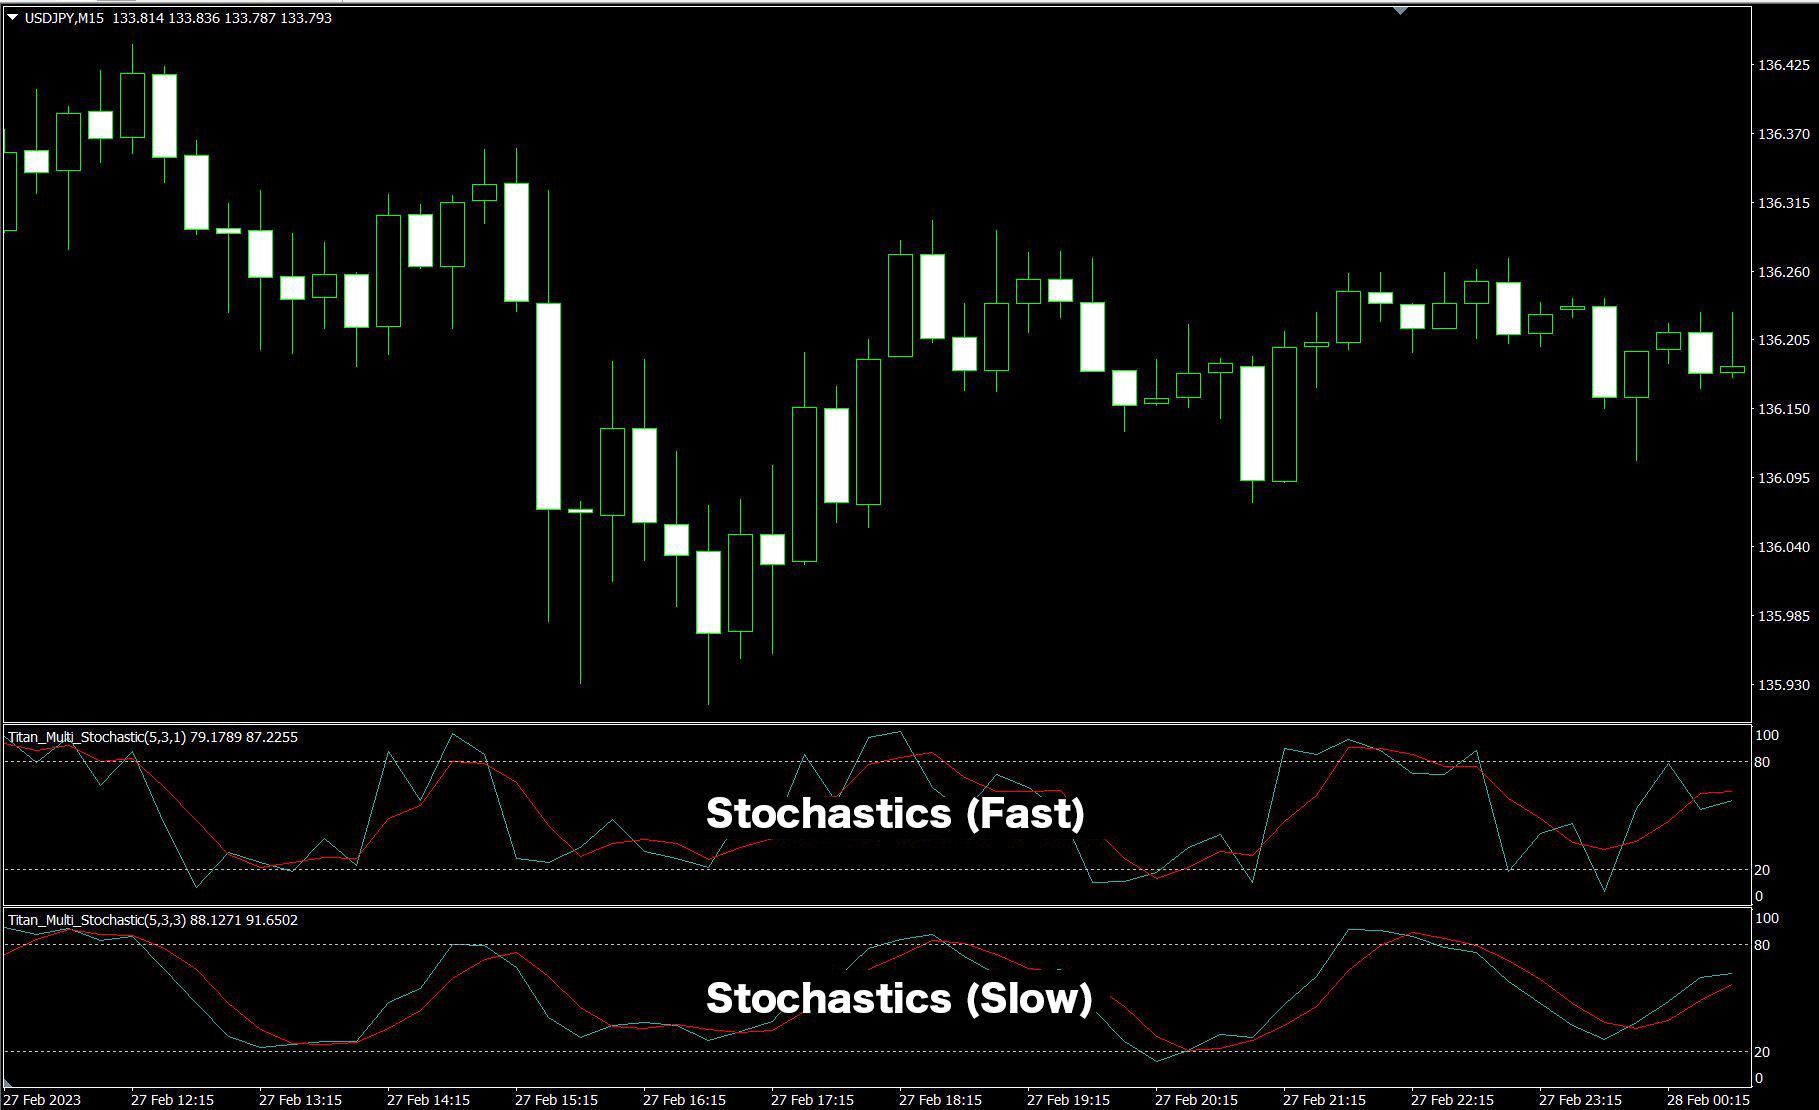
There are two types of stochastics: Fast Stochastics, which reflects the price movements directly in the %K value, and Slow Stochastics, where the %K value is smoothed using a moving average, making the movements less sensitive and thus reducing false signals.
While Fast Stochastics reacts sensitively to price movements, capturing early movements but often generating false signals, Slow Stochastics, although slower to react, provides the benefit of reducing these false signals.
Most users prefer using Slow Stochastics, but this indicator allows you to choose according to your preference. Setting the smoothing to 1 yields Fast Stochastics, and setting it to 3 yields typical Slow Stochastics.
※ This indicator is only compatible with TitanFX's Windows version of MT5 and MT4.
Indicator Terms of Use
Only those who agree to all the following items may use the indicators distributed on this website (https://research.titanfx.com):
1.The indicators and related descriptions are based on various data believed to be reliable, but their accuracy and completeness are not guaranteed.
2.The data displayed by the indicators do not guarantee your investment results. Also, the displayed content may vary due to market conditions and communication environments.
3.Please make investment decisions using indicators at your own risk. We are not responsible for any disadvantages or damages arising from the use of indicators.
4.Specifications of the indicators are subject to change without notice. Changes will be announced on the indicator description pages, etc.
5.Indicators should only be used by customers who have downloaded them. Transferring or selling the indicators to third parties is prohibited.
Indicator Settings
Input (For MT5), Parameter Input (For MT4)
| Variable Name | Description | Default |
|---|---|---|
| Timeframe | Specifies which timeframe's stochastics to display. Select 'current' for the chart's timeframe. | current |
| %K Period | Specifies the period for calculating %K. | 5 |
| %D Period | Specifies the period for calculating %D. | 3 |
| Slowing | Specifies the smoothing period for %K. 3 is typical for Slow Stochastics, 1 for Fast Stochastics. | 3 |
| MA method | Specifies the type of moving average used for calculating stochastics. Choices include Simple (SMA), Exponential (EMA), Smoothed (SMMA), Linear Weighted (LWMA). | Simple |
| Price field | Specifies the price to be used. | Low/High |
Color Settings (For MT5), Color Configuration (For MT4)
| MT5 | MT4 | Description |
|---|---|---|
| Main | 0 | Color, thickness, and style of the %K line of Stochastics |
| Signal | 1 | Color, thickness, and style of the %D line of Stochastics |