

See What Happened Next in Similar Markets(Titan_Pattern_Echo)
Indicator Overview
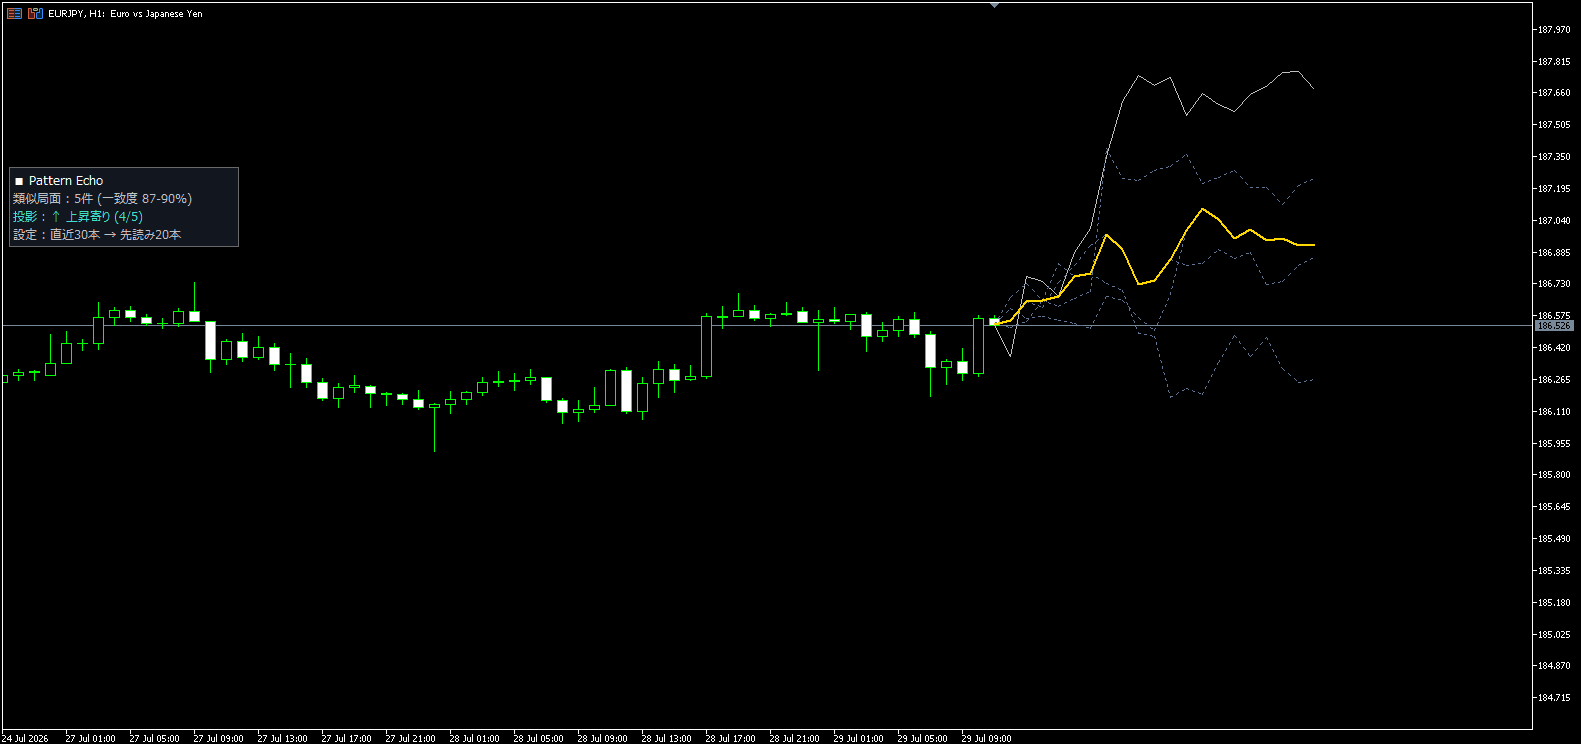
Titan Pattern Echo is a tool that automatically searches historical charts for market conditions closely resembling the “shape” of the most recent price movement and projects what actually happened afterward beyond the current price as ghost lines.
As the market adage “history repeats itself” suggests, technical analysis is based on the idea that similar patterns are often followed by similar developments. However, manually searching historical charts for market conditions resembling the current one is not practical. This indicator statistically compares the latest price movement with several thousand historical bars, identifies only the market conditions with a high degree of similarity, and shows what happened next.
The following three types of lines are displayed.
- Solid silver line = What happened after the most similar market condition
- Blue-gray dotted lines = What happened after the other similar market conditions (up to 7 lines)
- Thick gold line = Consensus Line: The median of all similar market conditions. “The direction taken by the majority of similar markets”
In addition, the indicator displays where the similar market conditions occurred on the historical chart using boxes and similarity labels (for example, #1 92%), allowing you to verify each market condition yourself.
Basic Mechanism
The indicator extracts the most recent price movement (30 bars by default) as a “pattern” and overlays it on every possible location in the historical data to score how closely the shapes match (using the statistical correlation coefficient). Only market conditions with a similarity score at or above the threshold (80% by default) are selected. The subsequent price movements are then drawn from the current price as the starting point after being converted into percentage changes, allowing historical market conditions with different price levels to be compared directly.
Display Information
- The panel in the upper-left corner summarizes the number of similar market conditions, the similarity range, and the projected direction (bullish / bearish / neutral).
- When no similar market conditions are found, the indicator clearly displays “Similar Patterns: None.” It does not force lines to be drawn.
- When applied, the indicator automatically creates space (a chart shift) on the right side of the chart so that projections into the future can be viewed.
- Because calculations are performed after a swing has been confirmed, the indicator searches again using the latest pattern each time a new bar is completed.
This indicator is a supplementary tool that visualizes “the paths actually taken by similar markets in the past.” The ghost lines are not predictions of the future; they are reference information showing that “there are historical examples in which the market moved this way after a similar pattern” (they do not guarantee future price movements).
How to Interpret This Indicator
- The gold Consensus Line is the most important. It shows the direction taken by the majority of similar market conditions.
- Projection: ↑ Bullish (4/5) in the panel means that “4 out of 5 similar market conditions rose afterward.” The stronger the bias, the more useful the information may be as a reference.
- When the ghost lines are clustered in the same direction, the historical examples were highly consistent. When they spread out in different directions, it means that “even after similar patterns, the outcomes varied.”
- By scrolling back to the boxes on the historical chart (such as #1 92%), you can review the actual market conditions that were identified as similar.
- Increasing the similarity threshold results in stricter filtering, while lowering it displays a larger number of similar market conditions.
※This indicator works only with the Windows versions of MT5 and MT4 provided by Titan FX.
Indicator Terms of Use
Only those who agree to all the following items may use the indicators distributed on this website (https://research.titanfx.com):
1.The indicators and related descriptions are based on various data believed to be reliable, but their accuracy and completeness are not guaranteed.
2.The data displayed by the indicators do not guarantee your investment results. Also, the displayed content may vary due to market conditions and communication environments.
3.Please make investment decisions using indicators at your own risk. We are not responsible for any disadvantages or damages arising from the use of indicators.
4.Specifications of the indicators are subject to change without notice. Changes will be announced on the indicator description pages, etc.
5.Indicators should only be used by customers who have downloaded them. Transferring or selling the indicators to third parties is prohibited.
Indicator Settings
Settings in the Inputs Tab (MT5) or Parameters Tab (MT4)
| Variable Name | Description | Default |
|---|---|---|
| Pattern length (bars) | Number of recent bars used as "the current shape" | 30 |
| Projection length (bars) | How many bars of each match's "sequel" to draw | 20 |
| Scan range (bars) | How far back in history to search | 3000 |
| Matches to show (1–8) | Number of matches adopted, best similarity first | 5 |
| Similarity threshold (%) | Periods below this similarity are not adopted | 80 |
| Highlight matched zones | Highlight the matched periods on the chart | true |
| Show info panel | Show/hide the summary panel in the upper left | true |
| Ghost line color | Dotted lines showing the matches' sequels | Blue-gray |
| Best match color | Line color for the No. 1 match (solid) | Silver |
| Consensus (median) color | Bold line showing the majority path | Gold |
| Matched zone color | Highlight rectangles on the historical chart | Dark navy |
Settings in the Colors Tab (MT5) or Color Settings Tab (MT4)
This indicator does not use this tab.