Support and Resistance Indicator (Titan_Support_Resistance)
Indicator Overview
Displaying Short-Term, Medium-Term, and Long-Term Support and Resistance Levels
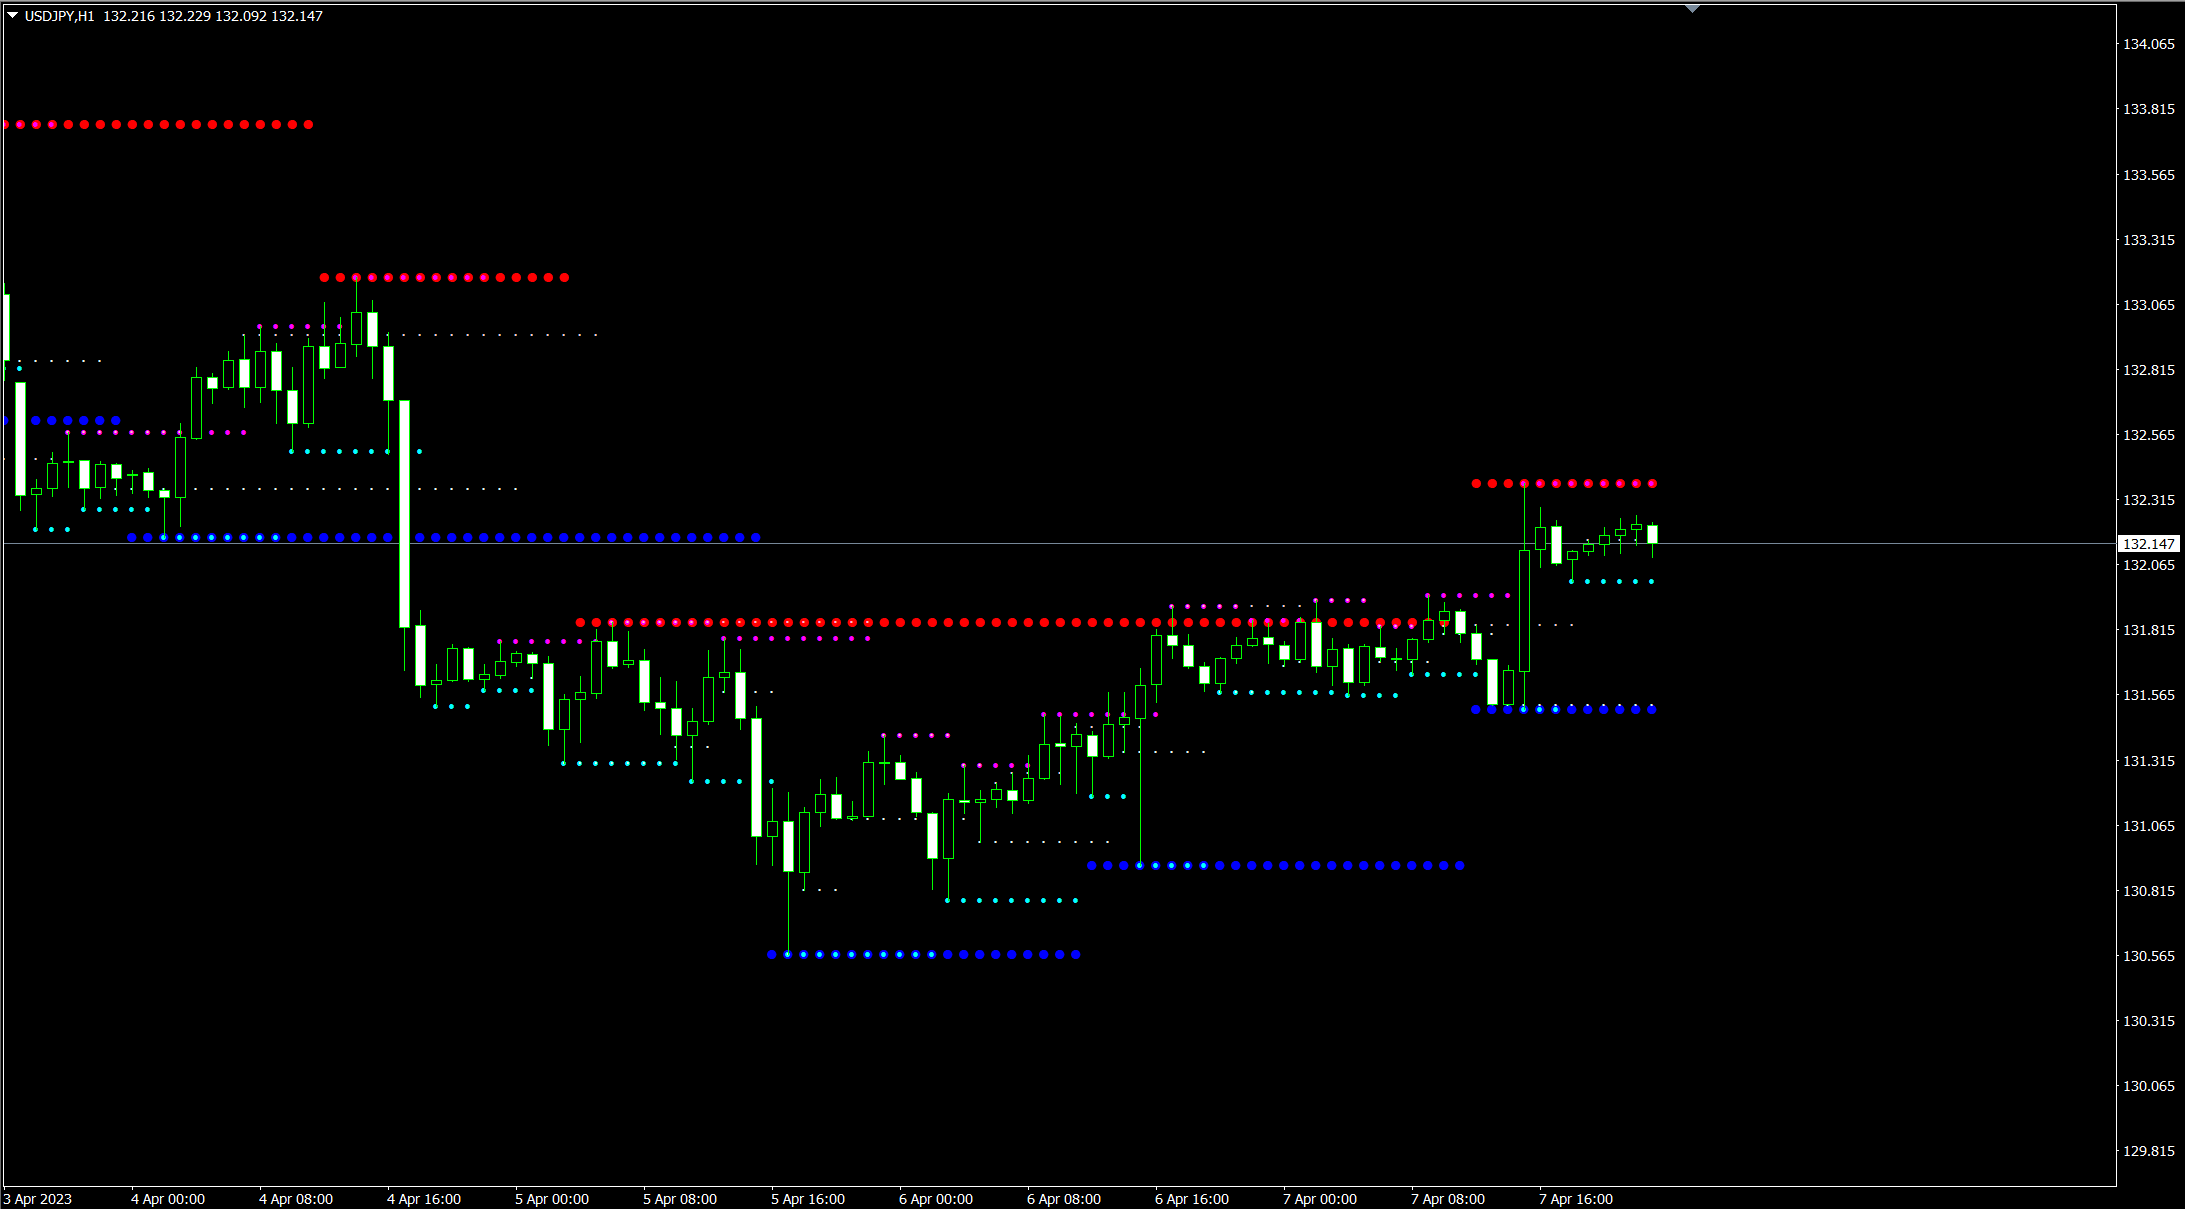
This indicator displays support and resistance levels for three different timeframes (short-term, medium-term, and long-term) calculated using fractals, shown as dots on the chart.
Levels that have served as support or resistance in multiple periods, or have historically been significant, are likely to be noteworthy in the future and may serve as critical points in the market.
【Example of Display on a 1-hour Chart】
Levels That Have Been Support or Resistance Tend to Be Watched
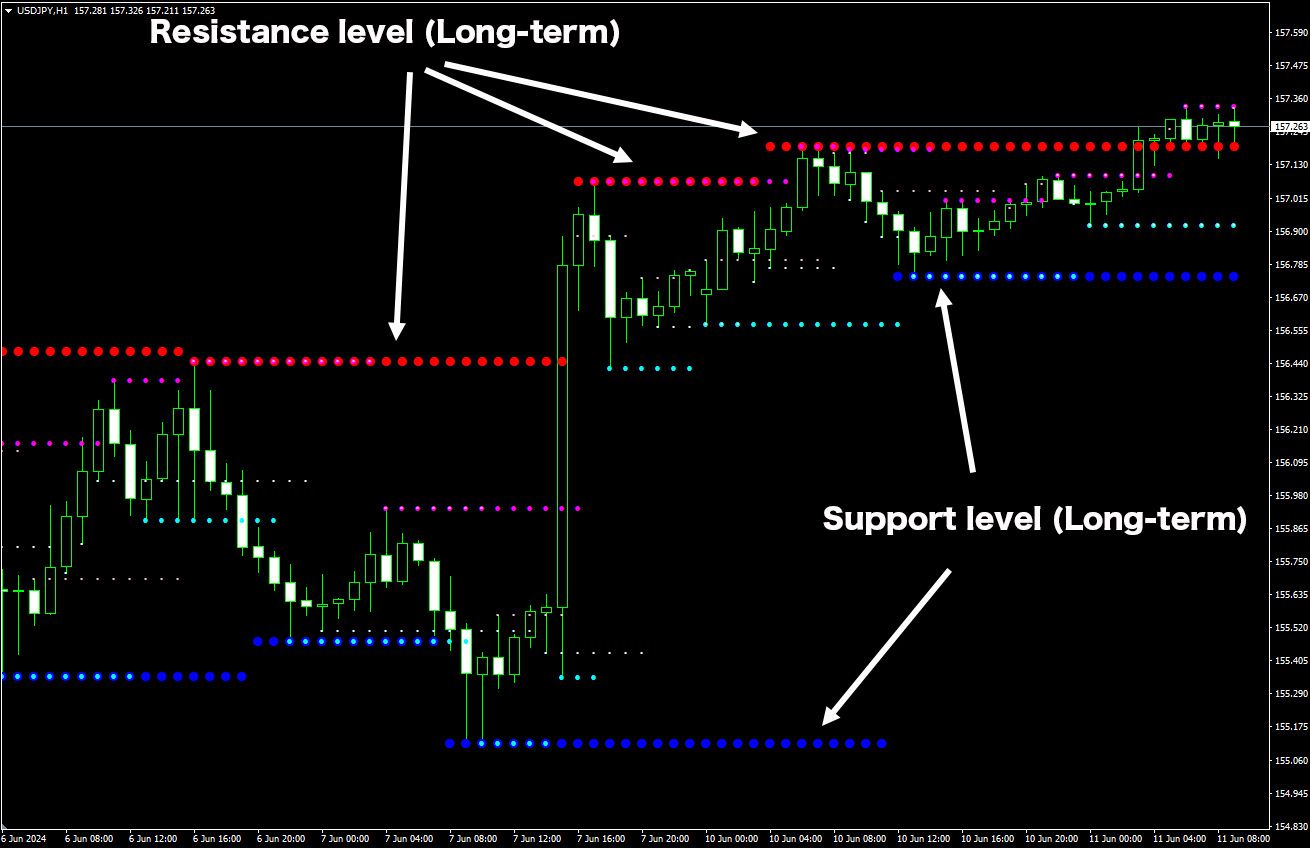
Levels that have previously acted as support or resistance are often closely watched in the markets, and it's not uncommon for these levels to serve as support or resistance again. These levels should be considered when targeting market reversals or setting stop-loss levels.
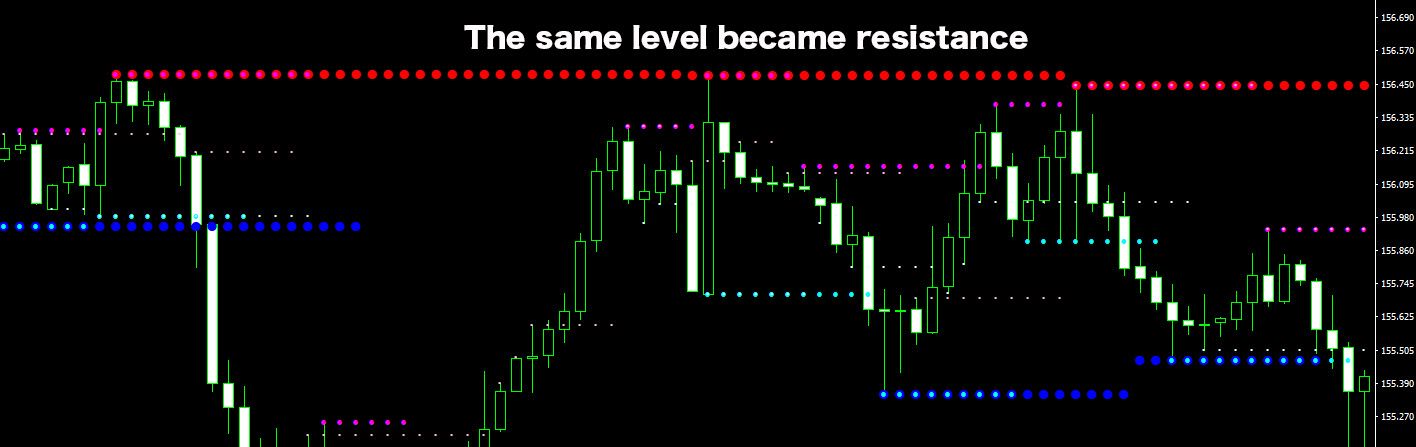
【Example Where the Same Level Acted as Resistance】
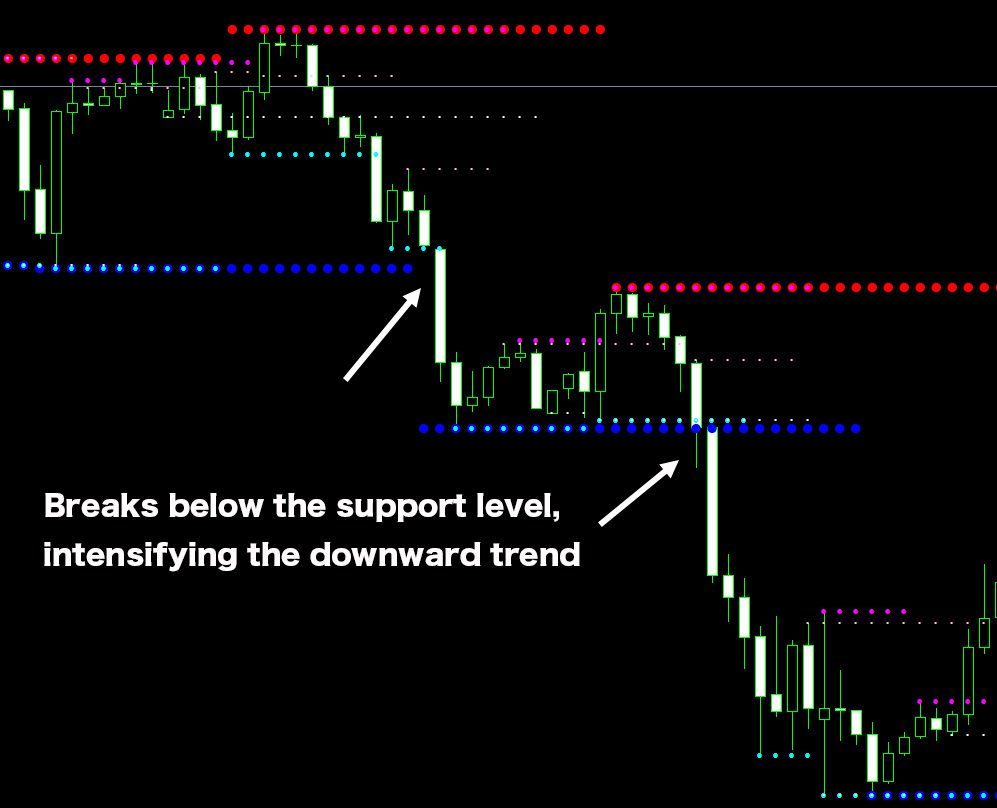
Breaking Long-Term Support or Resistance Can Indicate Directional Movement
As mentioned earlier, long-term support and resistance levels are significant in the market. Breaking through these levels can lead to clear directional movements.
【Example Where the Support Level was Broken, Leading to a Stronger Downtrend】
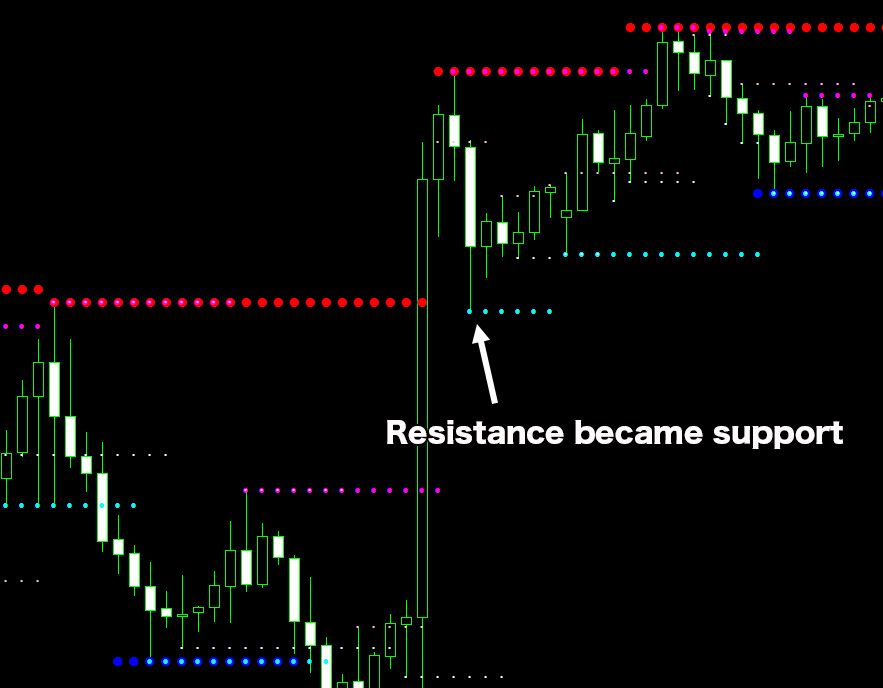
Former Support Becomes Resistance, and Vice Versa
Levels that have acted as support or resistance can switch roles once breached. A broken support may act as resistance, and broken resistance may become support, which are key levels to watch for buying dips or selling rallies.
【Example Where Former Support Turned into Resistance】
Timeframe Settings
By default, the indicator displays support and resistance levels for the following combinations of timeframes relative to the current chart:
For the 1-minute chart, short-term: 5 minutes, medium-term: 15 minutes, long-term: 30 minutes.
For the 5-minute chart, short-term: 1 minute, medium-term: 5 minutes, long-term: 30 minutes.
For the 15-minute chart, short-term: 5 minutes, medium-term: 15 minutes, long-term: 1 hour.
For the 30-minute chart, short-term: 5 minutes, medium-term: 30 minutes, long-term: 4 hours.
For the 1-hour chart, short-term: 15 minutes, medium-term: 1 hour, long-term: 4 hours.
For the 4-hour chart, short-term: 1 hour, medium-term: 4 hours, long-term: Daily.
For the Daily chart, short-term: 4 hours, medium-term: Daily, long-term: Weekly.
For the Weekly chart, short-term: Daily, medium-term: Weekly, long-term: Monthly.
You can also select your preferred combination of timeframes in the settings.
※ This indicator is only compatible with TitanFX's Windows version of MT5 and MT4.
Indicator Terms of Use
Only those who agree to all the following items may use the indicators distributed on this website (https://research.titanfx.com):
1.The indicators and related descriptions are based on various data believed to be reliable, but their accuracy and completeness are not guaranteed.
2.The data displayed by the indicators do not guarantee your investment results. Also, the displayed content may vary due to market conditions and communication environments.
3.Please make investment decisions using indicators at your own risk. We are not responsible for any disadvantages or damages arising from the use of indicators.
4.Specifications of the indicators are subject to change without notice. Changes will be announced on the indicator description pages, etc.
5.Indicators should only be used by customers who have downloaded them. Transferring or selling the indicators to third parties is prohibited.
Indicator Settings
Input (For MT5), Parameter Input (For MT4)
| Variable Name | Description | Default |
|---|---|---|
| Information | Whether to display current support and resistance values on the top left of the chart. | false |
| Use the initial time frame setting | Whether to use the default timeframe settings. M1 → M5,M15,M30 M5 →M1,M5,M30 M15 → M5,M15,H1 M30 → M5,M30,H4 H1 → M15,H1,H4 H4 → H1,H4,D1 D1 → H4,D1,W1 W1 → D1,W1,MN | true |
| Timeframe(long、medium、short) | Specifies the timeframes to use for the fractal data if not using the default combinations. | current |
| Display the overlapping area of the three periods | Whether to highlight areas where the short-term, medium-term, and long-term periods overlap. | false |
| Resistance color | Fill color for areas where resistance levels overlap. | Magenta |
| Support color | Fill color for areas where support levels overlap. | Aqua |
Color Settings (For MT5), Color Configuration (For MT4)
| MT5 | MT4 | Description |
|---|---|---|
| 0 | 0 | Color and thickness of the long-term resistance |
| 1 | 1 | Color and thickness of the long-term support |
| 2 | 2 | Color and thickness of the medium-term resistance |
| 3 | 3 | Color and thickness of the medium-term support |
| 4 | 4 | Color and thickness of the short-term resistance |
| 5 | 5 | Color and thickness of the short-term support |