

Trend Strength Indicator (Titan_TrendStrengthHeatmap)
Indicator Overview
An Indicator That Visualizes Trend Strength with Color
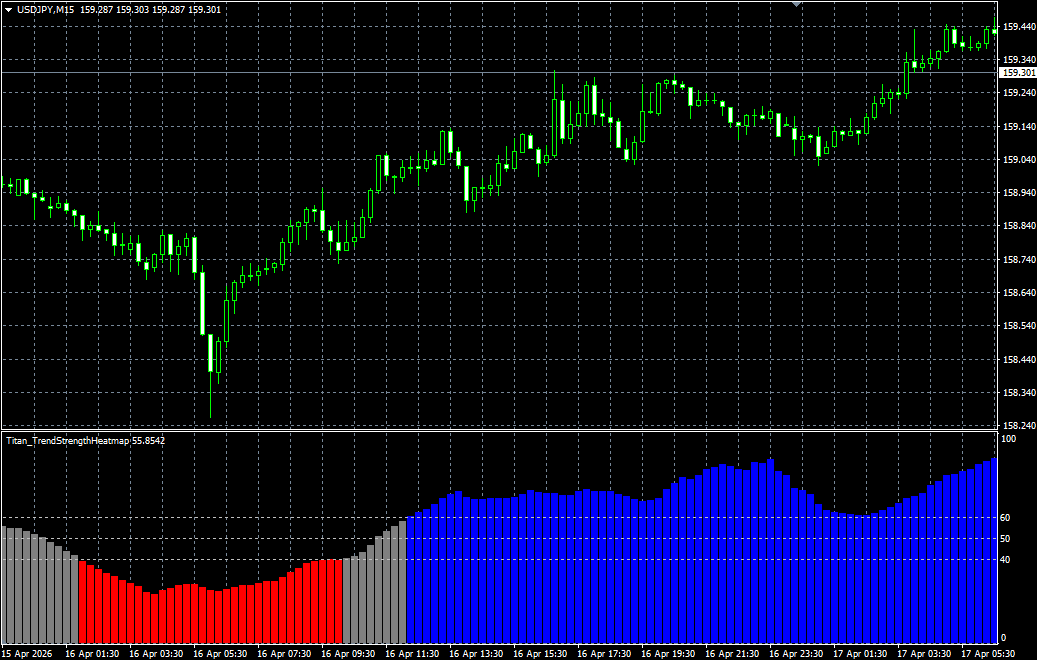
Titan_TrendStrengthHeatmap is an indicator that clearly displays whether the current market is strongly bullish, strongly bearish, or lacking a clear direction by using color-coded visualization.
This indicator measures trend strength on a scale from 0 to 100 by calculating the distance between a short-term EMA and a long-term EMA, adjusted by ATR. A higher score indicates stronger bullish momentum, while a lower score indicates stronger bearish momentum. Scores around the middle range indicate that the market lacks a clear directional bias.
The indicator is displayed as a histogram in a subwindow. Strong bullish conditions are shown in blue, strong bearish conditions in red, and weak directional conditions in gray. Even beginners can intuitively understand the current market environment simply by looking at the colors.
This indicator does not generate direct buy or sell signals. Instead, it can be used as a market condition analysis tool to determine the current market bias before deciding on an entry direction.
This indicator works only on the Windows versions of MT5 and MT4 provided by TitanFX.
Indicator Terms of Use
Only those who agree to all the following items may use the indicators distributed on this website (https://research.titanfx.com):
1.The indicators and related descriptions are based on various data believed to be reliable, but their accuracy and completeness are not guaranteed.
2.The data displayed by the indicators do not guarantee your investment results. Also, the displayed content may vary due to market conditions and communication environments.
3.Please make investment decisions using indicators at your own risk. We are not responsible for any disadvantages or damages arising from the use of indicators.
4.Specifications of the indicators are subject to change without notice. Changes will be announced on the indicator description pages, etc.
5.Indicators should only be used by customers who have downloaded them. Transferring or selling the indicators to third parties is prohibited.
Indicator Settings
Input (for MT5) / Parameter Input (for MT4) Tab Settings
| Variable Name | Description | Default |
|---|---|---|
| Fast EMA | Specifies the period of the short-term EMA. | 20 |
| Slow EMA | Specifies the period of the long-term EMA. | 50 |
| ATR | Specifies the ATR period. | 14 |
| Score Sensitivity | Sets the sensitivity for trend strength detection. Increasing the value makes the indicator more responsive, while decreasing it results in smoother changes. | 25 |
| Bullish Threshold | Specifies the threshold for determining bullish dominance. | 60 |
| Bearish Threshold | Specifies the threshold for determining bearish dominance. | 40 |
| Lookback Bars | Specifies the number of bars used as the calculation basis. | 3000 |
Color (for MT5) / Color Settings (for MT4) Tab Settings
Not used in this indicator.
| MT5 Variable Name | MT4 Variable Name | Description |
|---|---|---|
| 0 | 0 | Specifies the bar color when bullish conditions are dominant. |
| 1 | 1 | Specifies the bar color when market conditions are neutral. |
| 2 | 2 | Specifies the bar color when bearish conditions are dominant. |