How to Draw Trendlines on MT4 (Windows)
In MT4, you can draw trendlines anywhere on the chart. Here, we explain the basic methods for drawing, modifying, and customizing trendlines.
How to Draw Trendlines
Switching to Trendline Drawing Mode
To draw a trendline, switch to trendline drawing mode using one of the following methods:
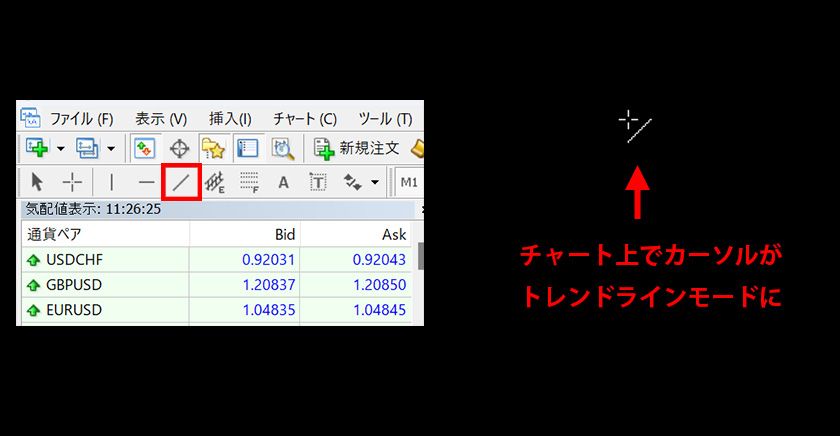
Method 1: From the Toolbar
Click the trendline icon on the toolbar. Move the cursor to the chart, and it will switch to trendline drawing mode.
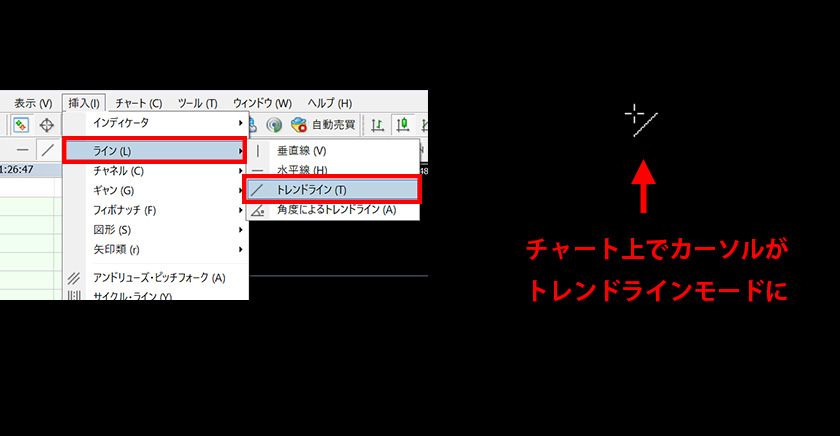
Method 2: From the Menu
Select "Trendline" under "Insert" -> "Lines" in the menu. Move the cursor to the chart to switch to trendline drawing mode.
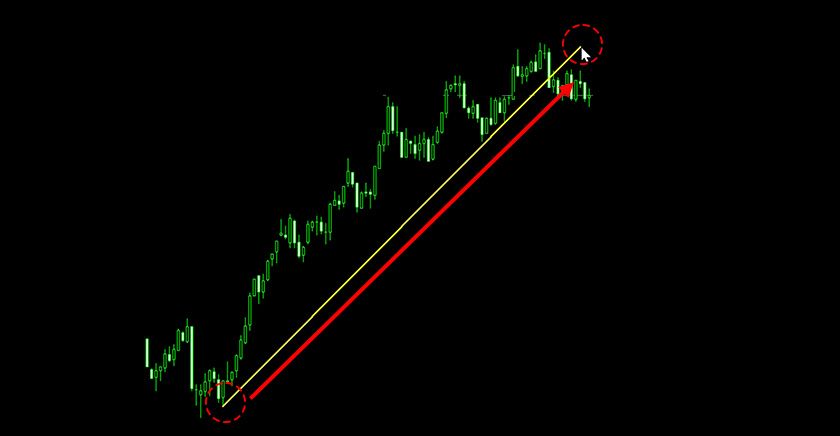
Drawing the Line
In trendline drawing mode, drag from the start point to the end point on the chart and release the mouse to complete the trendline.
How to Modify Line Position on the Chart
To modify a line's position, first select the line. Here's how to toggle line selection:
Checking Line Selection
A selected line shows small squares at the start, end, and midpoint. These indicate that the line is selected.
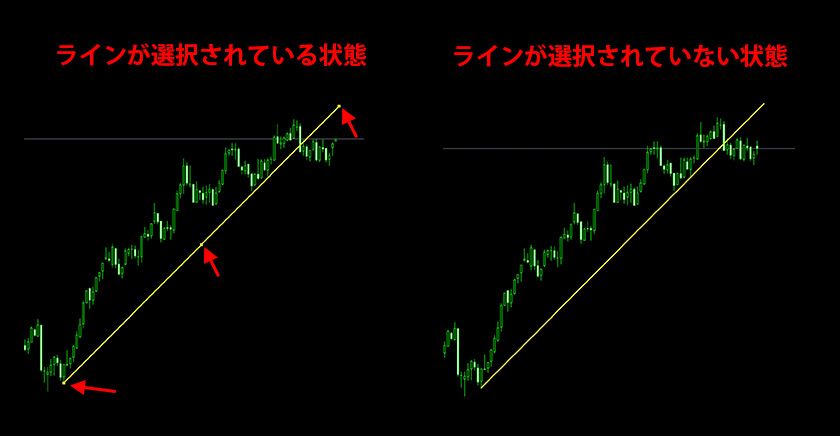
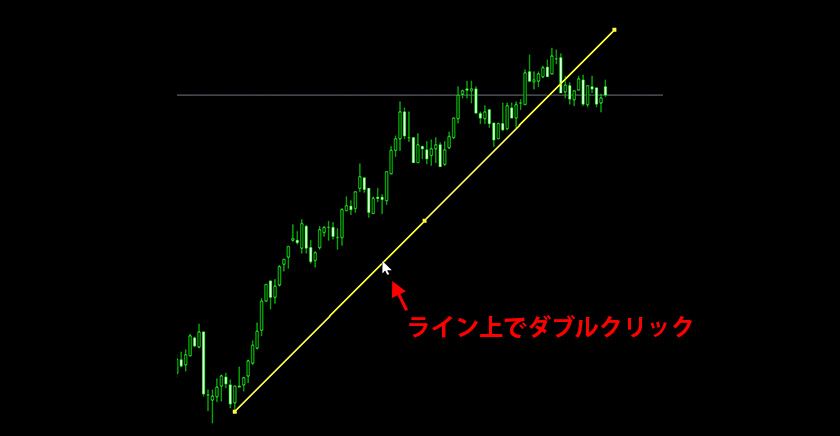
Toggling Line Selection
Double-click the line to toggle between selected and unselected states.
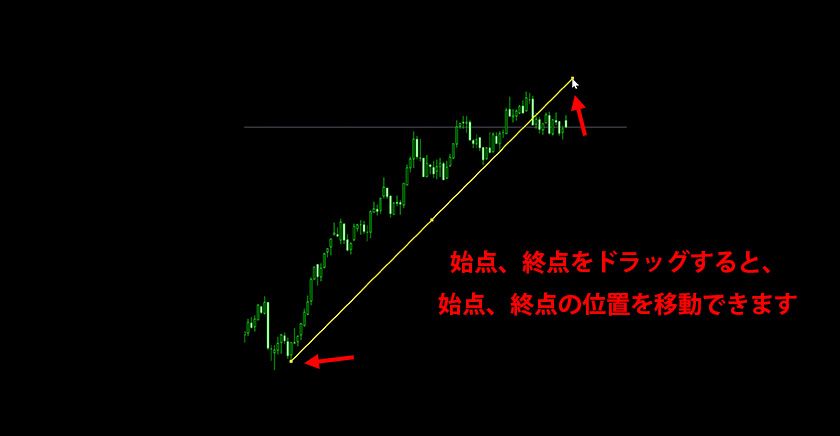
Modifying Start/End Points
Drag the small squares at the start or end of the line to move these points freely.
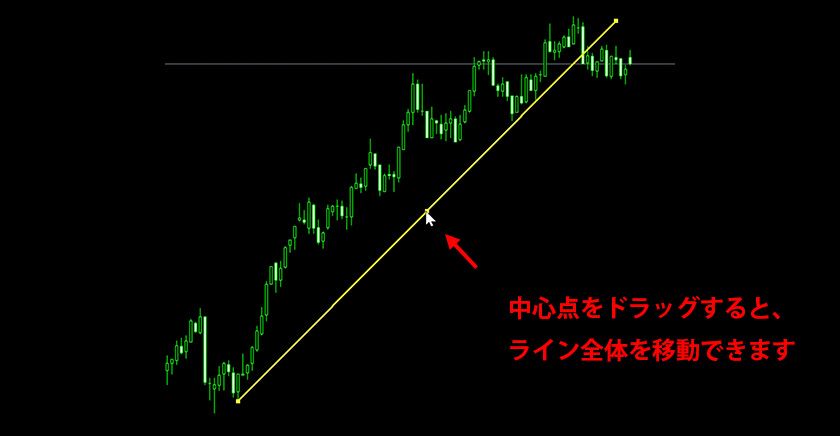
Moving the Entire Line
To move the line without changing its shape, drag the square at the line's center.
Modifying via Properties Window
For detailed modifications, use the line's properties window, accessible by:
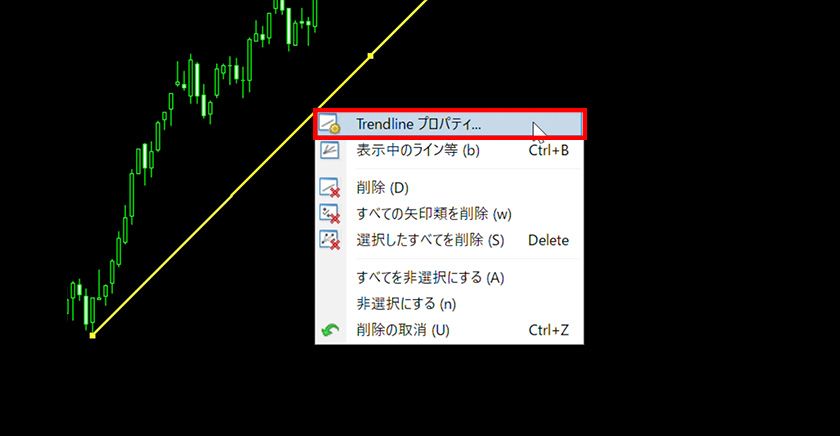
Method 1: Right-click the Line
Right-click the selected trendline and choose "Properties" from the menu.
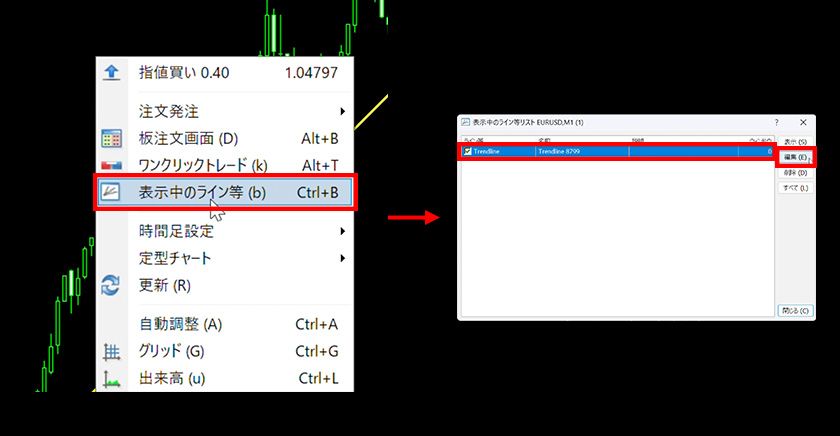
Method 2: From Object List
Right-click the chart, select "Object List," click the desired line, and choose "Properties."
The properties window has three tabs: "Common," "Parameters," and "Visualization." Settings on the "Common" and "Parameters" tabs save for future trendline drawings.
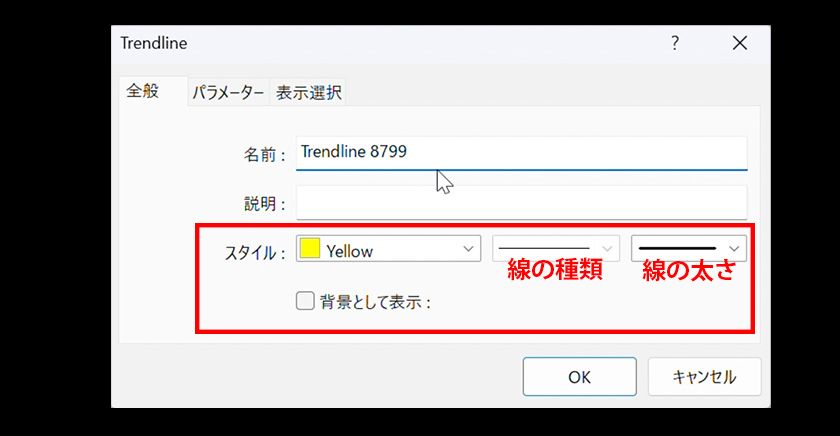
"Common" Tab Settings
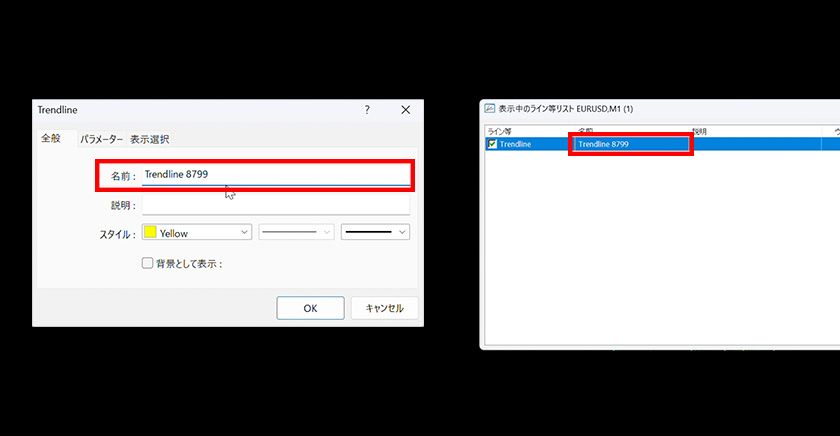
On the "Common" tab, you can set the line's name and style.
Line Name
Change the line's name under "Name." The name appears in the Object List.
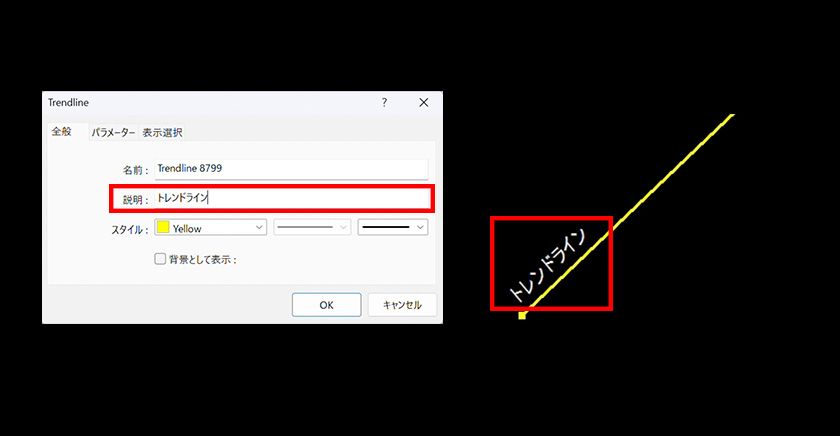
Line Description
Add a description under "Description." If "Show object descriptions" is checked in chart properties, this description appears near the line.
Line Style
Specify the line's color, type, and thickness under "Style." Note that thicker lines can only be solid.
Check "Draw object as background" to display the line behind candlesticks.
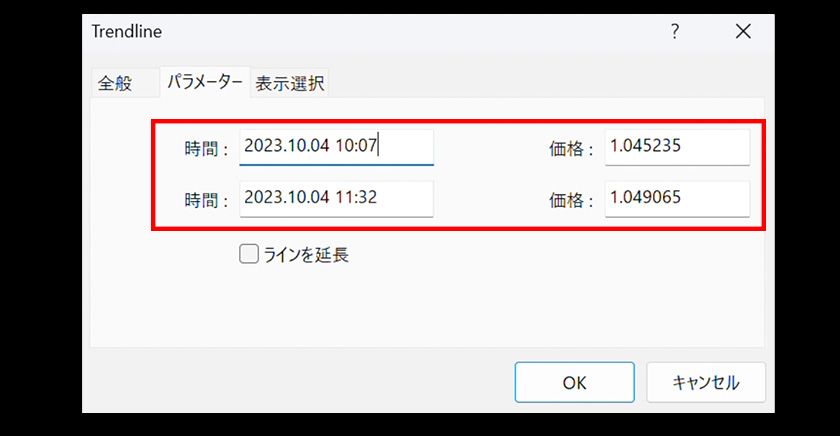
"Parameters" Tab Settings
On the "Parameters" tab, set the start and end positions by time and price, and configure line extensions.
Setting Start/End Points
Specify the start point at the top ("Time" and "Price") and the end point at the bottom ("Time" and "Price"). Use this for precise placement.
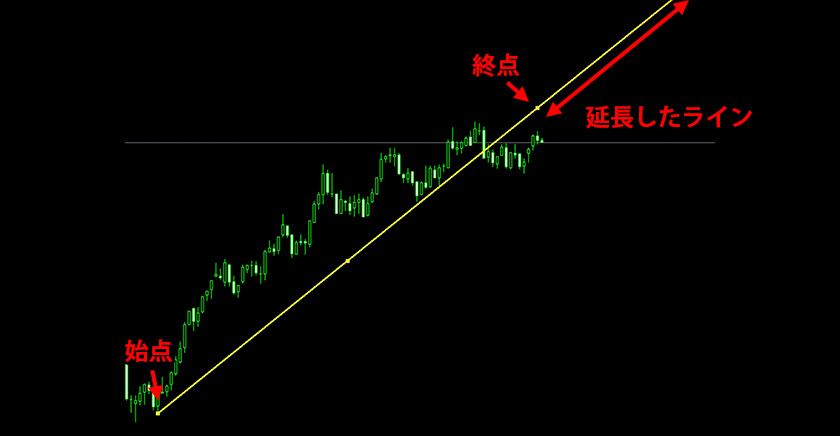
Extending the Line
Check "Extend line" to extend the line from the end point.
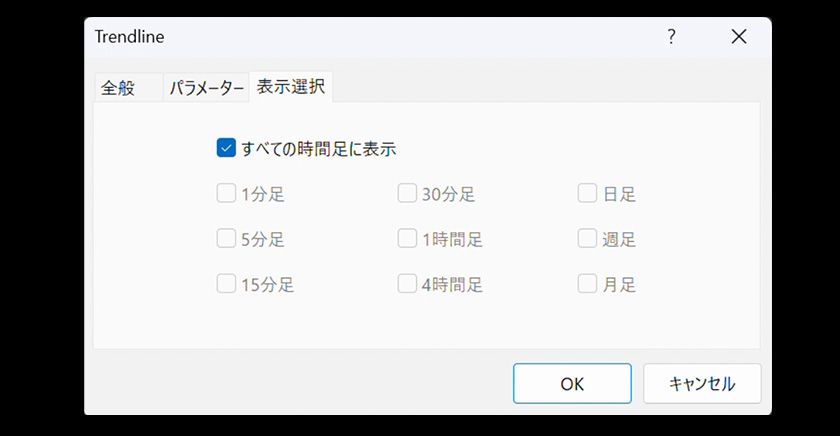
"Visualization" Tab Settings
On the "Visualization" tab, specify the timeframes on which the line is visible.
Selecting Timeframes
Check "Show on all timeframes" to display the line on all timeframes. Uncheck it to select specific timeframes for displaying the line.