ATR (Average True Range)
ATR (Average True Range) is a volatility indicator introduced by J. Welles Wilder in 1978 that measures the magnitude of price movement without predicting direction. A higher ATR means more violent moves; it is widely used to set dynamic stop-losses, adjust position size, and time entries, and it works across all markets and timeframes.
In forex, stock, and futures markets, price volatility is a factor traders cannot ignore. Reading volatility well helps you set stops more precisely, time entries, and even refine your strategy.
And ATR (Average True Range) is the tool that turns that volatility into a concrete number. It doesn't tell you direction — it answers a single question: how far does price typically travel in a day? That's exactly what lets you place stops and targets closer to the market's real rhythm.
This article systematically covers ATR's definition, calculation, charting setup, practical trading applications, and advanced strategies, so you can fully understand and harness its value in trading.
- ATR measures volatility, not direction (Wilder, 1978)
- True Range (TR) and the ATR formula (commonly 14 periods)
- Using ATR for dynamic stops, position sizing, and price targets
- How ATR differs across forex, stocks, futures, and crypto
- Drawing ATR on MT4/MT5 and Titan FX's free indicators
1. What Is ATR? A Market Volatility Indicator
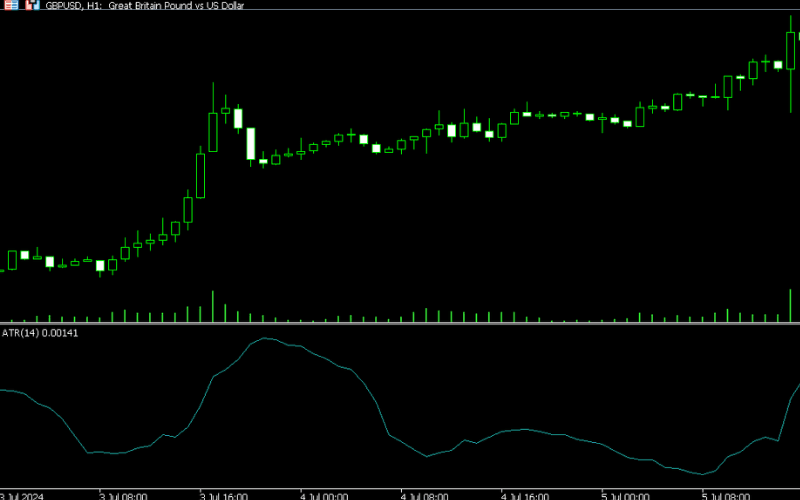
Average True Range (ATR) is a volatility indicator introduced by technical-analysis pioneer J. Welles Wilder in 1978 to measure the magnitude of market price movement.
ATR does not predict whether price will rise or fall; it objectively reflects how volatile the market currently is.
A high ATR means the market is moving violently, with large up or down swings; a low ATR means the market is relatively calm and the price range is narrow.
ATR is widely applicable — in forex, stocks, futures, or crypto — helping traders read market rhythm and apply it flexibly to stop placement, position management, and strategy optimization.
In short, ATR is a core tool for measuring risk and volatility, making trading decisions more scientific and reasonable.
2. ATR Calculation Method and Formula
Calculating ATR involves a few steps whose aim is to find the average true range over a set period. The True Range (TR) is the maximum price range of a given trading day, calculated as follows:
| Calculation | Description |
|---|---|
| The day's price range | The difference between the day's high and low. |
| Prior close vs. current high | The difference between the previous close and the current high. |
| Prior close vs. current low | The difference between the previous close and the current low. |
The True Range is the largest of these three values: TR = max[(High − Low), |High − Previous Close|, |Low − Previous Close|]
Once you have each day's True Range, ATR is the average of those values. ATR is usually computed as a 14-day moving average, but the period can be adjusted to a trader's needs. Using a simple moving average, the formula is:
ATR = (TR1 + TR2 + … + TR14) ÷ 14
In practice, to smooth the indicator, Wilder recommended computing ATR with an exponential moving average (EMA).
Because the True Range formula uses absolute values, TR is always non-negative, reflecting the magnitude of movement whether price rises or falls. Since ATR is the EMA of these non-negative TR values, ATR is also always positive, letting it reliably measure volatility regardless of the trend.
3. Practical Trading Applications of ATR
ATR is an important tool for gauging market volatility. Although ATR itself does not predict direction, its practical uses are extensive — through stop placement, position adjustment, and reading market rhythm, it helps manage risk and improve a strategy's win rate.
3.1 Setting a Sensible Stop-Loss
ATR's most common use is setting a dynamic stop-loss. A fixed stop distance is easily triggered by short-term noise; with ATR you can adjust the stop distance to current volatility, making it more reasonable. For example, if ATR is 50 points, you might place the stop 1–1.5× ATR beyond the entry to avoid being stopped out by normal swings.
3.2 Adjusting Position Size
ATR also helps adjust position size dynamically. When ATR rises, volatility is increasing, so reduce lot size to lower risk; when ATR falls, volatility is contracting, so you can add modestly to improve capital efficiency. This keeps the risk of each trade within a reasonable range and stabilizes long-term performance.
3.3 Setting Price Targets
ATR can also help estimate a realistic price range. Traders often set achievable targets based on the current ATR — for example, with a daily ATR of 80 points, set a profit target about 80 points from entry. This keeps targets neither too far nor too close, in line with actual volatility, improving the success rate.
3.4 Filtering Entry Timing by Volatility
Changes in ATR can also filter entries. A rising ATR signals a high-volatility phase suited to trend-following strategies; a clearly falling ATR means volatility is easing, with more false breakouts and range conditions, so it may be better to stand aside or use a range strategy to avoid chasing.
3.5 Pairing with Trend Indicators to Read Momentum
Although ATR has no direction, pairing it with a trend indicator such as a moving average helps confirm trend strength. In an uptrend, a rising ATR usually means buying momentum is strengthening; a falling ATR warns that upward momentum may be weakening. Likewise, in a downtrend a rising ATR shows stronger selling pressure and a falling ATR may hint at fading downside momentum. Note that ATR's changes only reflect the size of movement and cannot judge the trend on their own.
3.6 Spotting Possible Turning Signals
A sharp contraction in ATR can hint that an important change is near. If ATR drops quickly after a high-volatility phase, momentum may be fading and the market may be consolidating or preparing to reverse. Confirm breakout levels with other indicators or price patterns to capture potential opportunities.
4. How ATR Differs Across Markets
ATR is a volatility indicator broadly usable across markets — forex, stocks, futures, and crypto all measure price range with it. However, each market's trading traits, liquidity, and volatility habits affect how ATR readings should be interpreted and used. Understanding these differences helps you use ATR correctly and avoid misreadings.
| Market | Trading traits | ATR characteristics | Suggested use |
|---|---|---|---|
| Forex | 24-hour, high liquidity | Relatively stable ATR, strongly affected by session and events | Mind session differences; adjust by trading session |
| Stocks | Open/close, gap-prone | ATR easily affected by gaps, swings sharply | Watch opening gaps; don't ignore after-hours moves |
| Futures | Many products, some high-leverage | ATR varies widely by product, frequent swings | Tune ATR parameters per product; don't reuse a fixed value |
| Crypto | 24-hour, violent moves | ATR changes fast, extreme moves common | Shorten the ATR period; pair with short-term risk control |
5. How to Draw ATR (MT4/MT5)
On the MT4 or MT5 platform, you can draw ATR with these steps:
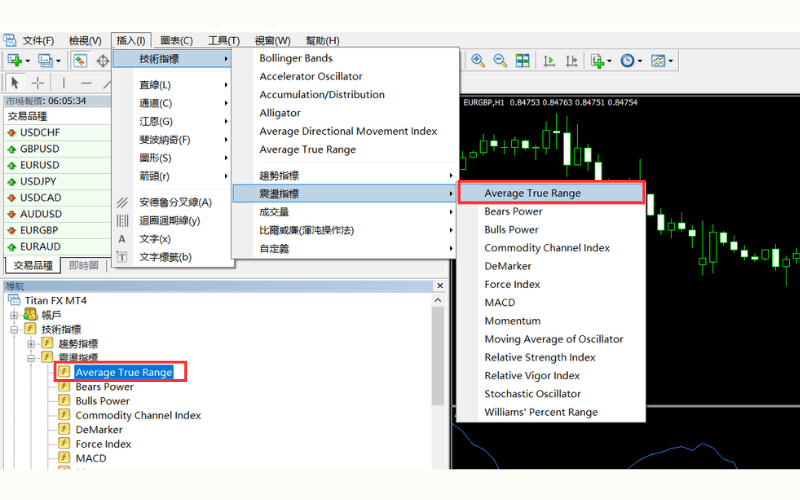
Drawing ATR in MT4
① Log in to MT4
② Open the chart of your instrument
③ From the menu, choose "Insert" - "Indicators" - "Oscillators" - "Average True Range"; or from the Navigator, "Indicators" - "Oscillators" - "Average True Range".
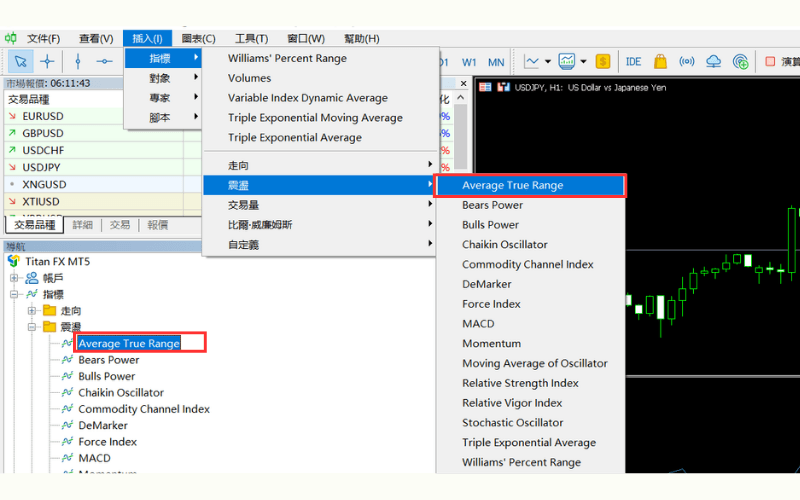
Drawing ATR in MT5
① Log in to MT5
② Open the chart of your instrument
③ From the menu, choose "Insert" - "Indicators" - "Oscillators" - "Average True Range"; or from the Navigator, "Indicators" - "Oscillators" - "Average True Range".
6. Titan FX's Free Custom Indicators (MT4/MT5)
Titan FX offers many free custom indicators for MT4/MT5. Designed to help optimize strategy and improve decision accuracy, they benefit beginners and experienced traders alike. Open a free Titan FX trading account to download and use them — opening an account is simple and fast, with no need to submit ID or proof of address.
How to Open a Titan FX AccountMulti-Timeframe Stochastic (Titan_Multi_Stochastic)
Beyond the period of the chart's timeframe, this indicator can also display periods from a longer timeframe.
Learn about and install "Titan_Multi_Stochastic"Display Four Oscillators (RSI, Stochastic KD, CCI, Psychological Line)
Titan_Oscillator_Checker can show, in a sub-chart, the state of one of four oscillators: RSI, Stochastic KD, CCI, and the psychological line. Being multi-timeframe, it can also display candlesticks of a longer period than the chart, and you can stack several to check short- and long-period indicators at once.
Learn about and install "Titan_Oscillator_Checker"7. ATR FAQ
Q1: Can ATR tell me the trend direction?
No. ATR measures only volatility, not whether price will rise or fall. To judge the trend, combine it with other tools such as moving averages and trendlines.
Q2: Can ATR values be compared directly across markets?
No. Different markets have different price units and volatility structures — forex, stocks, and futures ATRs vary widely — so watch relative changes within each market rather than absolute values.
Q3: What ATR period should I use?
14 is the most common, but you can adjust it to your style: 7–14 for short-term trading and 14–21 for swing trading. The key is to match the parameter to your strategy.
8. Conclusion
ATR is a practical, flexible volatility indicator that helps you manage risk, set stops, and read market rhythm. While ATR cannot predict price direction, combining it with other technical indicators improves the accuracy of your trading decisions. Understanding and using ATR well is an important step toward steady trading.
Further Reading
Titan FX's financial-market research team. We cover a broad set of instruments — foreign exchange, commodities (crude oil, precious metals, agricultural products), equity indices, US equities, and digital assets — producing educational content for investors.
Primary Sources (by Category)
- Definition and origin: Investopedia — ATR, J. Welles Wilder Jr. New Concepts in Technical Trading Systems (1978)
- Technical-analysis method: StockCharts — Average True Range (ATR)