How to Use Moving Averages (MA) in Trading

A Moving Average (MA) is a trend indicator that plots the average price over a set period, helping traders gauge market direction and timing. Common types include the SMA, EMA, and WMA.
Because they are simple to compute and easy to read, MAs are used across forex (FX), crypto, and stock markets alike — helping both beginners and seasoned traders filter out short-term noise and confirm trend direction and entry/exit timing.
For beginners, MAs are often the first technical tool due to their simplicity and practicality. For seasoned traders, they remain a key tool for capturing market movements. Widely used in trading strategies, MAs form the basis of techniques like the Golden Cross and Death Cross.
This article introduces the basics of MAs, their types, applications, and how to set them up on MT4/MT5, helping you master this vital tool for real-world trading.
- MA essence: Smooths the past N closing prices into a single line to identify trend direction
- Three types: SMA (equal weight) / EMA (recent-weighted) / WMA (linearly weighted) — sensitivity to recent data rises in that order
- Four read patterns: Price-vs-MA position / slope direction / deviation rate / Golden Cross & Death Cross
- Typical periods: Short 5/10, mid 20/60, long 120/200 — pick based on day-trade, swing, or long-hold style
- 1. What is a Moving Average (MA)?
- 2. Types and Calculation Methods of Moving Averages (MA)
- 3. Moving Average Period Selection and Parameter Settings
- 4. Interpretation and Application of Moving Averages (MA)
- 5. How to Use Moving Averages: MT4/MT5 Setup Guide
- 6. Advanced Applications of Moving Averages: Titan FX's 7 Custom Indicators
- 7. Frequently Asked Questions (FAQs) About Moving Averages
- 8. Conclusion
1. What is a Moving Average (MA)?
The Moving Average (MA), often referred to as the "average line," is one of the most fundamental and widely used indicators in technical analysis. Its primary role is to smooth price fluctuations, helping investors more clearly identify market trends.
By calculating the average price over a specific period, the moving average filters out short-term market noise, providing more reliable trend signals.
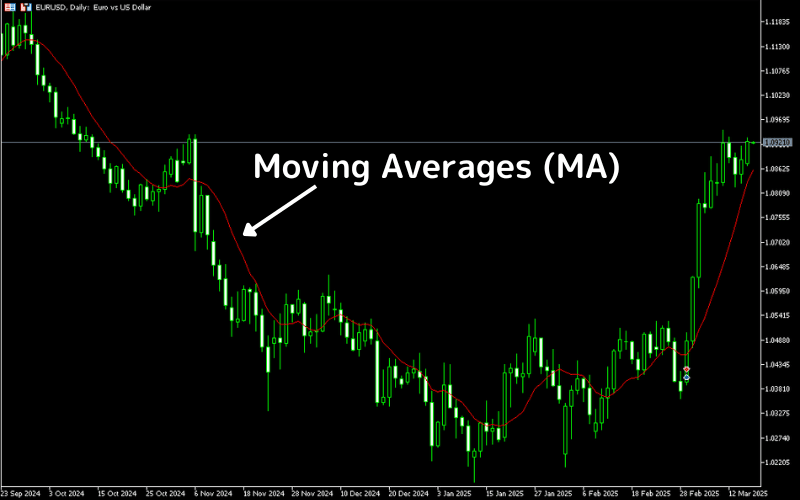
At its core, the moving average reflects the "average" cost of the market over a given time frame. When prices are above the moving average, it typically indicates a bullish market; when prices are below, it may signal a bearish market.
Displayed as a line chart over price data, the slope of the moving average helps investors quickly assess market trends:
- Uptrend: The moving average slopes upward, suggesting a bullish market.
- Downtrend: The moving average slopes downward, indicating a bearish market.
- Sideways Trend: The moving average flattens, suggesting a consolidating or range-bound market.
2. Types and Calculation Methods of Moving Averages (MA)
The Moving Average (MA) is a widely used trend indicator in technical analysis. Its main types include:
- Simple Moving Average (SMA): Simple to calculate, ideal for long-term trend analysis.
- Exponential Moving Average (EMA): Gives more weight to recent prices, suitable for short-term trading.
- Weighted Moving Average (WMA): Further emphasizes the latest price movements, making it more responsive to short-term trends.
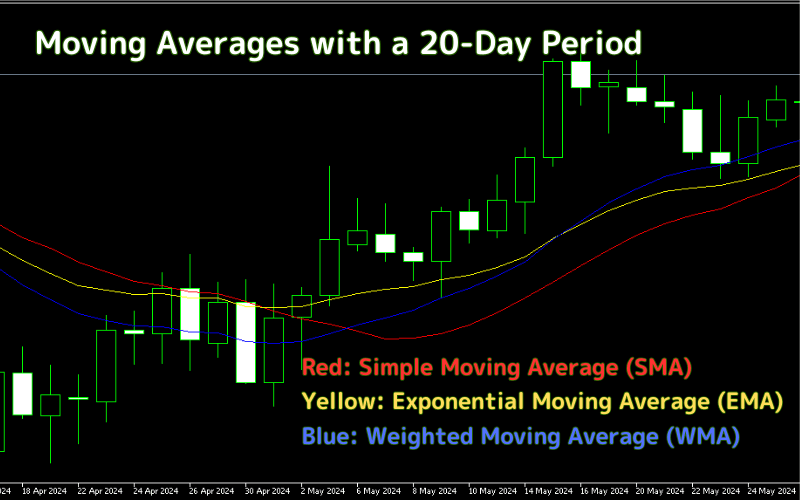
Different types of moving averages are suited for different trading strategies. Below are their definitions and calculation methods.
Simple Moving Average (SMA)
The SMA (Simple Moving Average) is the most basic type of moving average. It smooths price fluctuations by calculating the average closing price over a specific period, helping to identify trend direction.
Calculation Formula
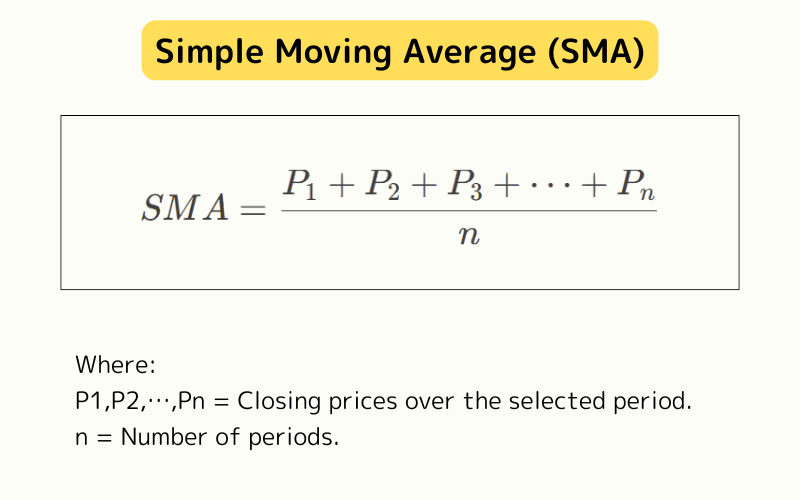
Example (5-Day SMA)
- Closing prices: 100, 102, 101, 105, 107.
- SMA = (100 + 102 + 101 + 105 + 107) ÷ 5 = 103.
- If the 6th day's closing price is 108, the new 5-day SMA = (102 + 101 + 105 + 107 + 108) ÷ 5 = 104.60.
Features and Applications
Advantages: Easy to understand, effectively filters short-term noise, highlights long-term trends.
Disadvantages: Slow to react, less responsive to recent price changes.
Use Case: Ideal for long-term investors to determine the overall market direction.
Exponential Moving Average (EMA)
The EMA (Exponential Moving Average) is more sensitive to recent price changes, making it faster at reflecting market trends. It is ideal for short-term traders.
Calculation Formula
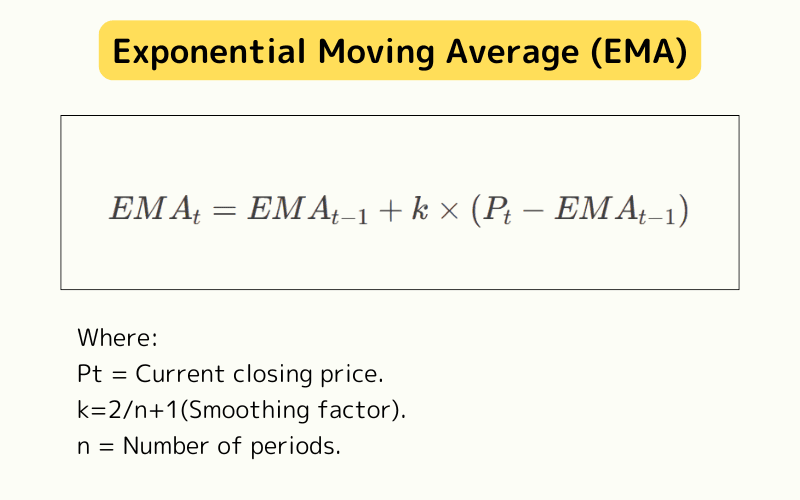
Example (5-Day EMA)
- Previous 5-day closing prices: 100, 102, 101, 105, 107.
- Day 1 EMA = SMA = 103.
- Day 6 closing price = 108, then:
EMA6 = 103 + [2 ÷(5 + 1)] × ( 108 − 103 ) = 103 + 1.67 = 104.67
Features and Applications
Advantages: More responsive to recent price changes, suitable for short-term trading strategies.
Disadvantages: May overreact to market noise, potentially generating more false signals.
Use Case: Commonly used by short-term traders for intraday or swing trading.
Weighted Moving Average (WMA)
The WMA (Weighted Moving Average) assigns higher weight to recent prices, making it faster to react than the SMA. It is suitable for short-term traders.
Calculation Formula
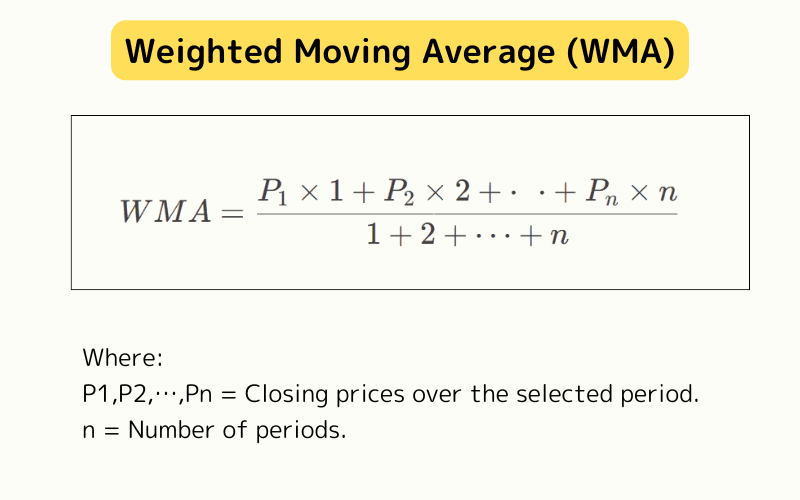
Example (5-Day WMA)
- Closing prices: 100, 102, 101, 105, 107.
- Weighted calculation: WMA = (100×1 + 102×2 + 101×3 + 105×4 + 107×5) ÷ (1+2+3+4+5) = 104.13。
Features and Applications
Advantages: Responds more quickly to price changes, ideal for short-term trading.
Disadvantages: Sensitive to market noise, potentially leading to frequent trading.
Use Case: Suitable for short-term or intraday traders looking to quickly capture market movements.
3. Moving Average Period Selection and Parameter Settings
The Moving Average (MA) is a crucial tool in technical analysis. By setting different periods, investors can identify short-, medium-, and long-term market trends and develop suitable trading strategies.
Applications of Moving Averages with Different Periods
The choice of moving average depends on the trading time frame:
- Short-Term Trading (Minute K, Hourly K): Suitable for 1MA, 5MA, 10MA, commonly used for day trading or short-term strategies.
- Swing Trading (Daily K): 20MA, 60MA, helpful for identifying medium-term trends.
- Long-Term Investing (Weekly K, Monthly K): 120MA, 240MA, used to confirm long-term market direction.
Common Moving Averages in Daily K-Line and Their Significance
In daily K-line charts, common moving average periods and their uses are as follows:
- 5MA (Weekly Line): A reference indicator for short-term trend changes.
- 10MA (Biweekly Line): Confirms short-term trend strength.
- 20MA (Monthly Line): Identifies medium-term trends.
- 60MA (Quarterly Line): A key reference for medium- to long-term market trends.
- 120MA (Half-Year Line), 240MA (Annual Line): Used for long-term investing to assess the overall market direction.
Applications of Short, Medium, and Long Moving Averages
Based on their length, moving averages can be categorized as:
- Short MAs (5MA, 10MA): React quickly to price changes, suitable for short-term trading.
- Medium MAs (20MA, 60MA): Balance short-term fluctuations, ideal for swing trading.
- Long MAs (120MA, 240MA): Confirm long-term market trends, suitable for long-term investors.
Some traders customize their strategies by choosing specific values, such as 6MA or 21MA, to better align with market signals.
4. Interpretation and Application of Moving Averages (MA)
The interpretation of moving averages focuses on three key aspects:
- 4.1. Price Position Relative to the Moving Average
- 4.2. Slope Direction of the Moving Average
- 4.3. Moving Average Deviation Rate (Bias)
- 4.4. Golden Cross (Buy Signal): Short MA crosses above Long MA
- 4.5. Death Cross (Sell Signal): Short MA crosses below Long MA
- 4.6. Guppy's Multiple Moving Average (GMMA): Identifies buy/sell points based on 8 patterns
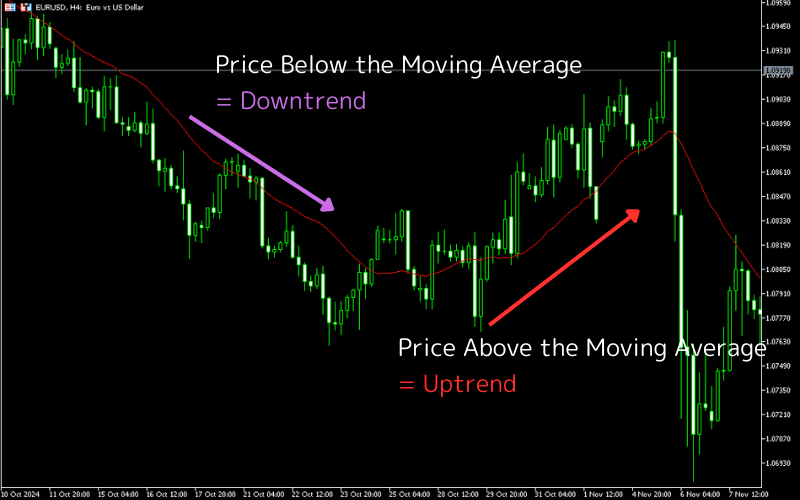
4.1. Price Position Relative to the Moving Average
By observing the position of the price (K-line) relative to the moving average, market trends can be identified:
- Price Above the Moving Average: Typically indicates an upward trend.
- Price Below the Moving Average: Typically indicates a downward trend.
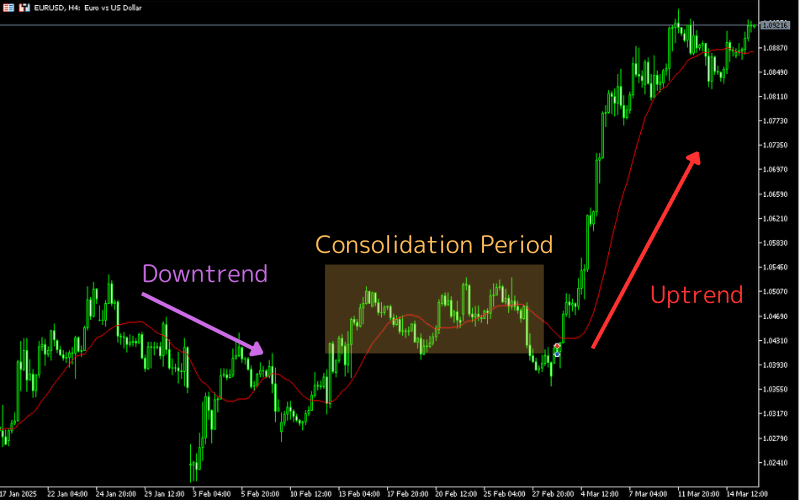
4.2. Slope Direction of the Moving Average
The slope direction of the moving average provides important trend signals:
- Upward Slope: Indicates an upward trend, with a steeper slope suggesting a stronger trend.
- Downward Slope: Indicates a downward trend, with a steeper slope suggesting a stronger trend.
- Flat Slope: Suggests a consolidating market with no clear direction.
4.3. Moving Average Deviation Rate (Bias)
The Deviation Rate measures the distance between the price and the moving average, reflecting how much the price deviates from the average. Moving averages have a mean-reverting property, meaning prices tend to return to the average after significant deviations. This makes the deviation rate useful for identifying potential reversal points:
- High Deviation Rate: Suggests the price may be near a peak, increasing the likelihood of a reversal.
- Low Deviation Rate: Suggests the price may be near a trough, decreasing the likelihood of a reversal.

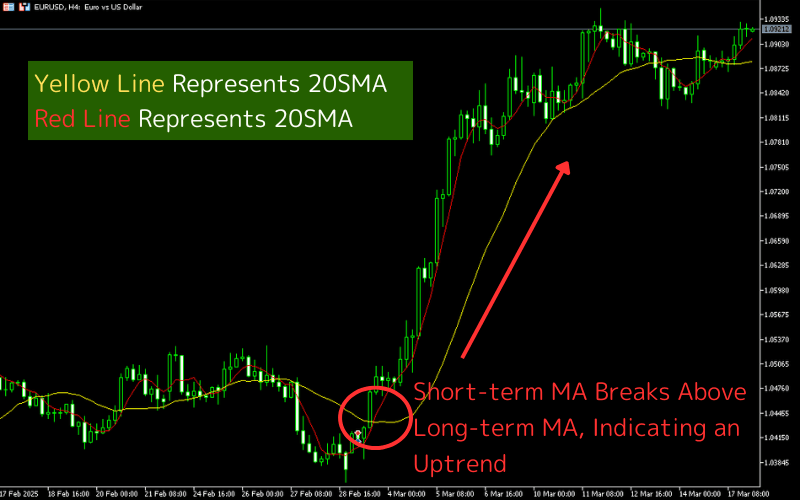
4.4. Golden Cross (Buy Signal): Short MA Crosses Above Long MA
The Golden Cross occurs when the short-term moving average crosses above the long-term moving average, typically signaling a buy opportunity.
Further Reading: What is a Golden Cross?
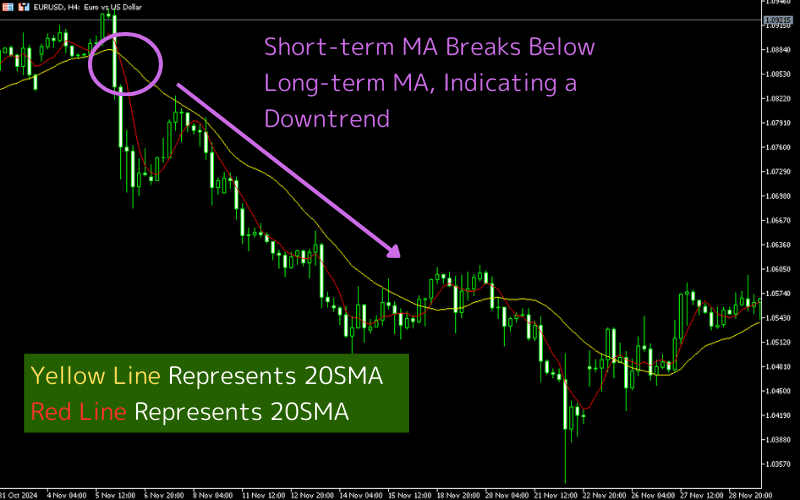
4.5. Death Cross (Sell Signal): Short MA Crosses Below Long MA
The Death Cross occurs when the short-term moving average crosses below the long-term moving average, typically signaling a sell opportunity.
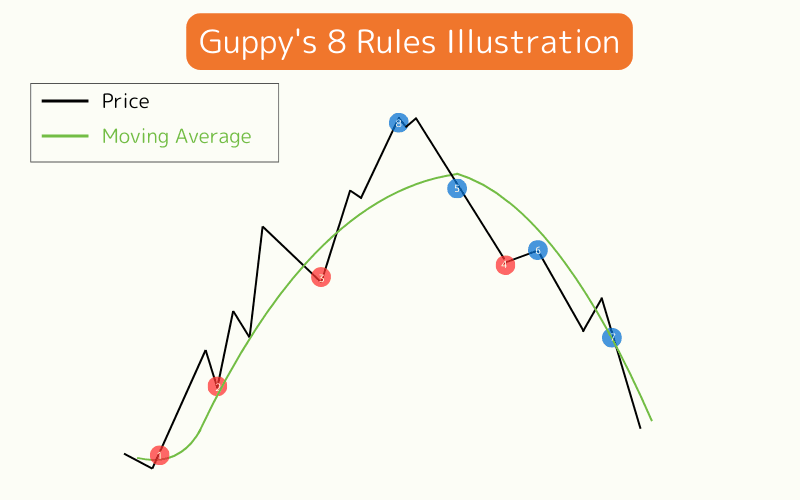
4.6. Guppy's Multiple Moving Average (GMMA): 8 Patterns for Buy/Sell Signals
Developed by Joseph E. Granville, this theory identifies 8 buy/sell signals based on the relationship between price and moving averages.
Buy Signals
| Buy Signal | Description |
|---|---|
| ① Price Breaks Above and Holds Above the Moving Average | Indicates the start of a bullish trend. |
| ② Price Pulls Back to the Moving Average and Rebounds | Confirms a buy point after testing support. |
| ③ Price Briefly Dips Below the Moving Average but Quickly Recovers, with the MA Still Rising | A false breakdown, suggesting the uptrend remains intact. |
| ④ Price Deviates Significantly Below the Moving Average, Indicating Oversold Conditions | A potential technical rebound due to excessive deviation. |
Sell Signals
| Sell Signal | Description |
|---|---|
| ⑤ Price Breaks Below and Holds Below the Moving Average | Indicates the start of a bearish trend. |
| ⑥ Price Rallies to the Moving Average but Fails to Break Above | Confirms a sell point after testing resistance. |
| ⑦ Price Briefly Rises Above the Moving Average but Quickly Falls Back, with the MA Still Declining | A false breakout, suggesting the downtrend remains intact. |
| ⑧ Price Deviates Significantly Above the Moving Average, Indicating Overbought Conditions | A potential technical pullback due to excessive deviation. |
5. How to Use Moving Averages: MT4/MT5 Setup Guide
The Moving Average (MA) is a commonly used tool in technical analysis. Setting up moving averages on MT4 (MetaTrader 4) and MT5 (MetaTrader 5) platforms is straightforward. Below are detailed setup steps and parameter explanations.
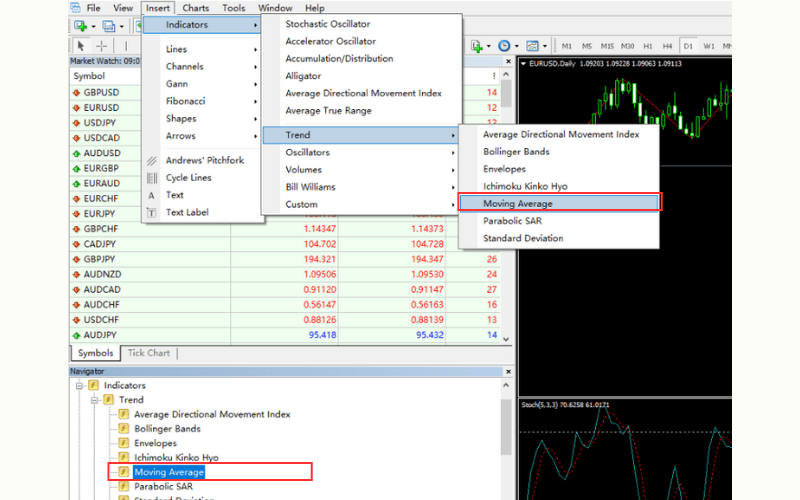
How to Plot a Moving Average in MT4
① Log in to MT4.
② Open the chart of the trading instrument.
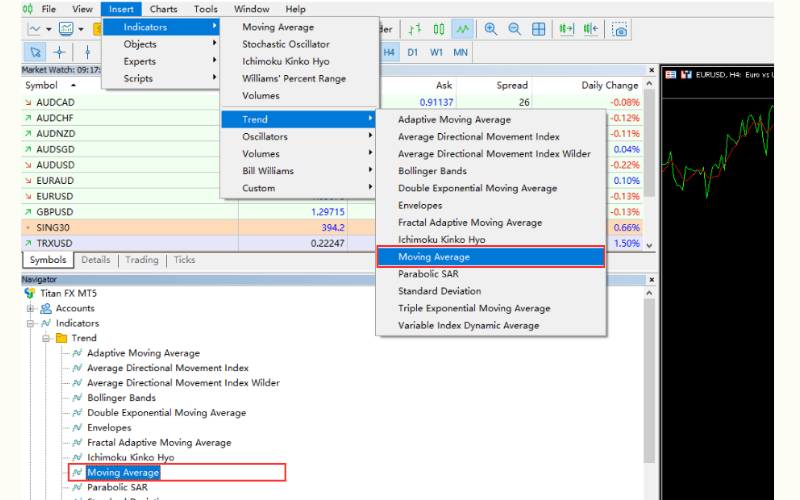
③ Click on the menu bar: Insert > Indicators > Trend > Moving Average; or navigate to the Navigator > Indicators > Trend > Moving Average.
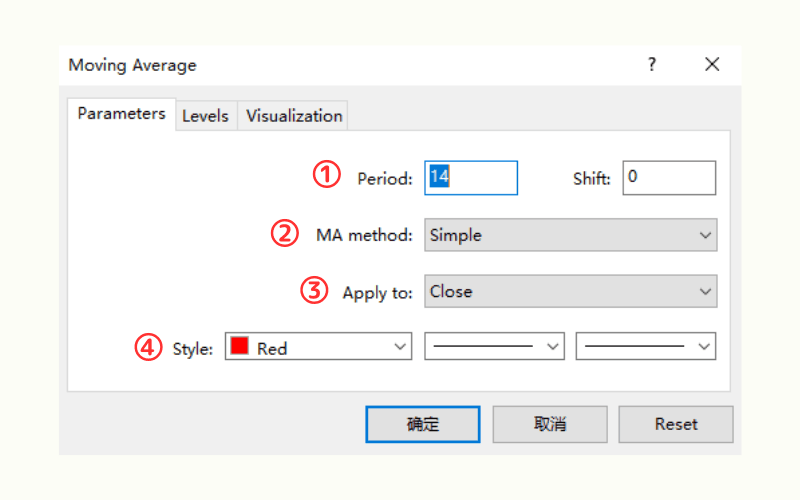
MT4 Moving Average Settings
| Option | Description |
|---|---|
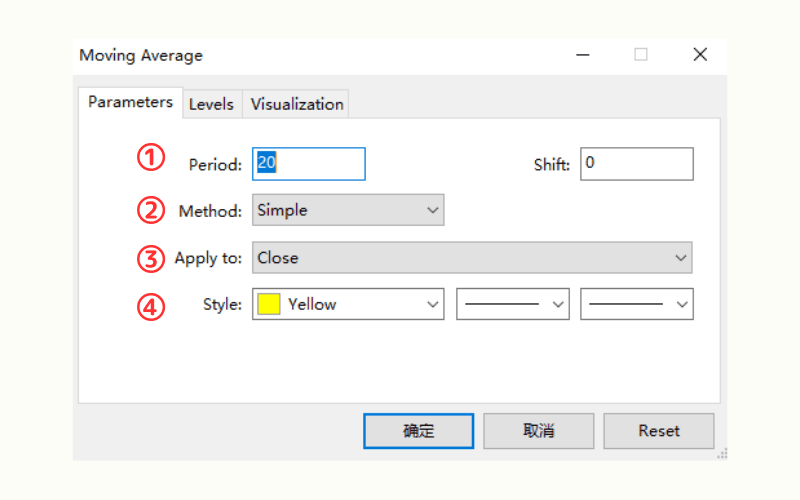
| ① Period | Set the calculation period for the moving average, e.g., setting 20 creates a 20MA. |
| ② MA Method | - Simple: Simple Moving Average (SMA). - Exponential: Exponential Moving Average (EMA). - Linear Weighted: Weighted Moving Average (WMA). - Smoothed: Smoothed Moving Average (SMMA). |
| ③ Apply to | Choose the price basis for calculation, typically Close (closing price). |
| ④ Style | Customize the color, line style, and thickness of the moving average for easier differentiation. |
How to Plot a Moving Average in MT5
① Log in to MT5.
② Open the chart of the trading instrument.
③ Click on the menu bar: Insert > Indicators > Trend > Moving Average; or navigate to the Navigator > Indicators > Trend > Moving Average.
MT5 Moving Average Settings
| Option | Description |
|---|---|
| ① Period | Set the calculation period for the moving average, e.g., setting 20 creates a 20MA (20-day moving average). |
| ② Method | - Simple: Simple Moving Average (SMA). - Exponential: Exponential Moving Average (EMA). - Linear Weighted: Weighted Moving Average (WMA). - Smoothed: Smoothed Moving Average (SMMA). |
| ③ Apply to | Choose the price basis for calculation, typically Close (closing price). |
| ④ Style | Customize the color, line style, and thickness of the moving average for easier differentiation. |
6. Advanced Applications of Moving Averages: Titan FX's 7 Custom Indicators
Titan FX offers a range of professional custom indicators based on moving averages, designed for MT4/MT5 platforms. These tools help traders analyze market trends in depth and optimize their trading strategies.
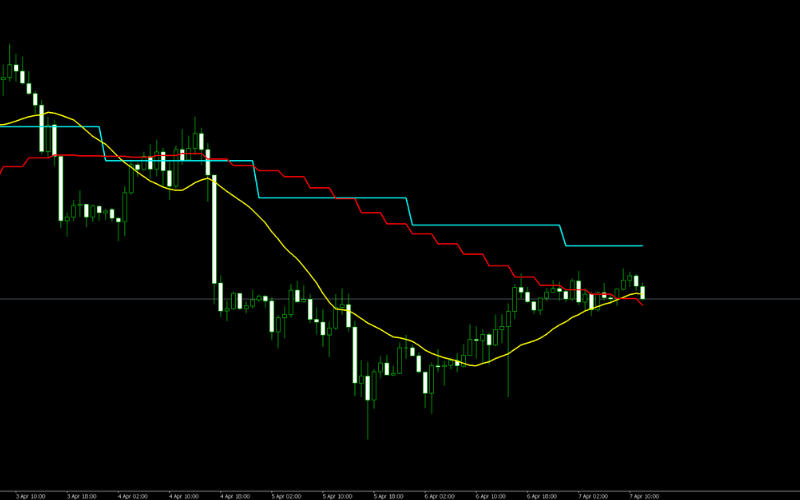
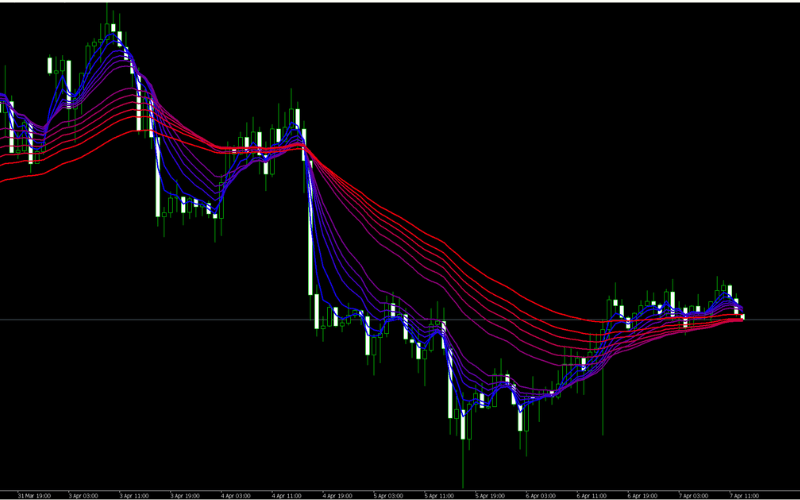
6.1. Multi-Timeframe Moving Averages (Titan_Multi_MA)
This indicator displays moving averages for both the current chart timeframe and longer timeframes, enabling traders to quickly identify potential support/resistance levels and signals for trend changes.
Learn More and Install Multi-Timeframe Moving Averages
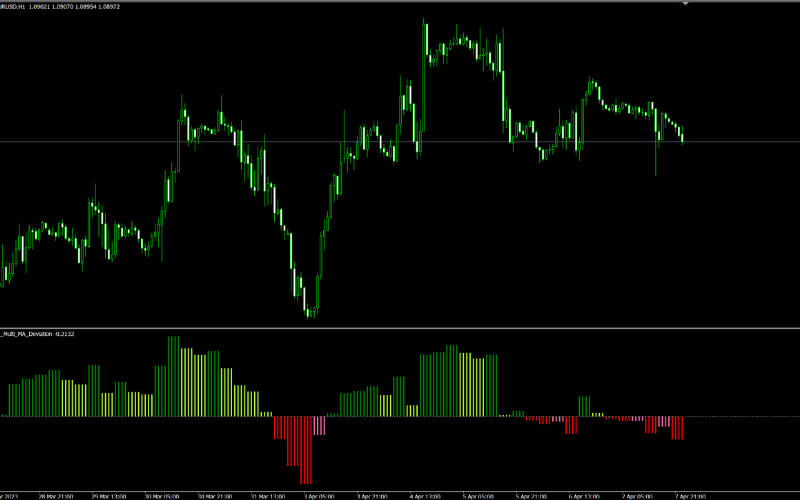
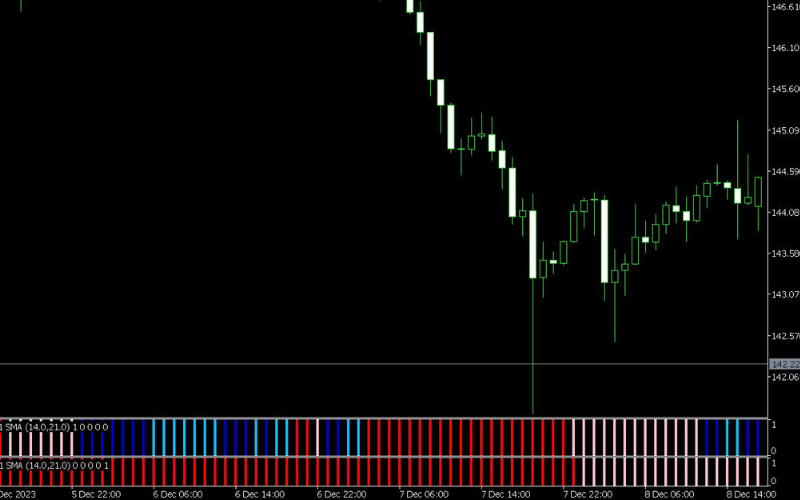
6.2. Moving Average Deviation (Titan_Multi_MA_Deviation)
This indicator shows the deviation of price from the moving average as a histogram or line, helping traders identify overbought/oversold conditions and potential trend reversals.
- Works with multiple timeframes
- Supports SMA, EMA, SMMA, and LWMA
- Ideal for analyzing short-term market extremes and spotting trading opportunities
Learn More and Install Moving Average Deviation
6.3. Moving Average Bands (Titan_Multi_MA_Bands)
This indicator draws up to 5 deviation lines above and below the moving average, creating price channels. It helps analyze trend strength, identify overextended markets, and locate potential support/resistance zones.
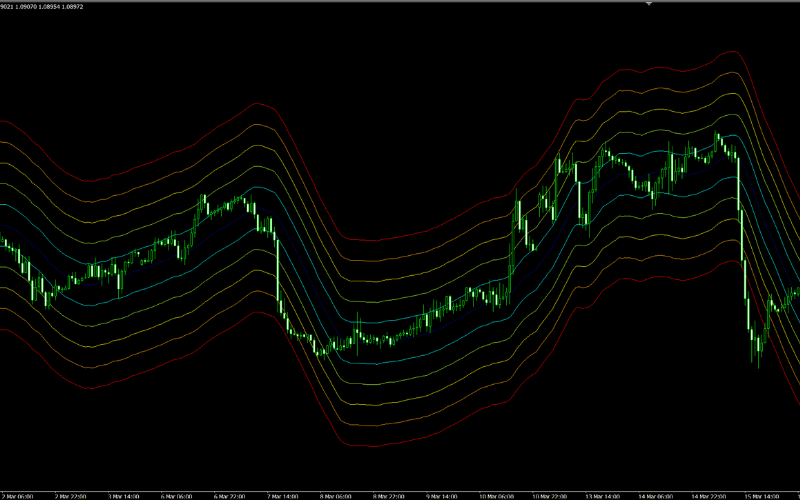
Learn More and Install Moving Average Bands
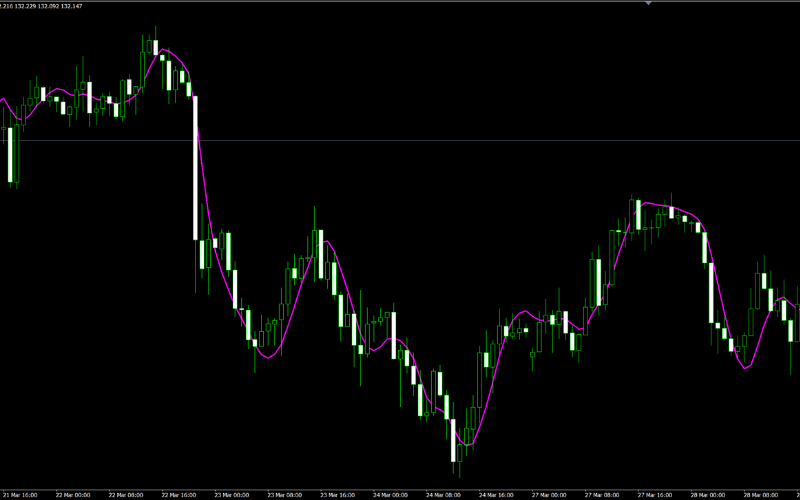
6.4. Multi-Timeframe Hull Moving Average (Titan_Multi_HMA)
The Hull Moving Average (HMA), also known as the Hull MA, provides a smoother moving average calculation, reducing market noise. This indicator allows traders to view HMA for both current and longer timeframes, making it ideal for trend-following and momentum analysis.
Learn More and Install Multi-Timeframe Hull Moving Average
6.5. Trend Checker for 3 Indicators (Titan_Trend_Checker)
This indicator allows traders to select one of three trend-based indicators (SMA/EMA, DMI, or Parabolic SAR) and displays its current status in a subchart.
- Supports multi-timeframe analysis
- Ideal for trend confirmation and market strength assessment
Learn More and Install Trend Checker for 3 Indicators
6.6. Guppy Multiple Moving Average (Titan_GMMA)
The Guppy Multiple Moving Average (GMMA) consists of 12 EMAs, designed to analyze both short-term and long-term market trends.
- Short-term EMAs (3, 5, 8, 10, 12, 15): Track short-term price movements.
- Long-term EMAs (30, 35, 40, 45, 50, 60): Confirm the overall trend direction.
Learn More and Install Guppy Multiple Moving Average
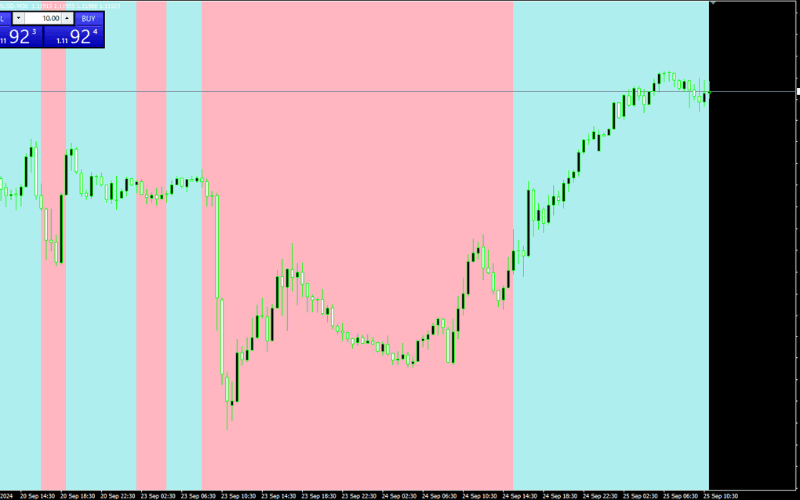
6.7. Moving Average Trend Background (Titan_MA_Trend)
This indicator changes the chart background color based on the slope of the moving average. When the moving average rises or falls compared to the previous candle, the background color changes, allowing traders to quickly identify market trends and make faster trading decisions.
Learn More and Install Moving Average Trend Background
7. Frequently Asked Questions (FAQs) About Moving Averages
Here are some common questions and brief answers about moving averages:
Q1. What should I be aware of when using moving averages?
- Lagging Nature: Moving averages are based on historical prices, so they react slowly to market changes, potentially missing optimal trading opportunities.
- Market Noise: In choppy markets, moving averages may generate false signals, leading to incorrect trading decisions.
- Parameter Selection: Different periods suit different trading strategies; choosing the wrong period may reduce effectiveness.
Q2. How can I avoid false signals from moving averages?
- Combine with Other Indicators: Use tools like RSI or MACD to confirm trend validity.
- Multiple MA Combinations: Use a combination of short-, medium-, and long-term MAs (e.g., 5MA and 20MA) to filter out some false signals.
- Observe Price Action: Incorporate support/resistance levels and candlestick patterns to improve accuracy.
Q3. Which trading strategies are moving averages suitable for?
- Trend Following: In trending markets, moving averages effectively identify and track trend direction.
- Swing Trading: Use short- to medium-term MAs (e.g., 10MA, 20MA) to capture swing movements.
- Long-Term Investing: Use long-term MAs (e.g., 120MA, 240MA) to assess the market's long-term trend.
8. Conclusion
Moving Averages (MA) are a core tool in technical analysis, used to smooth price fluctuations and identify market trends. Common types include SMA, EMA, and WMA, each suited to different trading strategies.
Investors can choose periods (e.g., 5MA, 20MA, 60MA) based on their trading style and use the relationship between price and MA, slope direction, and deviation rates to assess trends.
Advanced techniques like the Golden Cross and Death Cross can enhance trading accuracy. When combined with other indicators, moving averages become a powerful tool for making informed trading decisions.
Further Reading
- Moving Average Deviation (Bias)
- Golden Cross
- MACD (Moving Average Convergence Divergence)
- RSI (Relative Strength Index)
- Bollinger Bands
The Titan FX Financial Markets Research and Analysis Team. Covering forex (FX), commodities (crude oil, precious metals, agricultural products), stock indices, US equities, and crypto assets, the team produces educational content for investors across a broad range of financial instruments.
Primary Sources (by Category)
- Education & research: CMT Association, Investopedia: Moving Average, Wikipedia: Moving average
- Original works: J. Welles Wilder Jr., New Concepts in Technical Trading Systems; Joseph E. Granville, A Strategy of Daily Stock Market Timing for Maximum Profit
- Platform documentation: MetaQuotes MT4 / MT5 built-in Moving Average indicator reference
- Media & research: Bloomberg, Reuters, and Wall Street Journal technical-analysis coverage