Moving Average

Death Cross Explained: Definition, Patterns, Sell Timing, and Strategy
The death cross is a widely used sell or hedging signal in technical analysis: when a short-term moving average crosses below a longer one, it often warns that the trend may reverse to the downside. This guide covers the definition, patterns, calculation, and practical strategies, and compares it with the golden cross.

How to Use Moving Averages (MA) in Trading
Moving Averages (MA) are essential in technical analysis. This article covers types (SMA, EMA, WMA), setup, application tips (Golden/Death Cross), and FAQs.

Granville's Eight Rules: Trading Guide,Tips and Trading Signals
This article will explain the principles behind Granville's Rules, its eight key buy/sell signals, practical applications, and common pitfalls—helping traders improve entry timing and strategy reliability.

Golden Cross: Definition, Strategies, and Applications
Discover the Golden Cross in trading. Learn its definition, signals, strategies, and Titan FX tools to spot trends in forex, stocks, and more.
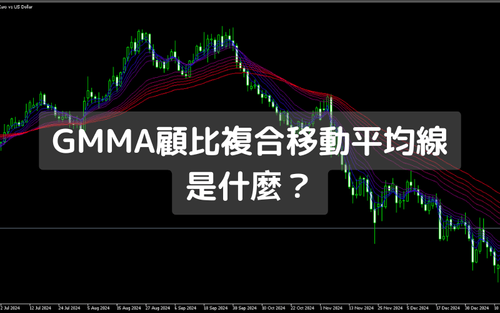
Guppy Multiple Moving Average (GMMA):Basics & Application
Guppy Multiple Moving Average,employs 12 EMAs on charts to assess market trends, guiding trading decisions.Understand its concepts, analysis, and strategic use.
Selecting Moving Average Time Periods | How to Choose the Best Parameters
The period parameter of a moving average refers to the specific number of days used for its calculation. The chosen period should align with the trader's style. Typically, short-term settings include 5, 10, 14, 15, 20, or 21 days; medium-term settings include 50, 60, or 75 days; and long-term settings include periods like 100 or 200 days.

What is the Exponential Moving Average (EMA)? Calculation, Parameter Settings, and Applications
The Exponential Moving Average (EMA) is a widely used technical analysis tool that emphasizes recent price data, offering quicker responses to market trends compared to the Simple Moving Average (SMA). This makes EMA particularly valuable for short-term trading decisions. This article explores EMA's calculation, applications in market analysis, and strategies to optimize trading using this tool.

Concept and Calculation of BIAS: How to Catch the Best Timing for Buy and Sell?
The Bias Ratio (BIAS), also known as the Deviation Ratio, is a technical indicator in financial market analysis used to measure the deviation between an asset's current price (such as stocks or forex) and its average price over a specific period. Positive and negative BIAS values describe and quantify the degree of deviation between the market price and its moving average, helping to identify whether the asset might be overvalued or undervalued in relation to its trend line.