Golden Cross: Definition, Strategies, and Applications
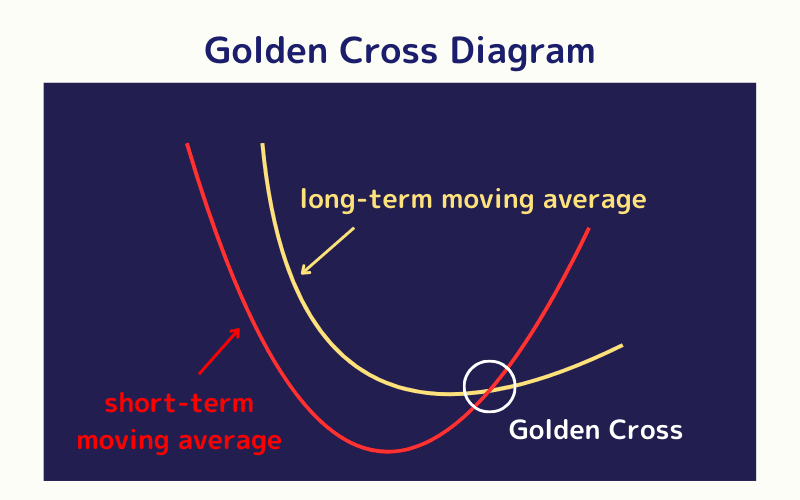
A Golden Cross is a bullish signal in technical analysis where a short-term moving average crosses above a longer-term one, suggesting a possible shift to an uptrend.
The Golden Cross is a widely recognized buy signal in technical analysis, occurring when a short-term moving average crosses above a medium- or long-term moving average, often indicating the start of an upward trend.
This article explores the Golden Cross’s definition, calculation, typical patterns, and trading signals. It compares the Golden Cross with the Death Cross, discusses practical applications, and highlights precautions for traders. Additionally, it introduces Titan FX’s professional moving average tools to help traders accurately identify market trends and improve success rates across stocks, forex, and commodities.
- What it is: a buy signal where a short-term MA crosses above a longer-term MA
- Mechanism: short-term momentum overtakes the longer term, hinting at an uptrend
- Common periods: pairs such as 5/25 or 25/75 (short vs longer MA)
- How to use: combine with volume, RSI, or MACD to cut false signals
- Caveats: it works poorly in ranges and lags, since MAs are trailing
1. What is a Golden Cross
1-1. General Meaning of the Golden Cross
The Golden Cross occurs when a short-term moving average (e.g., 5-day) crosses above a medium- or long-term moving average (e.g., 20-day, 25-day, or 75-day).
This event, where short-term price momentum surpasses the longer-term trend, is often seen as a signal that an upward trend may be emerging. It is widely used in stocks, forex, cryptocurrencies, and other markets.
Similar crossover patterns appear in other technical indicators, such as MACD or Stochastic Oscillator, and may also be referred to as a “Golden Cross.”
1-2. Common Golden Cross Combinations
Common moving average combinations for the Golden Cross vary by time frame:
| Short-Term | Medium-Term | Long-Term |
|---|---|---|
| 5-day | 20-day, 25-day | 75-day, 100-day, 200-day |
| 9-week | 13-week, 26-week | 52-week |
| 12-month | 24-month | 60-month, 120-month |
On daily charts, popular combinations include the 5-day vs. 20-day or 25-day vs. 75-day moving averages. On weekly charts, the 13-week vs. 26-week combination is often used to analyze medium- to long-term trends.
Traders can select combinations based on their trading style (short-term, medium-term, or long-term) and market conditions.
1-3. Golden Cross Calculation
On charting platforms, the Golden Cross is visually represented when a short-term moving average crosses above a medium- or long-term moving average.
For precise confirmation, the Golden Cross can be identified by comparing moving average values. On a daily chart, it requires the following conditions:
- ① Current Day: Short-term moving average > Medium- or long-term moving average
- ② Previous Day: Short-term moving average < Medium- or long-term moving average
These conditions indicate that the short-term moving average, previously below, has crossed above the medium- or long-term moving average. The date when both conditions are met is considered the Golden Cross formation day.
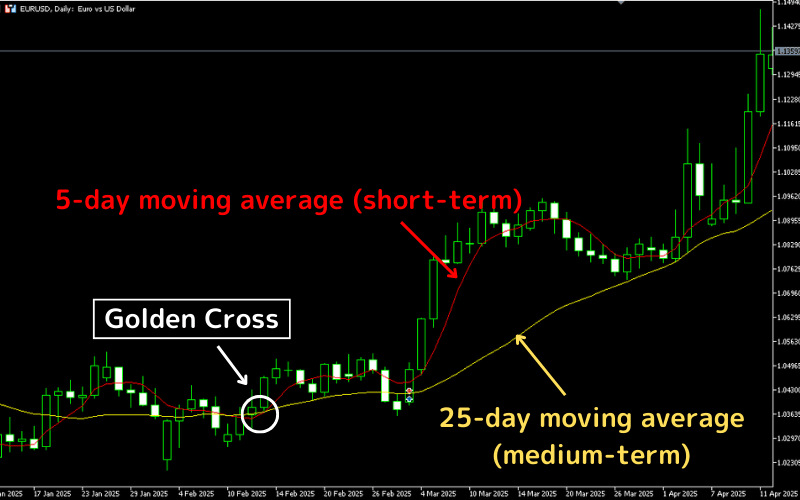
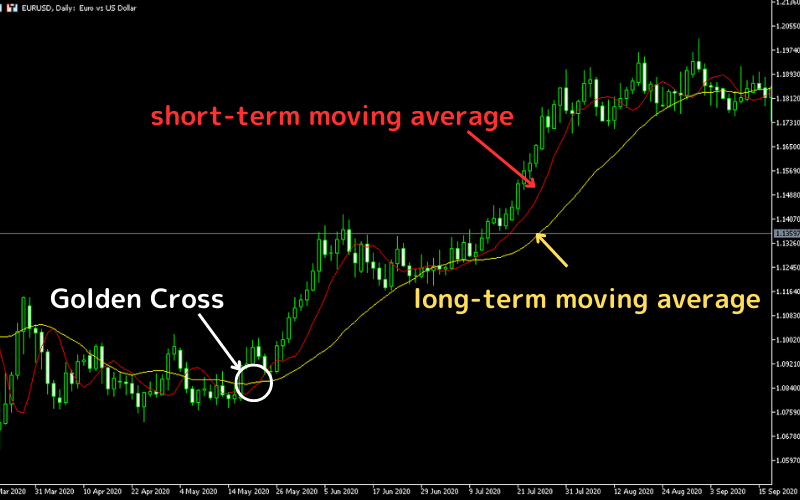
1-4. Golden Cross Chart Example
Consider a daily chart of EUR/USD:
- Red Line: 5-day moving average (short-term)
- Yellow Line: 25-day moving average (medium-term)
After a period of consolidation, the 5-day moving average rises and crosses above the 25-day moving average, forming a Golden Cross. Following this crossover, the price exhibits a clear upward trend, demonstrating the Golden Cross as a typical buy signal.
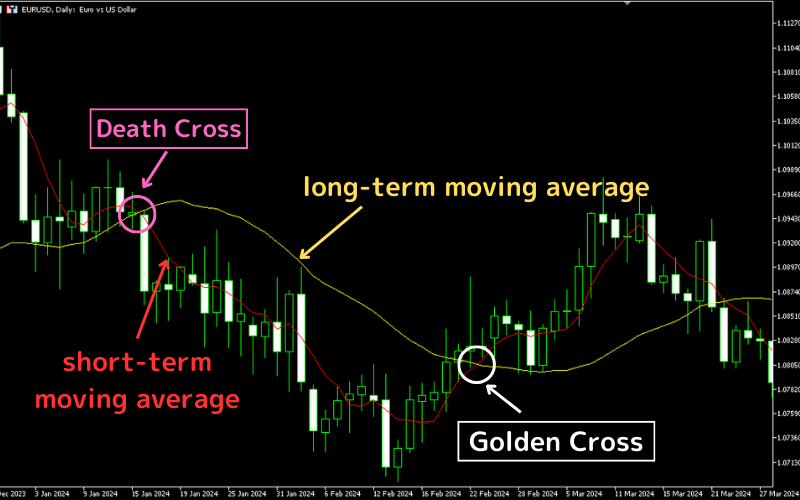
2. Golden Cross vs. Death Cross
The Golden Cross and Death Cross are two critical signals in moving average analysis, distinguished by the direction of the crossover between short-term and medium- or long-term moving averages. They signal potential bullish or bearish trends, respectively.
The table below summarizes their key differences:
Golden Cross vs. Death Cross Comparison
| Golden Cross | Death Cross |
|---|---|
| Short-term moving average crosses above medium- or long-term moving average | Short-term moving average crosses below medium- or long-term moving average |
| Signals potential start of an upward trend | Signals potential start of a downward trend |
| Reflects strong buying momentum and bullish sentiment | Reflects increasing selling pressure and bearish sentiment |
| Consider entering long positions or increasing holdings | Consider selling, reducing positions, or hedging |
| Applicable to stocks, forex, cryptocurrencies, and other assets | Applicable to stocks, forex, cryptocurrencies, and other assets |
The following section illustrates the typical patterns of the Golden Cross and Death Cross for clearer understanding.
3. Golden Cross Patterns and Buy Signals
The Golden Cross generates buy signals in two primary patterns:
- Buy Signal 1: Standard Golden Cross
- Buy Signal 2: Sustained Golden Cross (Perfect Alignment)
Buy Signal 1: Standard Golden Cross
In this pattern, the medium- or long-term moving average is flat or slightly rising, and the short-term moving average crosses above it, with the price (candlestick) positioned above both moving averages.
This is the classic Golden Cross, often interpreted as a strong signal that the trend is turning bullish, prompting traders to consider entering long positions.
Buy Signal 2: Sustained Golden Cross (Perfect Alignment)
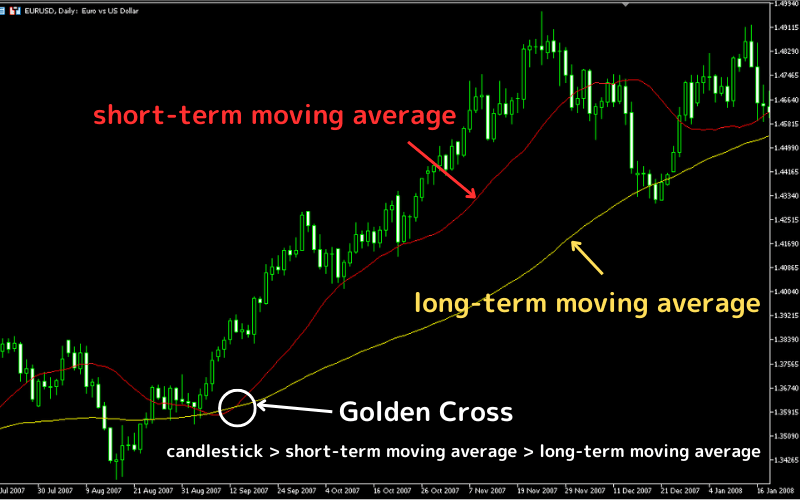
In this pattern, the price aligns as Candlestick > Short-term moving average > Medium- or long-term moving average, with all three trending upward.
Known as a “Perfect Alignment” or “Bullish Alignment,” this indicates sustained bullish momentum, making it an ideal time to hold or add to long positions.
4. Practical Applications and Trading Strategies
The application of the Golden Cross varies by market, time frame, and trading style. Below are common and effective strategies to help traders seize market opportunities flexibly.
4-1. Combining Different Moving Average Types
Pairing SMA and EMA
- SMA (Simple Moving Average) reflects the overall trend, while EMA (Exponential Moving Average) reacts faster to recent price changes.
- For short-term trading, a “5-day EMA crossing above a 20-day SMA” can quickly capture Golden Cross signals.
Multiple Moving Average Combinations
- Monitor moving averages across different periods, such as 5-day, 20-day, and 60-day.
- When the short-term moving average crosses above the medium- or long-term moving average first, it can serve as an early entry signal.
Learn more: How to Choose the Optimal Period Parameters
4-2. Confirming Trends with Other Technical Indicators
RSI (Relative Strength Index)
When a Golden Cross occurs, an RSI value between 50–70 indicates strong bullish momentum, enhancing the reliability of the buy signal.
MACD
If the MACD line crosses above the signal line (DIF crossing DEA) alongside a Golden Cross, the trend confirmation is stronger.
Bollinger Bands
A Golden Cross accompanied by a price breakout above the Bollinger Bands middle band significantly increases the likelihood of an upward trend.
4-3. Tailoring Strategies to Market Characteristics
Stock Market
- Individual stocks, especially tech stocks, often trigger Golden Crosses due to earnings reports or industry news.
- Combine with volume analysis: Rising price and volume together strengthen the signal’s validity.
Forex Market
- Golden Crosses are common in major currency pairs like USD/JPY and EUR/USD.
- Validate signals with key economic data, such as Non-Farm Payrolls or CPI.
Commodities Market
- Commodities like gold and crude oil are heavily influenced by supply and demand fundamentals.
- The Golden Cross can serve as a supplementary reference for medium- to long-term trend entries.
5. Leveraging Titan FX’s Professional Indicator Tools
Titan FX offers a suite of customized moving average tools to help traders effectively capture Golden Cross and Death Cross signals, confirm trend strength, and monitor bullish alignments, enhancing overall trading efficiency.
Below is an overview of these indicators:
Titan FX MA Cross Indicator
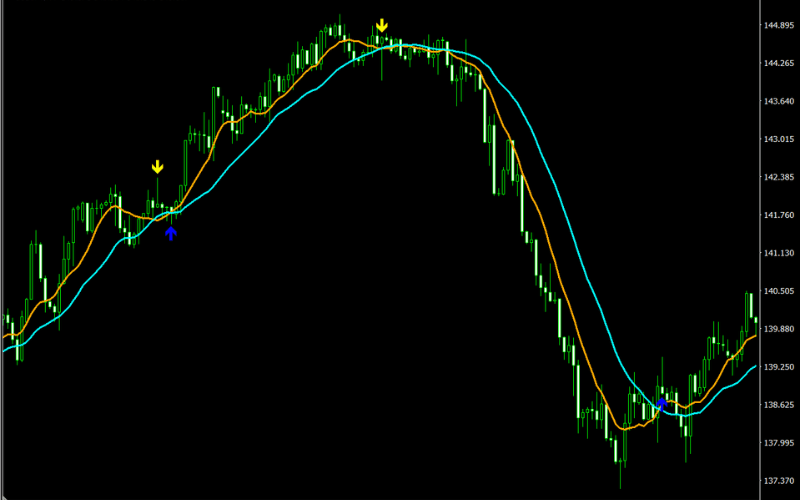
Automatically detects crossovers between short- and long-term moving averages, instantly marking Golden Cross or Death Cross signals to help traders seize entry and exit opportunities.
Learn more about the Titan FX MA Cross Indicator and installation
Titan FX GMMA Multi-Moving Average Indicator
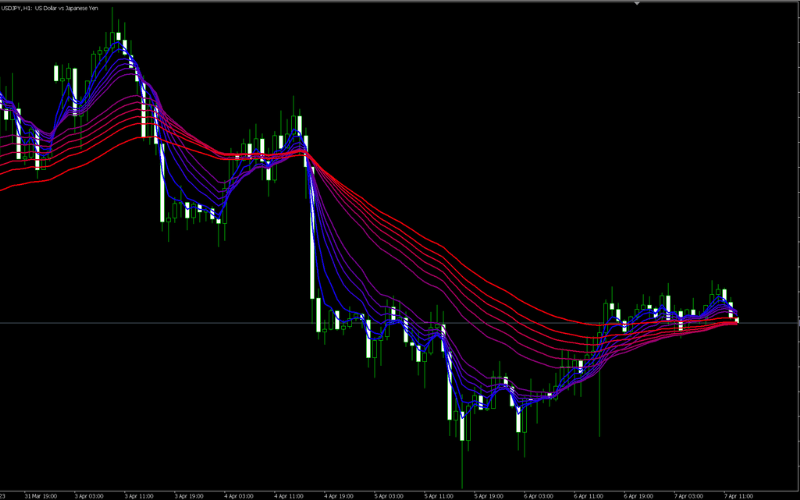
Integrates multiple short- and long-term moving averages (based on GMMA theory) to assess trend strength and changes, ideal for tracking trend continuation or spotting early reversal signals.
Learn more about the Titan FX GMMA Indicator and installation
Titan FX Perfect Order Monitor
Automatically identifies the “candlestick > short-term moving average > medium- or long-term moving average” sequence, known as a “Perfect Order.” This is ideal for holding or adding to positions in strong bullish trends for swing trading.
Learn more about the Titan FX Perfect Order Monitor and installation
Titan FX MA Trend Indicator
Displays the strength and direction of trends across multiple moving averages, enabling traders to intuitively assess trend momentum and avoid misjudgments based solely on crossover signals, improving trading success rates.
Learn more about the Titan FX MA Trend Indicator and installation
Titan FX Trend Analysis Tool
Combines multiple technical indicators to analyze overall market trend direction, helping traders determine bullish or bearish dominance. It serves as a valuable reference when a Golden Cross appears.
Learn more about the Titan FX Trend Analysis Tool
6. Precautions When Using the Golden Cross
While the Golden Cross is a powerful signal, it has limitations. Below are three key precautions:
- Beware of False Signals (False Breakouts)
- Account for Lagging Nature
- Watch for Range-Bound Markets
Precaution 1: False Signals (False Breakouts)
A Golden Cross does not guarantee a price increase, especially with short-term moving average combinations (e.g., 5-day and 10-day), where false breakouts are more common.
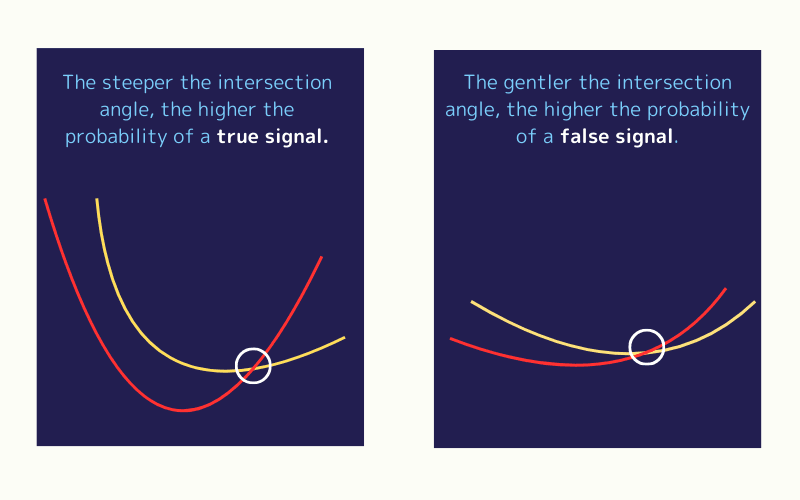
Recommendations:
- Observe the crossover angle: Steeper angles indicate stronger signals, while shallow angles warrant caution.
- Monitor volume: Rising volume alongside the crossover increases signal reliability.
Precaution 2: Lagging Nature
Moving averages are lagging indicators, and Golden Crosses often appear after a trend has begun, particularly with long-term moving averages (e.g., 200-day).
Recommendations:
- Short-term traders can focus on 5-day or 10-day moving averages to capture earlier signals.
- Pair with real-time indicators like KDJ to refine entry timing.
Precaution 3: Range-Bound Markets
In range-bound (consolidation) markets, the Golden Cross’s effectiveness diminishes, increasing the risk of false breakouts.
Recommendations:
- Use RSI or Bollinger Bands to confirm whether the market is in a consolidation phase.
- Wait for a price breakout above key resistance levels (e.g., previous highs) before entering.
7. Golden Cross FAQ
Q1: Does a Golden Cross always lead to a price increase?
Not necessarily. The Golden Cross signals a potential trend strengthening, but it can fail in range-bound or false breakout scenarios. Combine with other technical indicators for confirmation.
Q2: Which markets are suitable for the Golden Cross?
The Golden Cross is versatile across markets, performing best in trending environments.
8. Summary
The Golden Cross is a simple yet powerful tool in technical analysis.
When a short-term moving average crosses above a medium- or long-term moving average, it often signals the start of an upward trend. However, the Golden Cross is not foolproof—false signals, lagging nature, and range-bound markets can reduce its effectiveness.
To improve decision-making accuracy, combine it with volume analysis, RSI, MACD, or other indicators and consider market characteristics.
Leveraging Titan FX’s customized moving average tools can further help identify valid signals and strong trends.
Further Reading
- What Is a Death Cross?
- What Is a Moving Average?
- Exponential Moving Average (EMA)
- What Is MACD?
- Granville's 8 Rules
Titan FX Trading Strategy Lab. We produce educational content for investors across forex, precious metals, energy, indices, US stocks, and crypto, covering technical analysis and how markets work.
Primary Sources (by Category)
- Educational & research: Investopedia, CMT Association
- Market & data: Bloomberg, Reuters, and TradingView chart analysis and commentary