Stochastic Oscillator: Definition, Setup, and Trading Tips

The Stochastic Oscillator is an oscillator-type technical indicator that measures where the closing price sits within its recent high–low range to gauge overbought and oversold conditions, using crossovers of its %K and %D lines to flag potential reversals.
This article provides a detailed explanation of its calculation formulas, setup methods, interpretation techniques, and practical applications.
- Definition: measures where the close sits in its recent high–low range to gauge overbought/oversold
- Two types: Fast and Slow; the Slow version gives fewer false signals and is more common
- Core signals: %K/%D golden cross (buy), death cross (sell), and divergence
- Value range: typically above 80 is overbought, below 20 is oversold
- How to use: best in ranges; prone to false signals in trends, so pair with MACD/MAs
- 1. What is the Stochastic Oscillator?
- 2. Types and Calculation of the Stochastic Oscillator
- 3. How to Interpret and Use the Stochastic Oscillator
- 4. Precautions When Using the Stochastic Oscillator
- 5. Setting Up the Stochastic Oscillator on MT4/MT5
- 6. Titan FX Customized Stochastic Oscillator
- 7. FAQs About the Stochastic Oscillator
- 8. Conclusion
1. What is the Stochastic Oscillator?
The Stochastic Oscillator is a momentum indicator designed to identify overbought or oversold market conditions and potential reversal points.
Developed by George Lane, a prominent chart analyst, in the late 1950s, it remains a widely used tool in technical analysis.
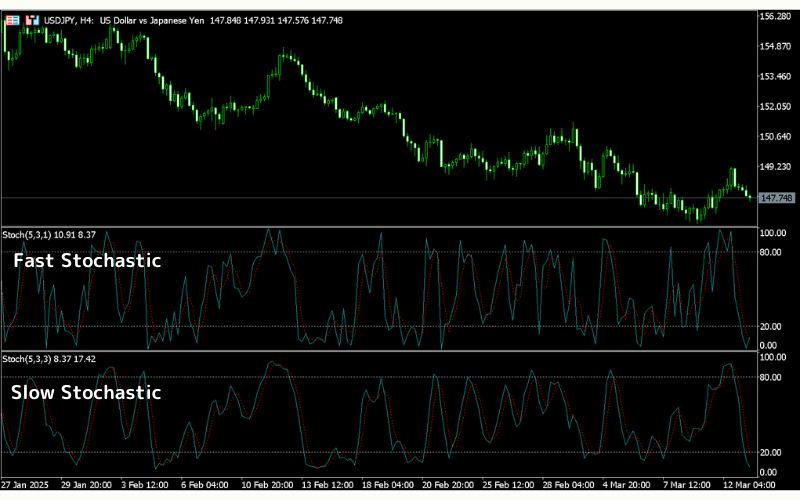
It comes in two main variants:
- Fast Stochastic Oscillator
- Slow Stochastic Oscillator
Trading platforms like MT4 and MT5 typically offer the Slow Stochastic by default. To use the Fast Stochastic, adjust the Slowing parameter (called "Slowing" in MT4/5) to 1. This makes the indicator more sensitive to price changes, ideal for short-term traders.
Both types are displayed as two lines on a chart, oscillating between 0% and 100%.
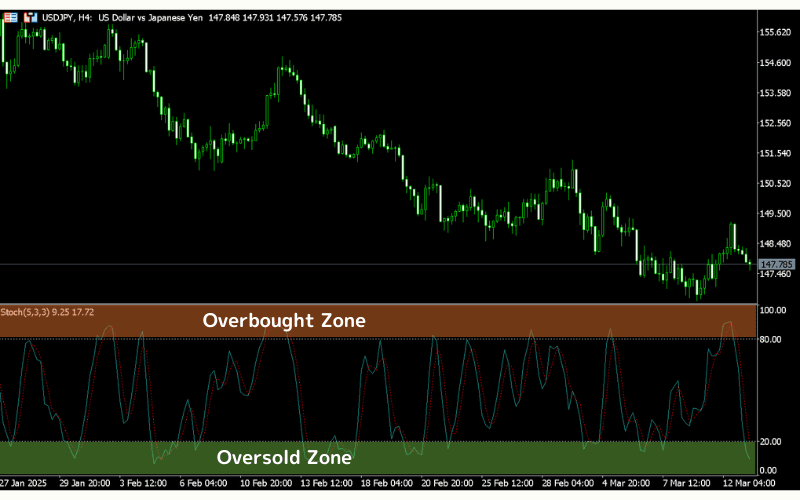
Value Range
The Stochastic Oscillator ranges from 0% to 100%, with specific thresholds indicating market conditions:
- 80%–100%: Overbought
- 0%–20%: Oversold
Inventor
George Lane, an American analyst, created the Stochastic Oscillator while working in investment education. His work has since become foundational in technical analysis.
2. Types and Calculation of the Stochastic Oscillator
The Stochastic Oscillator has two variants, each with distinct characteristics:
| Type | Components | Market Sensitivity |
|---|---|---|
| Fast Stochastic | %K and %D lines | Highly sensitive |
| Slow Stochastic | %D and SD lines | Smoother, less reactive |
Fast Stochastic Oscillator
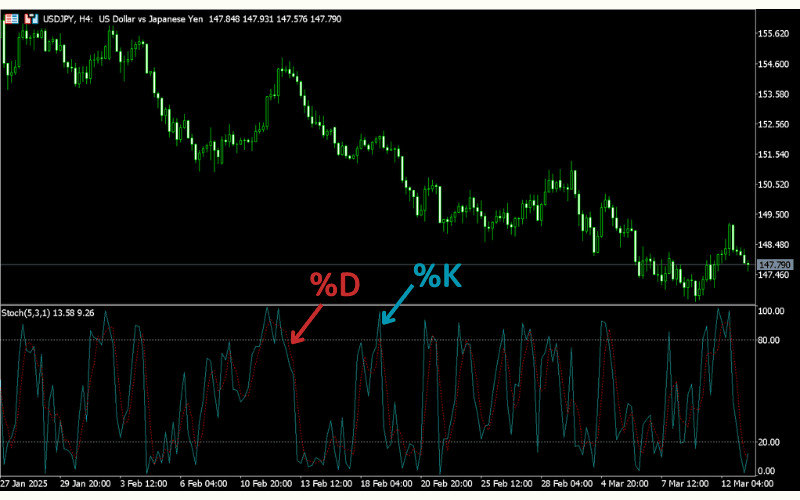
The Fast Stochastic consists of:
- %K Line: Represents the current price relative to a defined range.
- %D Line: A moving average of the %K line over n periods.
Calculation Formulas
- %K = [(Current Close - Lowest Low in n Periods) ÷ (Highest High in n Periods - Lowest Low in n Periods)] × 100
- %D = (m-Day Sum of (Current Close - Lowest Low)) ÷ (m-Day Sum of (Highest High - Lowest Low)) × 100
The %K line measures where the current price stands within a specified period’s range. For example:
- 95%: Price is near the period’s high.
- 5%: Price is near the period’s low.
- 50%: Price is at the midpoint.
The %D line smooths %K with a moving average, but the Fast Stochastic remains highly reactive, making it prone to false signals.
Slow Stochastic Oscillator
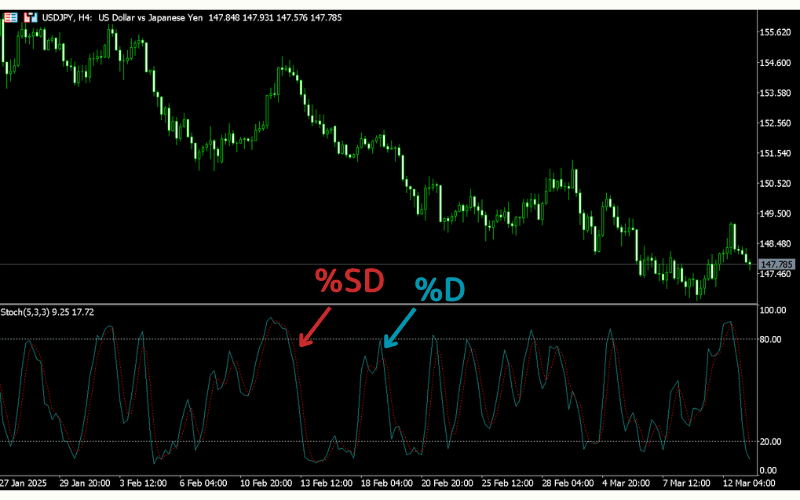
The Slow Stochastic includes:
- %D Line: A moving average of %K.
- SD Line: A moving average of %D.
Calculation Formulas
- %D = (m-Day Sum of (Current Close - Lowest Low)) ÷ (m-Day Sum of (Highest High - Lowest Low)) × 100
- SD = n-Day Moving Average of %D
The Slow Stochastic reacts more gradually to price changes, reducing noise and false signals. It’s the more commonly used variant among traders.
3. How to Interpret and Use the Stochastic Oscillator
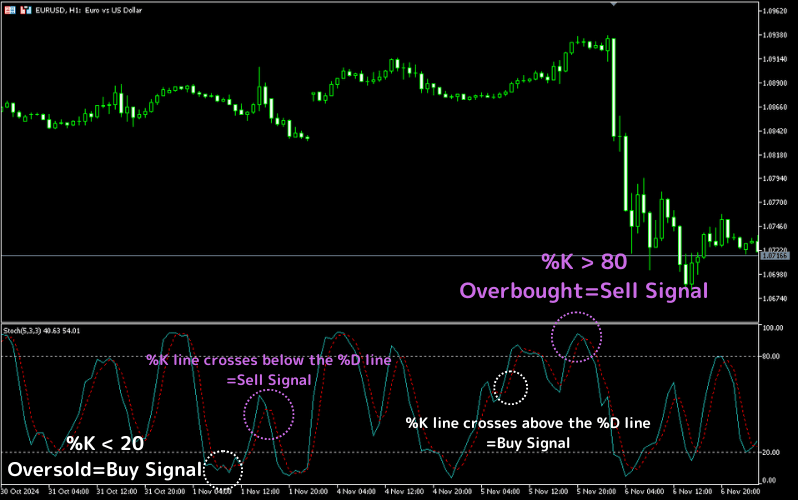
Key Thresholds
- Overbought: Both lines above 80%.
- Oversold: Both lines below 20%.
Crossovers in these zones signal potential trades:
- Death Cross (sell signal) in the overbought zone.
- Golden Cross (buy signal) in the oversold zone.
Buy Signal (Golden Cross)
| Type | Crossover Event |
|---|---|
| Fast Stochastic | %K crosses above %D from below |
| Slow Stochastic | %D crosses above SD from below |
A Golden Cross in the oversold region suggests a potential price increase, often occurring when downward momentum weakens. However, it’s not a guaranteed uptrend signal.
Sell Signal (Death Cross)
| Type | Crossover Event |
|---|---|
| Fast Stochastic | %K crosses below %D from above |
| Slow Stochastic | %D crosses below SD from above |
A Death Cross in the overbought region indicates a possible price decline, typically when upward momentum fades. Like the Golden Cross, it’s not foolproof.
Divergence
Divergence occurs when price and the Stochastic move in opposite directions (e.g., price hits a new low, but the indicator forms a higher low). This can signal a trend reversal, suggesting weakening momentum. However, in strong trends, false positives may persist, so use it cautiously as a guide for profit-taking or avoiding trades.
4. Precautions When Using the Stochastic Oscillator
When using the Stochastic Oscillator, one major concern is false signals—instances where a buy or sell signal appears, but the price moves in the opposite direction. To mitigate this, you can combine it with other technical indicators or opt for the Slow Stochastic. Below, we’ll explore these strategies in detail.
Combining Stochastic Oscillator with MACD
Pairing the Stochastic Oscillator with the MACD (Moving Average Convergence Divergence) is an effective way to filter out false signals. Here’s an example of this trading strategy:
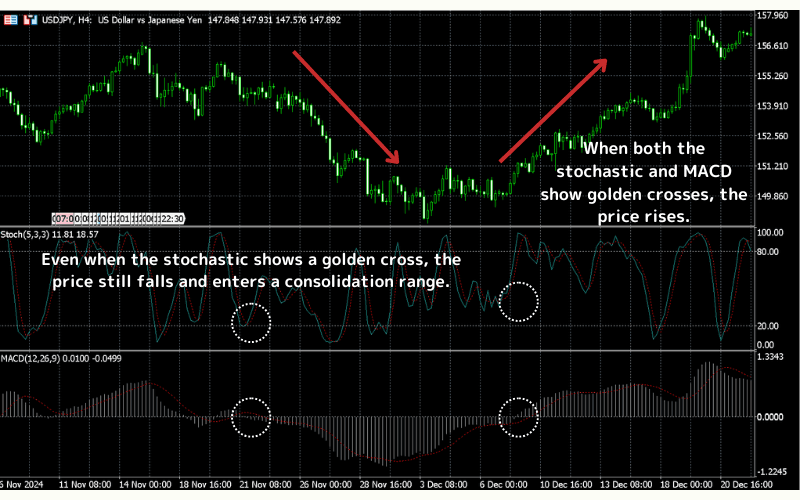
In a chart, if the Stochastic Oscillator shows a Golden Cross (buy signal), relying solely on it might lead to a stop-loss trigger if the price drops. However, checking the MACD at the same time could reveal that MACD hasn’t formed a Golden Cross and instead indicates a strong downtrend.
Later, when both the Stochastic Oscillator and MACD display a Golden Cross simultaneously, the price begins to rise. Combining these two indicators enhances signal accuracy and significantly reduces the frequency of false signals, though they can’t be eliminated entirely.
For more details, see: MACD Basics
Slow Stochastic Oscillator Generates Fewer False Signals
The Fast Stochastic Oscillator reacts quickly to price fluctuations, making it more susceptible to false signals. In contrast, the Slow Stochastic Oscillator smooths out price movements, reducing overreactions and thus lowering the likelihood of false signals.
While the Slow Stochastic is less responsive to early market shifts, it provides more reliable signals once a trend is established.
5. Setting Up the Stochastic Oscillator on MT4/MT5
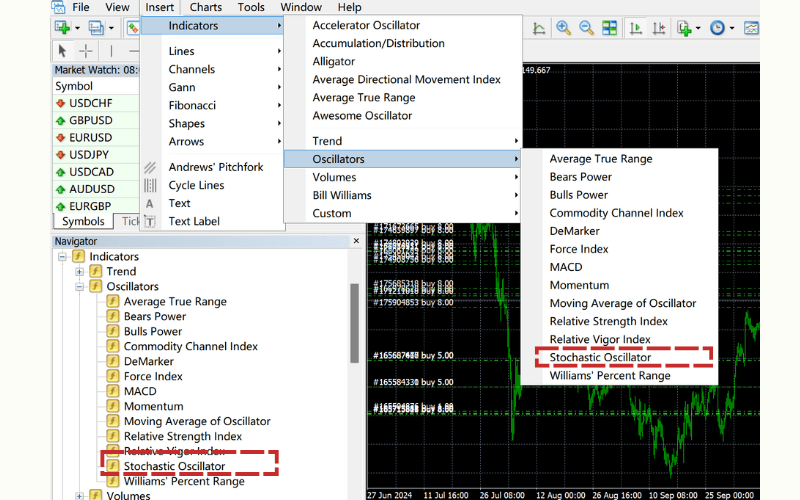
Adding the Stochastic Oscillator in MT4
① Log in to MT4
② Open the chart for the trading instrument
③ Click on "Insert" in the menu bar → "Indicators" → "Oscillators" → "Stochastic Oscillator"; or click on "Navigator" → "Indicators" → "Oscillators" → "Stochastic Oscillator".
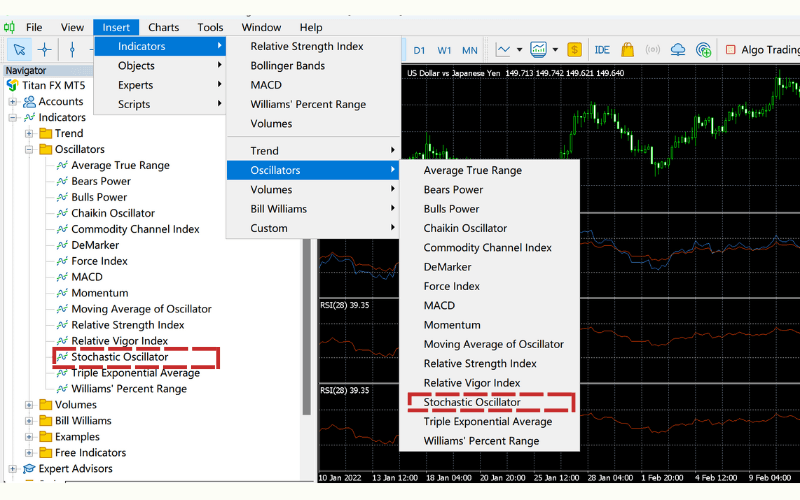
Adding the Stochastic Oscillator in MT5
① Log in to MT5
② Open the chart for the trading instrument
③ Click on "Insert" in the menu bar → "Indicators" → "Oscillators" → "Stochastic Oscillator"; or click on "Navigator" → "Indicators" → "Oscillators" → "Stochastic Oscillator".
6. Titan FX Customized Stochastic Oscillator
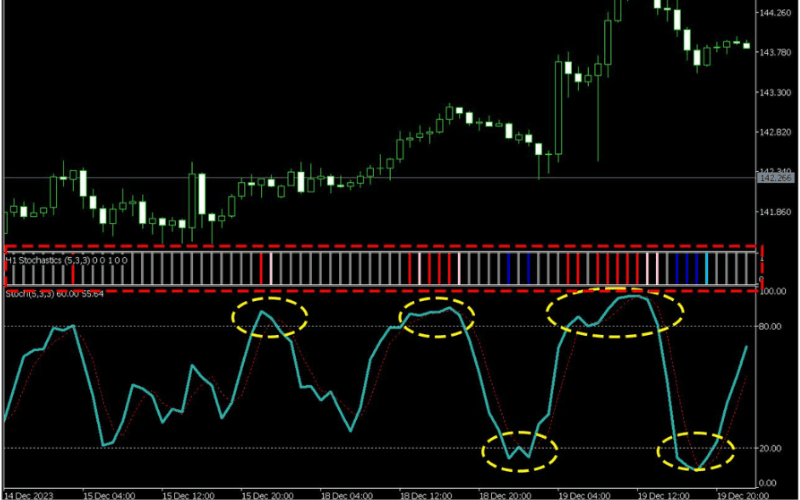
This custom indicator displays the Stochastic Oscillator’s status on a sub-chart. It supports multiple oscillators like RSI, CCI, and Psychological Line, with a multi-timeframe feature that lets you view longer periods than the current chart. You can overlay several indicators to observe short- and long-term trends simultaneously.
Oscillator Checker: Monitor 4 Oscillator Types
7. FAQs About the Stochastic Oscillator
Q1. How Does the Stochastic Oscillator Differ from RSI?
The key differences between the Stochastic Oscillator and RSI (Relative Strength Index) lie in their ranges and signal frequency:
- RSI: Typically stays between 30% and 70%.
- Stochastic Oscillator: Frequently moves beyond 30%–70%.
Additionally, the Stochastic generates Golden and Death Crosses more often, while RSI signals are more stable.
Q2. How Can I Address the Stochastic Oscillator’s Weaknesses?
The Stochastic Oscillator struggles in trending markets, where its lines may tangle near the top or bottom of the chart, making it hard to rely on for decisions. This often leads to false Golden or Death Crosses.
To overcome this, pair it with complementary indicators like Moving Averages or Bollinger Bands to confirm trends and filter signals.
8. Conclusion
The Stochastic Oscillator is a powerful tool for gauging market overbought or oversold conditions, available in Fast and Slow variants. The Slow Stochastic is recommended to minimize false signals.
However, it underperforms in trending markets, so combining it with other technical indicators is key to improving reliability and building robust trading strategies.
Further Reading
Titan FX Research Team — investor-education content across forex, commodities (oil, precious metals, agriculture), stock indices, U.S. equities, and crypto assets.
Primary Sources (by Category)
- Theory / inventor: George C. Lane — Stochastic Oscillator (developed in the late 1950s)
- Education: Investopedia — Stochastic Oscillator
- Platform: Titan FX — MT4/MT5 technical indicator setup