Bollinger Bands Complete Guide: Principles, Standard Deviation, Formula, Pros & Cons and MT4/MT5 Plotting
Bollinger Bands is a technical indicator created by the renowned American technical analysis expert John Bollinger. It is widely used to observe market volatility and price action, helping traders intuitively gauge market conditions. The indicator is built around a Simple Moving Average (SMA), with an upper and lower band plotted above and below based on standard deviation to visualise the range of price fluctuation.
- 1. What Are Bollinger Bands?
- 2. Components and Calculation Formula
- 3. How to Read Bollinger Bands: 4 Practical Techniques
- 4. Advantages: Why Traders Love Bollinger Bands
- 5. Limitations: What to Watch Out For
- 6. How to Plot Bollinger Bands (MT4/MT5)
- 7. Bollinger Bands FAQ
- 8. Free Custom Indicators from Titan FX (MT4/MT5)
- 9. Summary
1. What Are Bollinger Bands?
Bollinger Bands, also known as Bollinger channels or Bollinger lines, is a technical analysis tool introduced by financial analyst John Bollinger in the 1980s. Its main purpose is to measure market volatility and help traders identify potential trading opportunities.
By combining a Simple Moving Average (SMA) with standard deviation, Bollinger Bands define the range of price fluctuation and indicate whether the market is overbought or oversold.
2. Components and Calculation Formula
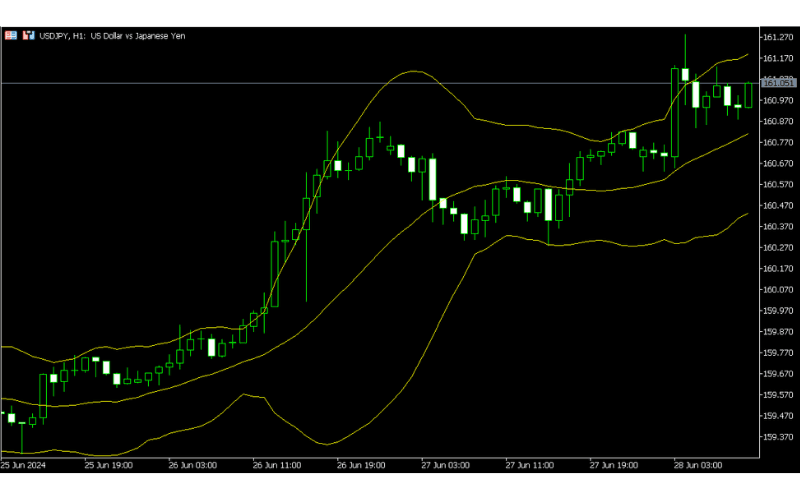
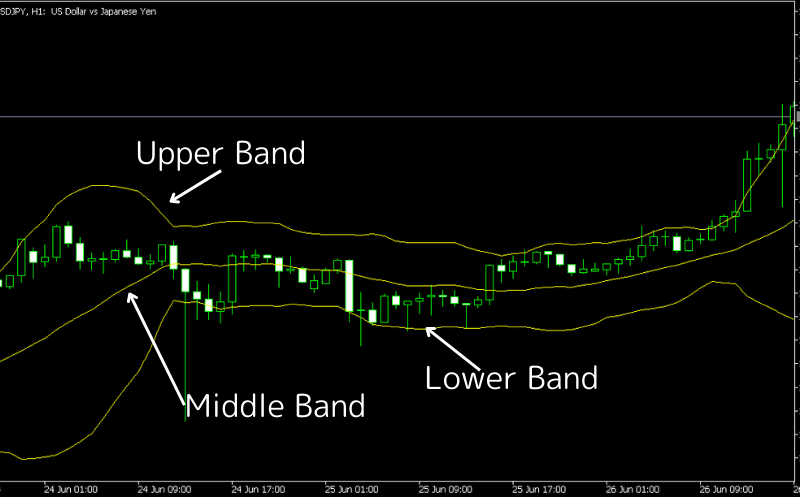
Bollinger Bands consist of three main lines: the middle band, the upper band, and the lower band. By combining a moving average with price volatility, they dynamically reflect market changes.
Components of Bollinger Bands
| Item | Description |
|---|---|
| Middle Band | Simple Moving Average (SMA), typically with a 20-period setting. |
| Upper Band | Middle band plus a certain multiple of standard deviations, commonly 2. |
| Lower Band | Middle band minus a certain multiple of standard deviations, commonly 2. |
| Band Width | (Upper Band − Lower Band) ÷ Middle Band, which reflects the magnitude of volatility. |
Default Parameters and Formulas
| Item | Formula |
|---|---|
| Middle Band | 20-day Simple Moving Average (20SMA) |
| Upper Band | Middle Band + 2 × Standard Deviation (σ) |
| Lower Band | Middle Band − 2 × Standard Deviation (σ) |
| Band Width | (Upper Band − Lower Band) ÷ Middle Band |
What Is Standard Deviation (σ)?
Standard deviation is a key statistical measure that quantifies the dispersion of a dataset. Specifically, it reflects how far data points deviate from the mean.
In financial markets, standard deviation is used to measure price volatility. The larger the standard deviation, the more severe the price fluctuations; the smaller it is, the more stable the market.
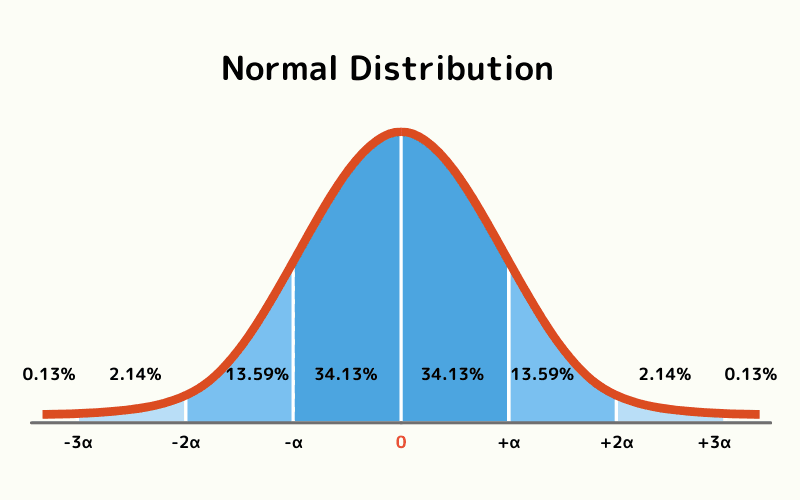
According to the normal distribution theory in statistics, data follow these characteristics:
| Multiple of σ | Percentage of Data Within the Range |
|---|---|
| ±1σ | About 68.2% of data falls within 1 standard deviation of the mean. |
| ±2σ | About 95.4% of data falls within 2 standard deviations of the mean. |
| ±3σ | About 99.8% of data falls within 3 standard deviations of the mean. |
What Is Normal Distribution?
Normal distribution, also known as the Gaussian distribution, is the most important probability distribution in statistics. It describes how data points are distributed in many natural and social phenomena. Its key features are:
| Feature | Description |
|---|---|
| Bell-shaped curve | The probability density function forms a symmetric bell-shaped curve, high in the middle and low on both ends. |
| Symmetry | The distribution is symmetric around the mean, so data are evenly distributed on both sides. |
| Mean, median, mode are equal | In a normal distribution, the mean, median and mode are all equal and sit at the centre of the distribution. |
| 68-95-99.7 rule | A defining feature of the normal distribution: · About 68.2% of data points fall within ±1 standard deviation of the mean. · About 95.4% of data points fall within ±2 standard deviations of the mean. · About 99.8% of data points fall within ±3 standard deviations of the mean. |
Example
Suppose test scores follow a normal distribution with a mean of 70 and a standard deviation of 10. Under the normal distribution:
- About 68.2% of students score between 60 and 80 (mean ± 1σ).
- About 95.4% of students score between 50 and 90 (mean ± 2σ).
- About 99.8% of students score between 40 and 100 (mean ± 3σ).
Normal distribution is widely used in statistics and financial market analysis. It is the foundation of many statistical tests and models. By understanding it, traders can better analyse market data and volatility.
How Bollinger Bands Are Calculated
Bollinger Bands are calculated as follows.
Step 1: Calculate the Standard Deviation
First, calculate the standard deviation (σ) of price data over a chosen period (typically 20 periods) relative to the moving average.
Step 2: Calculate the Upper and Lower Bands
On top of the Simple Moving Average (SMA), compute the upper and lower Bollinger Bands with the formulas below.
【Band formulas by σ multiple】
| Multiple of σ | Formula |
|---|---|
| ±1σ | Moving average ± Standard deviation |
| ±2σ | Moving average ± Standard deviation × 2 |
| ±3σ | Moving average ± Standard deviation × 3 |
In Bollinger Bands, standard deviation represents "the dispersion of the last n-period closing prices around the n-period Simple Moving Average (SMA)".
When closing prices move far away from the SMA, the standard deviation expands; when they hug the SMA, it contracts.
This behaviour is reflected in the widening or narrowing of the Bollinger Bands.
3. How to Read Bollinger Bands: 4 Practical Techniques
In real-world trading, understanding how Bollinger Bands change helps you keep pace with the market. Here are the four most common ways to read them:
- 3.1. Squeeze (contraction)
- 3.2. Expansion (widening)
- 3.3. Bulge (maximum width)
- 3.4. Band Walk (riding the band)
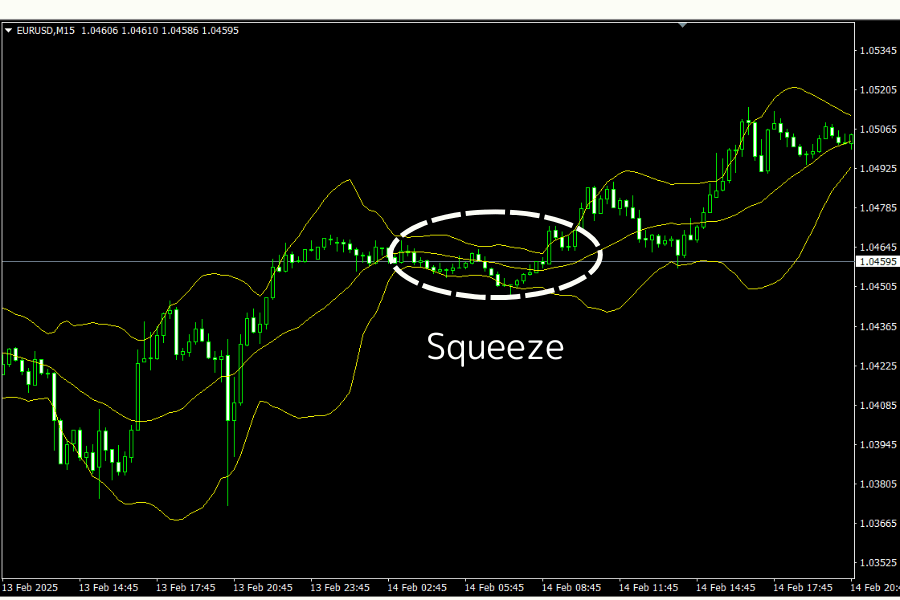
3.1. Squeeze
When Bollinger Bands narrow, market volatility is easing and prices are usually in a consolidation phase. This "quiet period" is often the calm before the storm, signalling that a big move may be approaching.
Watch closely for breakout signals at this stage: once price breaks out of the channel, a new trend frequently unfolds.
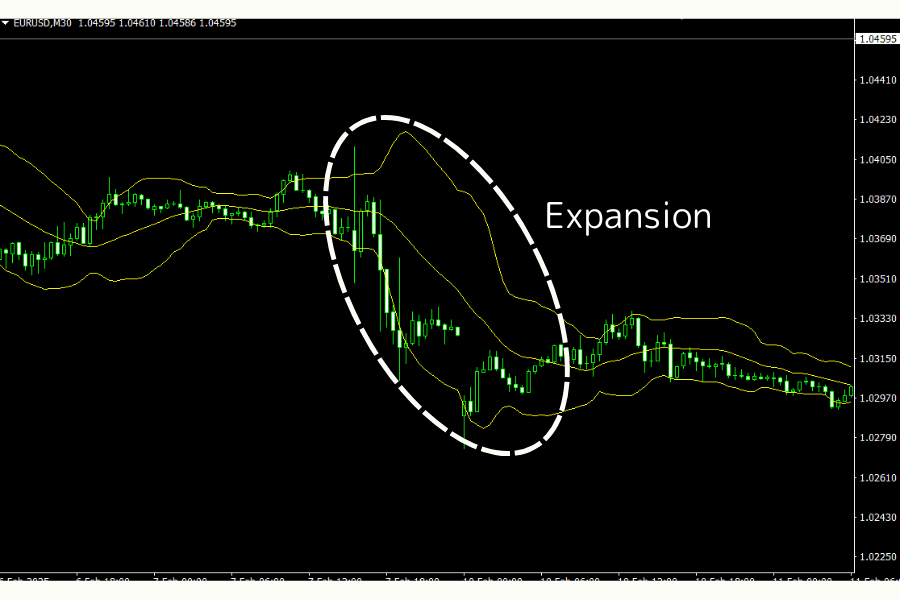
3.2. Expansion
When Bollinger Bands start to widen, volatility is rising and a trend may be forming. This is a good time for trend-following trades, especially when price breaks above the upper band or below the lower band, which typically marks the start of a new trend.
Expansion is also frequently seen right after major news releases or economic data.
3.3. Bulge (Maximum Band Width)
The "bulge" refers to the stage where Bollinger Bands reach their maximum width, which normally appears after a strong trend. At this point market sentiment may be overheated and volatility is about to cool down.
In other words, when Bollinger Bands start contracting from extreme expansion, it is often a precursor to trend exhaustion, a reversal, or a correction.
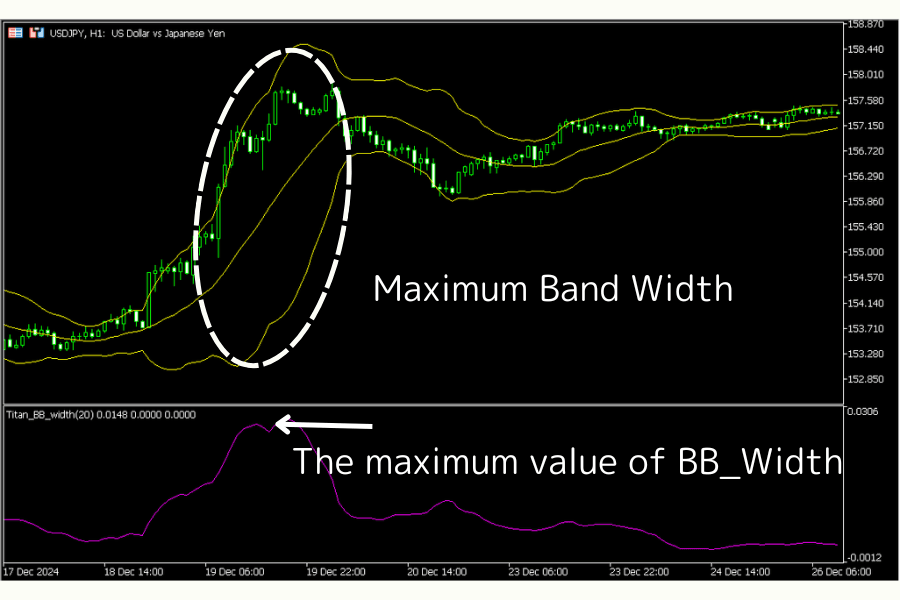
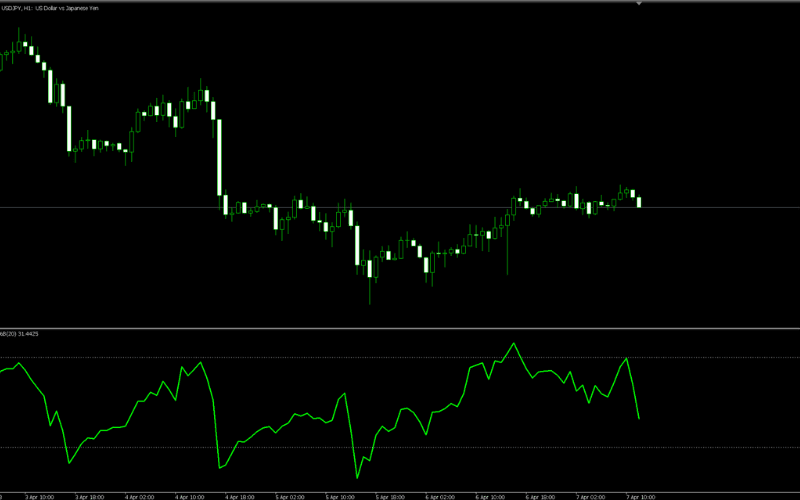
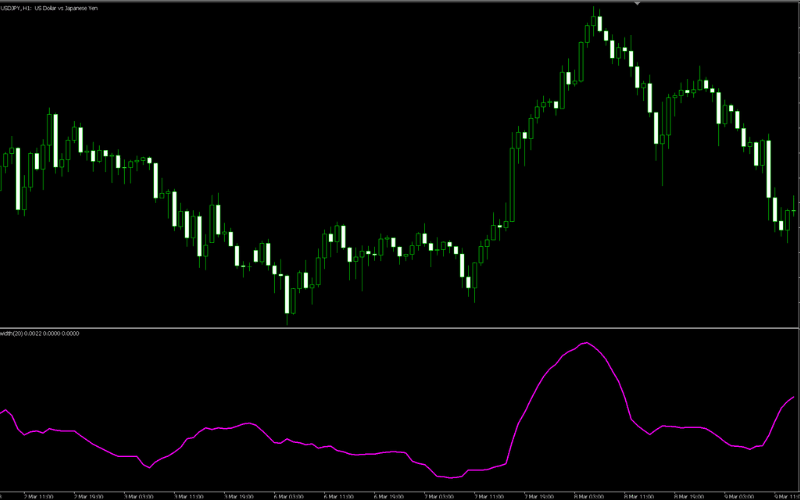
How to Identify the Bulge?
To judge the "bulge" more precisely, you can use the BB_Width indicator.
As shown above, the BB_Width indicator visualises the band width in a simple graph, so you can immediately see where the band width peaks during a given period — that is the "bulge".
※ Register a Titan FX account to download it for free and install it on Titan FX's MT4 or MT5.
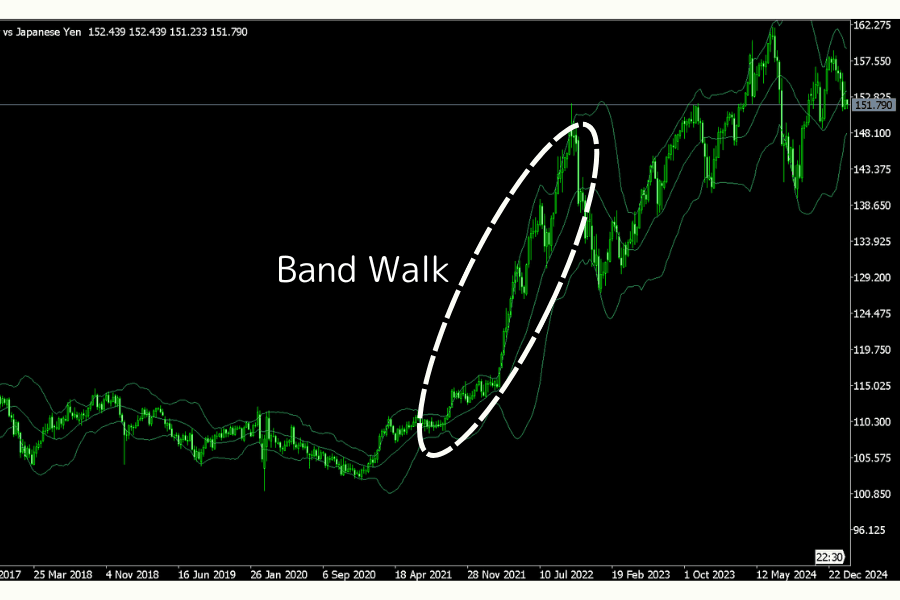
3.4. Band Walk
The "Band Walk" describes price action that hugs either the upper or lower Bollinger Band, commonly seen in strong one-sided markets. For example, if price consistently rides the upper band, bullish momentum is strong; if it rides the lower band, persistent downward pressure is likely.
In this situation, avoid trying to pick tops and bottoms. Instead, follow the trend and ride it to capture the main leg of the move.
Apply Bollinger Bands strategies with institutional-grade execution, zero-dealing-desk pricing, and raw spreads from 0.0 pips. Titan FX accounts can be opened quickly online.
4. Advantages: Why Traders Love Bollinger Bands
Bollinger Bands are a flexible and responsive technical indicator. Here are their main strengths:
Advantage 1: Dynamic Reflection of Market Volatility
Bollinger Bands automatically adjust the upper and lower bands based on market conditions, reflecting how dispersed price action currently is and letting traders gauge the market's activity in real time.
Advantage 2: Works Across Markets and Timeframes
Whether you trade forex, stocks or futures, Bollinger Bands are useful. They provide a stable technical reference for scalping on 1-minute charts all the way up to swing trading on daily or weekly charts.
Advantage 3: Helps Identify Overbought and Oversold Conditions
When price reaches the upper band, the market may be overheated or overbought; when it touches the lower band, it may be oversold. These signals can serve as supporting evidence for entries and exits.
Advantage 4: Useful for Spotting Trends and Reversals
Changes in band width reflect trend strength and potential reversal signals. When the channel narrows, a breakout may be brewing; when it expands, a trend may be continuing.
5. Limitations: What to Watch Out For
Bollinger Bands are powerful, but they also have shortcomings you should be aware of.
Limitation 1: False Signals in Sideways Markets
During consolidation, price often bounces repeatedly between the upper and lower bands, producing misleading overbought or oversold signals. It is therefore recommended to combine Bollinger Bands with other indicators such as RSI or MACD.
Limitation 2: Parameters Must Be Adjusted for Each Market
The default 20-period SMA and 2σ may not suit every market or trading style. Traders need to adapt parameters flexibly based on the instrument and timeframe.
Limitation 3: It Cannot Predict Trend Direction
Bollinger Bands measure volatility, not direction. They cannot tell you which way price will go, so they should not be used as a standalone trading signal — always combine them with other technical analysis tools.
Limitation 4: Slow Response to Sudden Events
Because Bollinger Bands are calculated from historical prices, they respond slowly to sudden events such as policy announcements or geopolitical shocks — by the time the bands adjust, price may have already moved significantly.
6. How to Plot Bollinger Bands (MT4/MT5)
Below is how to plot standard Bollinger Bands on the MT4 / MT5 platforms, plus how to configure a 3σ display.
How to Plot Bollinger Bands in MT4
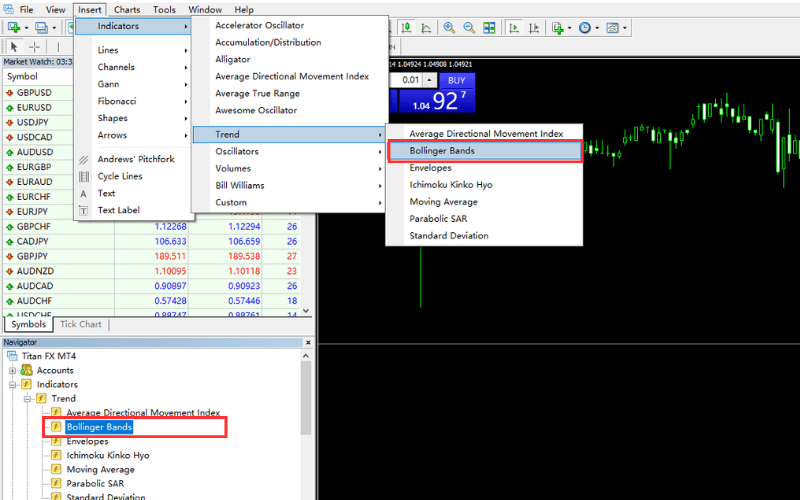
① Log in to MT4.
② Open the chart of your trading instrument.
③ From the menu bar, select "Insert" - "Indicators" - "Trend" - "Bollinger Bands"; or from the Navigator, select "Indicators" - "Trend" - "Bollinger Bands".
How to Plot Bollinger Bands in MT5
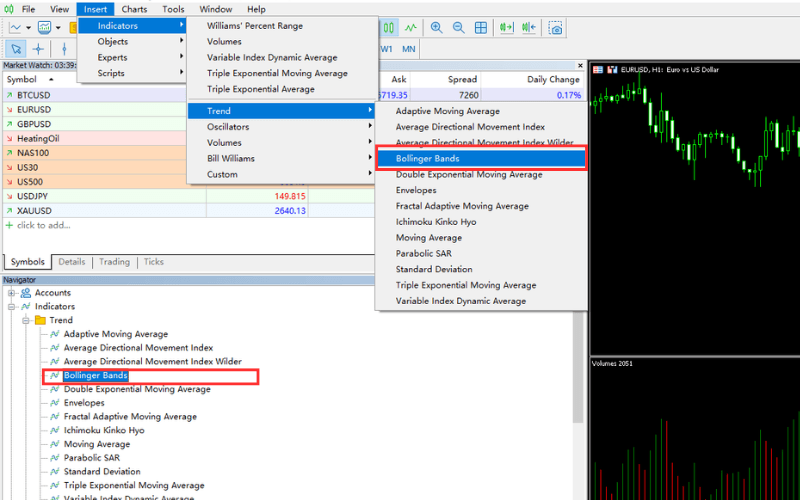
① Log in to MT5.
② Open the chart of your trading instrument.
③ From the menu bar, select "Insert" - "Indicators" - "Trend" - "Bollinger Bands"; or from the Navigator, select "Indicators" - "Trend" - "Bollinger Bands".
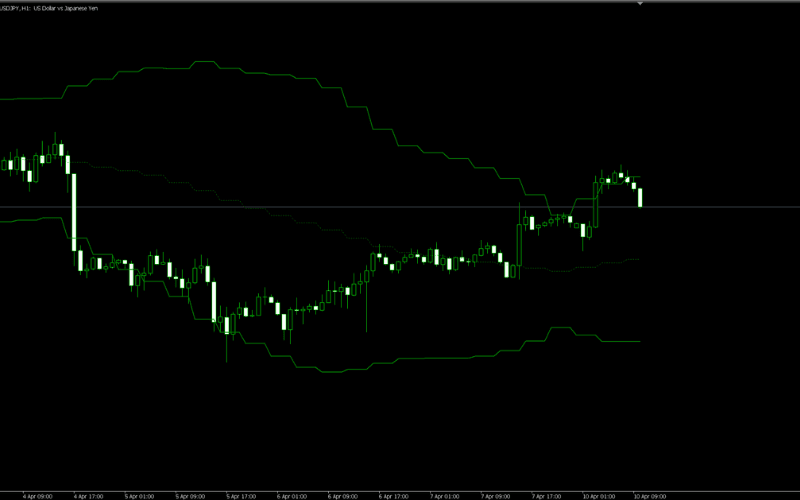
How to Display 3σ Bollinger Bands on an MT4/MT5 Chart
When you want to show 3σ standard deviation levels on the chart, you can plot three sets of Bollinger Bands at the same time.
By applying three sets of Bollinger Bands with standard deviations set to 1σ, 2σ, and 3σ respectively, you can display a complete 3σ Bollinger Bands view as shown in the chart above.
Setup steps:
| Step | Action |
|---|---|
| 1 | Right-click the chart and select "Indicators List". |
| 2 | In the indicator list, select the Bollinger Bands instance you want to modify. |
| 3 | Click "Edit" to open the settings. |
| 4 | Under "Deviations", set the value to 1.000 (1σ), 2.000 (2σ), or 3.000 (3σ) as needed. |
| 5 | Click "Style" to adjust colour and line thickness. |
| 6 | Click "OK" to save the settings and return to the chart. |
7. Bollinger Bands FAQ
Q1: Why is the "three-line" model with the middle band and ±2σ recommended?
John Bollinger, the creator of the indicator, recommended ±2σ based on the "68-95-99.7 rule" in statistics: roughly 95% of price movements fall within the ±2σ range. This setting captures the bulk of normal market volatility and helps avoid a flood of false signals.
When price breaks outside this range, the market may be entering a phase of heightened volatility — potentially the start of a trend or a reversal signal — which is worth watching.
Some variations of Bollinger Bands also plot ±1σ alongside ±2σ, showing five lines in total to observe different magnitudes of volatility.
Q2: What is the difference between ±1σ, ±2σ, and ±3σ?
The three settings differ mainly in the "range of price movement" they cover:
- ±1σ: Captures about 68.2% of price movements, useful for observing day-to-day volatility.
- ±2σ: Covers about 95.4% of movements — the most common Bollinger Bands setting.
- ±3σ: Covers about 99.8% of movements, useful for spotting extreme conditions.
Q3: Should I adjust parameters for short-term vs long-term trading?
The baseline recommendation is "period 20, standard deviation ±2σ". For different styles, you can use the following:
- Short-term trading: period 10, standard deviation ±1.9σ
- Long-term trading: period 50, standard deviation ±2.1σ
That said, Bollinger himself emphasises that ±2σ remains a stable and reliable choice regardless of timeframe.
Q4: When price breaks above the upper band or below the lower band, is that a direct buy/sell signal?
It is not recommended to treat breakouts from Bollinger Bands as standalone trading signals. Bollinger Bands are a volatility indicator — they are not designed to generate direct buy or sell signals.
For better accuracy, combine them with other indicators such as RSI or MACD to confirm whether a breakout is genuine or a false signal.
Q5: What is the difference between Bollinger Bands and Keltner Channels?
Both are channel-type indicators, but they are calculated differently:
- Bollinger Bands: measure volatility with "standard deviation", so they react quickly to extreme prices.
- Keltner Channels: calculated from "ATR (Average True Range)", producing smoother curves with fewer signals.
In practice you can use them together — when Keltner Channels "engulf" Bollinger Bands, it is called a TTM Squeeze, widely regarded as a high-probability breakout signal.
Q6: Why do Bollinger Bands use SMA by default instead of EMA?
John Bollinger's own explanation is that SMA uses the same weighting logic as the standard deviation calculation, preserving statistical consistency. Switching to EMA for the middle band would make the weighting of the middle, upper, and lower bands inconsistent, deviating from the original statistical meaning.
That said, some traders still swap the middle band to an EMA for a faster response. This is an advanced customisation.
Q7: Which timeframes suit Bollinger Bands best?
- 5-minute / 15-minute charts: For scalping, consider a shorter period (e.g. 10).
- 1-hour / 4-hour charts: The sweet spot for intraday and swing trading — the default 20 / ±2σ works well.
- Daily / weekly charts: For longer-term trading, try period 50 with ±2σ.
Regardless of timeframe, combine Bollinger Bands with indicators such as RSI and MACD to confirm signals.
8. Free Custom Indicators from Titan FX (MT4/MT5)
Titan FX offers a range of free custom indicators for the MT4/MT5 platforms to help traders optimise strategies and improve decision accuracy. Simply register a free Titan FX trading account to download and use them.
Open a Titan FX AccountMulti-Timeframe Bollinger Bands (Titan_Multi_BollingerBands)
The Multi-Timeframe Bollinger Bands indicator not only shows Bollinger Bands for the current chart's timeframe, but can also overlay Bollinger Bands from longer timeframes.
For example, on a 1-hour chart you can simultaneously display 4-hour and daily Bollinger Bands for analysis.
Being able to see the state of medium- and long-term Bollinger Bands reduces the risk of "missing the forest for the trees" when analysing short-term moves.
Learn more and install "Titan_Multi_BollingerBands"Bollinger Band %B Indicator (Titan_BB%B)
The Bollinger Band %B indicator shows where price sits within the Bollinger Bands.
Specifically, with the standard deviation set to 2, the -2σ line is treated as 0 and the +2σ line as 100, indicating the relative position of price.
Learn more and install "Titan_BB%B"Bollinger Band Width Indicator (Titan_BB_width)
The Bollinger Band Width indicator plots the change in band width on a sub-chart.
Standard Bollinger Bands make subtle band-width changes hard to spot, but this indicator highlights them efficiently.
In addition to a simple line display, it can also show the width as a histogram. In histogram mode, the colour changes depending on whether the width has expanded or contracted compared to the previous candle, making band contraction much easier to identify.
By focusing on the contraction and accumulation of band width, you can use it to pinpoint where trends are likely to peak or break out.
Learn more and install "Titan_BB_width"Trend Analysis via Bollinger Band Levels (Titan_BB_Stop_Level)
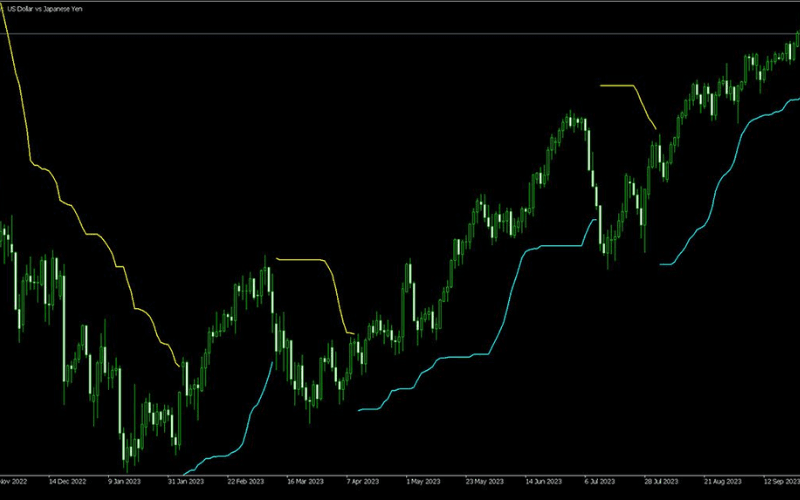
This indicator tracks specified upper- and lower-band Bollinger Band values and draws lines from them to assess trend development. When price exceeds the tracked upper-band level, the trend is judged as up; when it falls below the tracked lower-band level, the trend is judged as down.
During an uptrend, the chart shows the tracked lower-band level; during a downtrend, it shows the tracked upper-band level. These levels can serve as references for identifying trend reversals and placing stop-loss orders.
Learn more and install "Titan_BB_Stop_Level"Colour-Coded Bollinger Bands Visualisation (ColorBands)
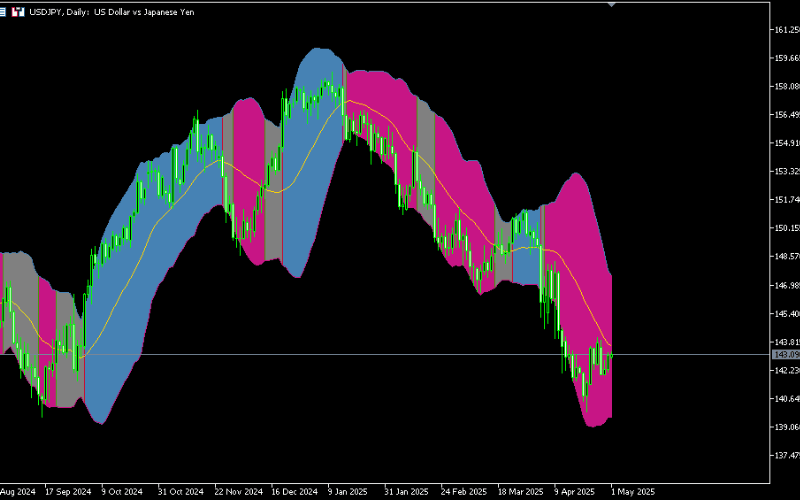
ColorBands is a visually oriented Bollinger Bands helper that uses colour-coded zones to highlight the relationship between price and the bands.
When price sits in different areas of Bollinger Bands, the indicator changes colour automatically. For example:
- When price is above the middle band, it is shown in a warm colour.
- When price is below the middle band, it is shown in a cool colour.
- When price breaks above or below the outer bands, the colour changes again, flagging a possible trend start or an overheated / oversold zone.
This design helps traders quickly grasp price location and volatility — especially useful for visually oriented traders.
Learn more and install "ColorBands"9. Summary
Bollinger Bands are a powerful technical indicator that combines trend and volatility. They are highly practical for identifying ranging markets, breakouts, trend continuation, and overbought/oversold conditions.
3 Core Takeaways
- Volatility tool, not a directional indicator: Bollinger Bands measure "the magnitude of volatility" and should not be used as a standalone buy/sell signal.
- Default 20 SMA + ±2σ: John Bollinger's recommended robust setup, covering roughly 95% of price movements.
- Three key patterns: Squeeze signals a big move ahead, Expansion signals the start of a trend, and Band Walk means "trade with the trend".
Different Uses for Beginners and Advanced Traders
- Beginners: Start by mastering the four basic patterns in section 3, using default parameters alongside RSI / MACD to filter out false signals.
- Advanced: Experiment with dual Bollinger Bands (±1σ + ±2σ) for zone management, Squeeze breakout strategies, and multi-timeframe combinations.
With sensible parameters and complementary tools, Bollinger Bands can help traders follow market rhythm with more confidence and make sharper trading decisions.