RSI Indicator: Calculation, Interpretation, and MT4/MT5 Use
The Relative Strength Index (RSI) is an oscillator that ranges from 0 to 100, signalling "overbought" above 70 and "oversold" below 30, and is used to gauge momentum and potential reversals.
The Relative Strength Index (RSI) is a widely used technical indicator primarily designed to measure overbought or oversold market conditions. The RSI value ranges from 0 to 100. Typically, when the RSI is above 70%, the market is considered "overbought," and when it's below 30%, the market is considered "oversold." This indicator is commonly used to help traders identify potential price reversal points or strong market trends.
- What RSI is: an oscillator (0–100) that measures overbought and oversold momentum
- Formula: RSI = 100 − 100 / (1 + RS), where RS = average gain / average loss
- Basic reading: above 70 is overbought, below 30 is oversold; threshold breaks give signals
- Advanced use: divergence and short/long RSI crossovers help spot reversals
- Caveats: RSI can stay pinned in strong trends — combine it with MACD or Bollinger Bands
1. Basic Concept of RSI (Relative Strength Index)
The design concept of RSI is to measure the intensity of price increases versus decreases over a given time period. By comparing the average upward momentum with the average downward momentum, RSI shows the relative strength of the market. RSI is an oscillator, and it typically reflects the intensity of price fluctuations within the set period, which is critical for forecasting market overbought or oversold conditions.
The RSI value fluctuates between 0 and 100, and it is often correlated with market price movements. The purpose of this indicator is to provide a visual understanding of price behavior and help traders make more precise buy and sell decisions.
2. RSI Calculation Formula
RSI (Relative Strength Index) is calculated based on the average gains and losses over a specific period, using the following formula:
RSI = 100 - [100 / (1 + RS)]
Where: RS (Relative Strength) = Average Gain / Average Loss
Example:
The table below records the closing prices and price changes compared to the previous day for the USD/JPY over the past 7 days:
| Day 1 | Day 2 | Day 3 | Day 4 | Day 5 | Day 6 | Day 7 | |
|---|---|---|---|---|---|---|---|
| Closing Price | 150.00 | 150.50 | 151.00 | 150.60 | 151.30 | 150.80 | 150.70 |
| Price Change | 0.50 | 0.50 | 0.30 | -0.40 | 0.70 | -0.50 | -0.10 |
Step 1: Calculate Gains and Losses
Gains: When the closing price is higher than the previous day, it indicates a gain.
Losses: When the closing price is lower than the previous day, it indicates a loss.
| Gain | Loss | |
|---|---|---|
| Day 1 | 0.50 | 0 |
| Day 2 | 0.50 | 0 |
| Day 3 | 0.30 | 0 |
| Day 4 | 0 | 0.40 |
| Day 5 | 0.70 | 0 |
| Day 6 | 0 | 0.50 |
| Day 7 | 0 | 0.10 |
Step 2: Calculate Average Gains and Average Losses
Next, calculate the Average Gains and Average Losses:
- Average Gain = (0.50 + 0.50 + 0.30 + 0 + 0.70 + 0 + 0) / 7 ≈ 0.286
- Average Loss = (0 + 0 + 0 + 0.40 + 0 + 0.50 + 0.10) / 7 ≈ 0.143
Step 3: Calculate Relative Strength (RS)
RS = Average Gain / Average Loss
RS = 0.286 / 0.143 = 2
Step 4: Calculate RSI
Finally, use the RSI formula to calculate RSI:
- RSI = 100 - [100 / (1 + RS)]
- RSI = 100 - [100 / (1 +2)]
- RSI = 100 - [100 / 3]
- RSI = 100 - 33.33
- RSI = 66.67
Result:
In this example, the RSI value is 66.67, indicating that the market is in a strong zone but has not yet entered the overbought zone (typically considered overbought when RSI exceeds 70). At this point, the market shows some upward momentum, but it remains within a reasonable range.
Setting RSI Period (Parameter)
When setting the period for the RSI indicator, 14 days is typically the most common choice.
This is because RSI's creator, J.W. Wilder, recommended 14 as the standard period in his research. As a result, 14 days is often the default setting on major trading platforms like MT4 (MetaTrader 4) and MT5 (MetaTrader 5).
Shortening the RSI period makes the indicator more sensitive to market fluctuations and can reflect price changes more promptly. However, this may result in more false signals, requiring careful judgment.
On the other hand, lengthening the RSI period smooths out the indicator's fluctuations but can cause a lag behind the immediate market movement, potentially missing some faster trading opportunities.
Therefore, for FX beginners, choosing 14 days as the standard RSI setting is a safer option.
3. How to Interpret RSI? Common Usage Methods
The most common way to use RSI is to judge the market's "overbought" and "oversold" conditions based on its value, which can provide trading signals.
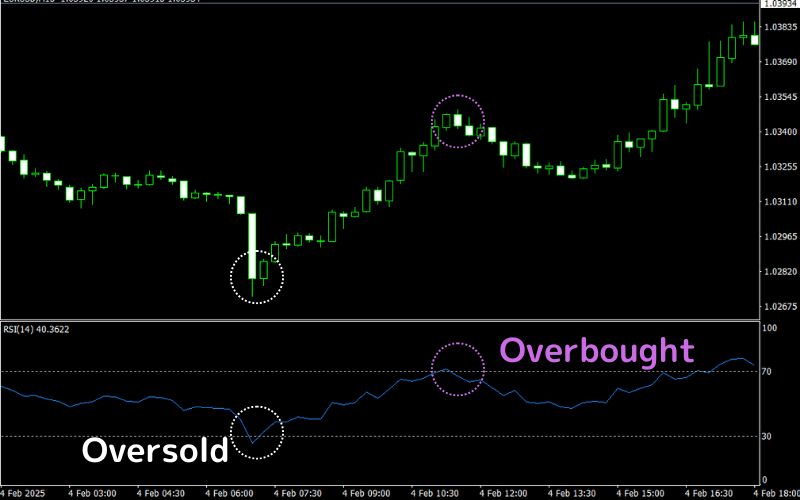
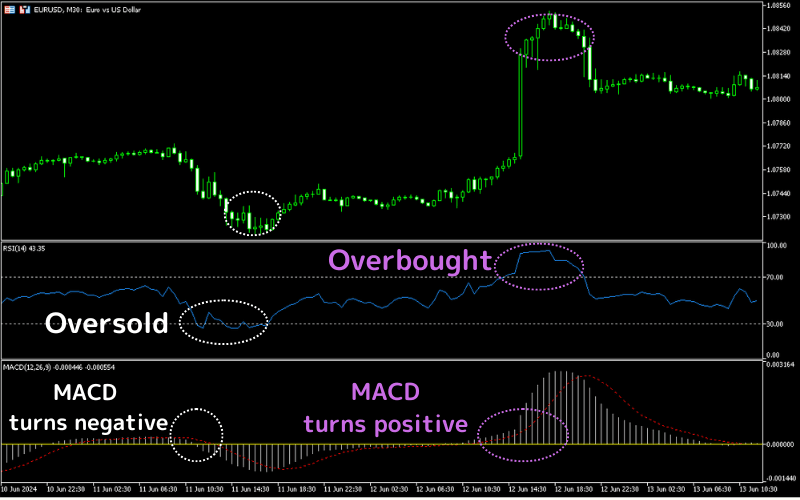
1: RSI Overbought and Oversold Conditions
When RSI is above 70, it typically indicates that the market is in an "overbought" condition, meaning the price may correct or reverse.
When RSI falls from above 70 to below 70, it may signal an opportunity for traders to short.
However, it's important to note that sometimes the bulls are strong, and the price may continue to rise for a while. In such cases, it's better to wait for a clearer trading signal.
Conversely, when RSI is below 30, the market is considered "oversold," indicating that the market is cooling down and prices might reverse upward.
When RSI rises from below 30 to above 30, it may signal an opportunity for traders to go long.
Again, attention should be paid to whether the selling pressure is too strong, and traders should wait for a clearer signal before entering the market.
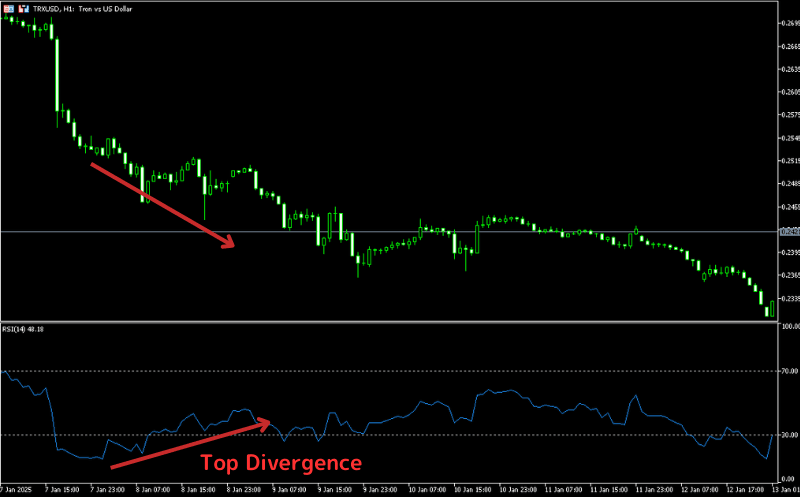
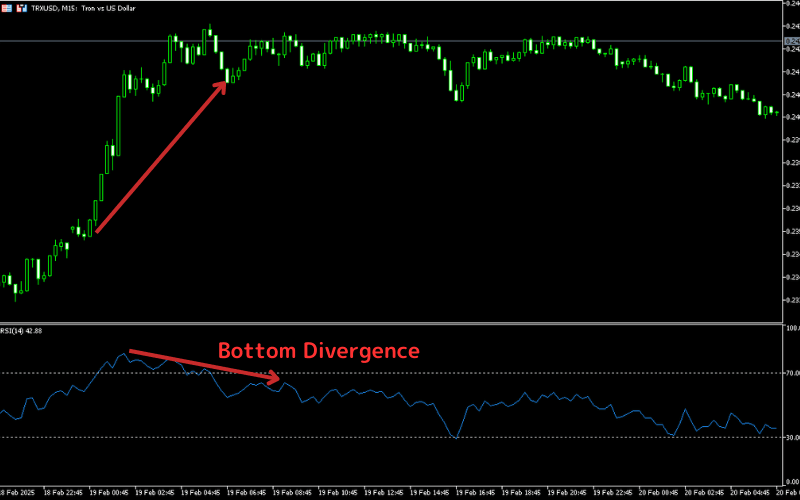
2: RSI Divergence
RSI can also be used to identify potential reversal points in the market, often through "divergence." When the price makes a new high or low, but the RSI fails to follow suit, this phenomenon is called "divergence" and typically signals a potential reversal.
Especially when there is a "top divergence" or "bottom divergence," traders should pay attention, as it may indicate an impending price reversal.
RSI Top Divergence:
When the market makes a new high but RSI fails to make a new high, it is called a top divergence, indicating a potential trend reversal to the downside.
RSI Bottom Divergence:
When the market makes a new low but RSI fails to make a new low, it is called a bottom divergence, indicating a potential trend reversal to the upside.
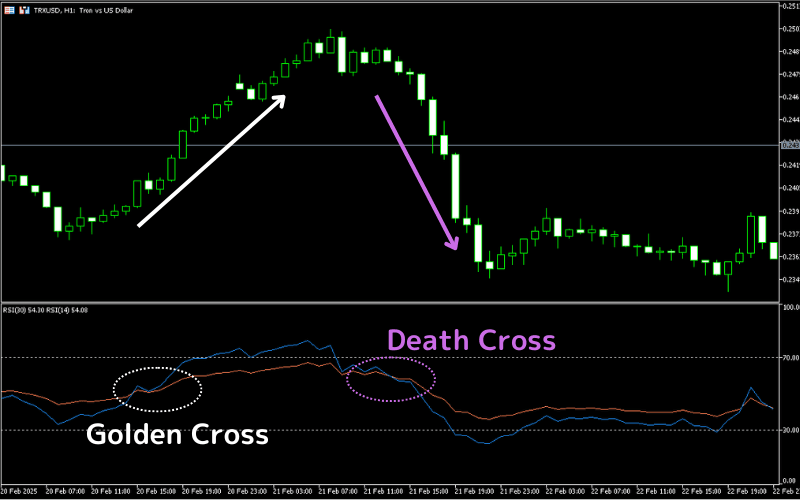
3: RSI Golden Cross and Death Cross
Although RSI has only one line, by loading two RSI indicators with different periods on the same chart, crossovers can also occur.
Golden Cross and Death Cross refer to signals generated when two different-period RSI lines cross each other.
Golden Cross occurs when the short-term RSI (e.g., 14-period) crosses above the long-term RSI (e.g., 30-period), typically signaling that prices might rise, indicating a buy signal.
Death Cross occurs when the short-term RSI crosses below the long-term RSI, signaling that prices might fall, indicating a sell signal.
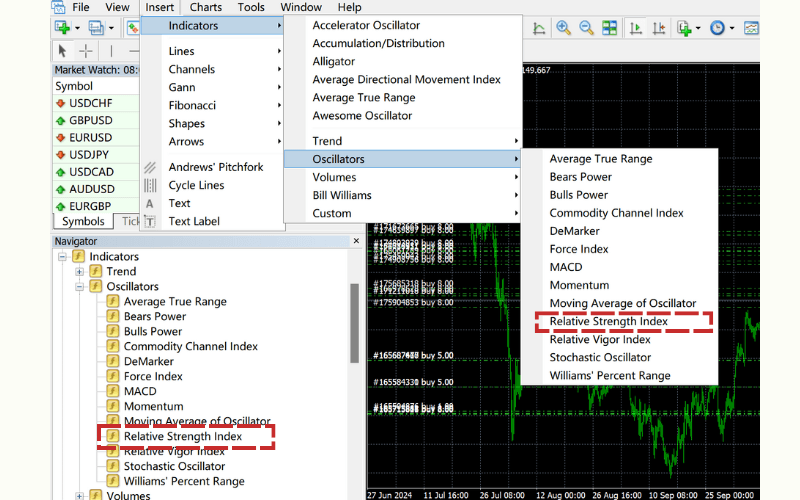
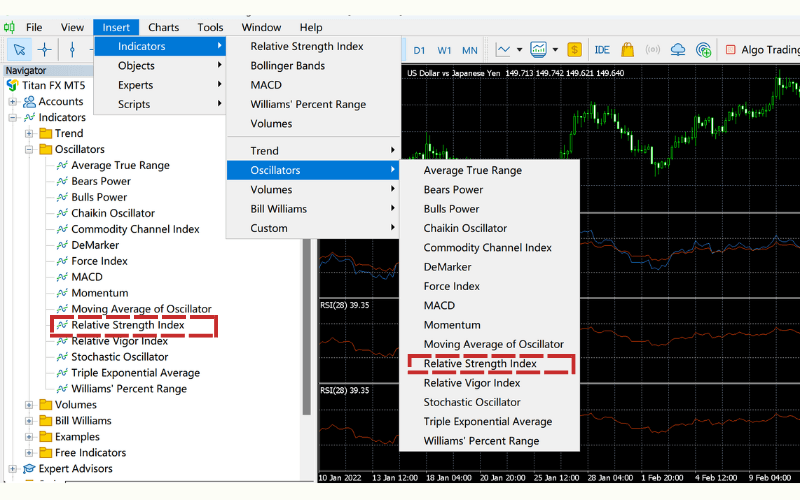
4. RSI Settings (MT4 and MT5)
On the MT4 or MT5 trading platform, RSI can be plotted through the following steps:
Drawing RSI on MT4
① Log in to MT4
② Open the chart for the trading instrument
③ Click on "Insert" in the menu bar → "Indicators" → "Oscillators" → "Relative Strength Index"; or click on "Navigator" → "Indicators" → "Oscillators" → "Relative Strength Index".
Drawing RSI on MT5
① Log in to MT5
② Open the chart for the trading instrument
③ Click on "Insert" in the menu bar → "Indicators" → "Oscillators" → "Relative Strength Index"; or click on "Navigator" → "Indicators" → "Oscillators" → "Relative Strength Index".
5. Combining RSI with Other Indicators
RSI can be combined with other technical indicators to improve the accuracy and reliability of trades. Here are two common RSI combinations:
RSI and MACD
MACD (Moving Average Convergence Divergence) displays the market's trend direction, momentum, and speed of change.
When RSI signals overbought or oversold conditions, MACD can help confirm whether it aligns with the overall market trend, filtering out false signals and increasing the success rate of trades.
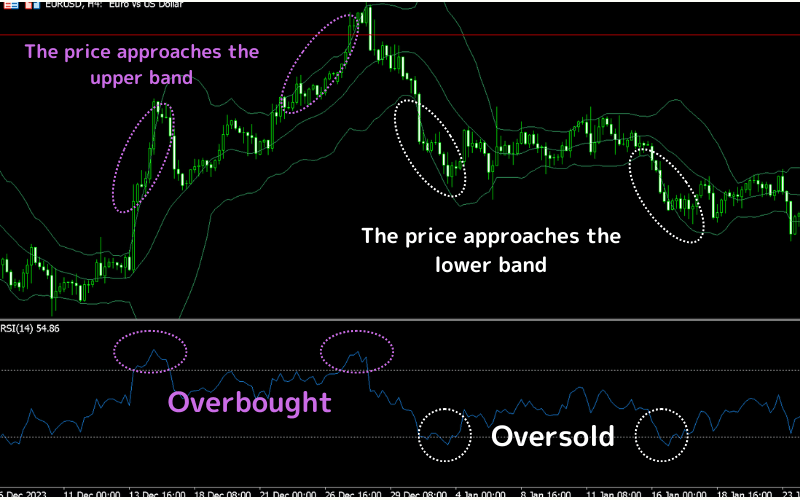
RSI and Bollinger Bands Combination
Bollinger Bands is an indicator that reflects the market’s volatility range, consisting of three lines: the moving average and the upper and lower bands.
When the price approaches the upper band of the Bollinger Bands and RSI is in the overbought zone, it suggests that the market may be overextended, and there is a risk of a price pullback. Conversely, when the price approaches the lower band and RSI is in the oversold zone, it may indicate that the market could experience a reversal or bounce.
6. Considerations for Using RSI
While RSI is a useful technical indicator, it also has some limitations. Here are a few points to keep in mind when using RSI:
1. Risk of False Signals
In strong market trends, RSI may remain in the overbought or oversold region for an extended period, which could lead to a misinterpretation of the market's direction. Therefore, traders should use RSI in conjunction with other technical indicators to confirm the market trend.
2. Market Volatility
RSI may show less accurate results in high-volatility markets because, in such markets, prices may rise or fall rapidly within a short period, causing RSI to enter the overbought or oversold zone. As a result, it's important to adjust the RSI parameters according to the market conditions.
3. Flexibility in Period Settings
The default period for RSI is 14, but this is not necessarily the most suitable setting. Depending on your trading style or market conditions, you can adjust the RSI period. Short-term traders might prefer a shorter period, while long-term traders may opt for a longer period to reduce false signals.
7. Frequently Asked Questions about RSI
Q1. Does RSI have any drawbacks?
The main drawback of RSI is that, during strong market trends, it may remain in the overbought or oversold region for extended periods, which can cause traders to miss further market movements. Therefore, RSI signals should be interpreted cautiously.
Q2. What does a high RSI value indicate?
When RSI is above 70%, the market is generally considered overbought, indicating that a price reversal or pullback may be imminent. Conversely, when RSI is below 30%, the market is considered oversold, suggesting that a price bounce or reversal may occur.
Q3. How does RSI differ from other indicators?
RSI primarily measures whether the market is overheated or cooled off, whereas other indicators, such as MACD or Bollinger Bands, focus on identifying market trends and volatility. Each indicator serves a different purpose, and using them together can provide a more comprehensive market analysis.
Q4. What RSI period setting is recommended?
RSI's creator J.W. Wilder recommended 14, the default on MT4/MT5. A shorter period reacts faster but produces more false signals, while a longer one is smoother but lags (§2).
Q5. Can I trade using RSI alone?
Relying on RSI alone risks false signals in strong trends. Combine it with MACD, Bollinger Bands, and support/resistance for more reliable decisions (§5, §6).
8. Conclusion
RSI is an effective technical analysis tool, especially for identifying overbought and oversold market conditions. By combining RSI with other indicators, you can more accurately assess market trends and reversal opportunities. When using RSI, be aware of its limitations in different market conditions, and adjust the settings according to your trading strategy.
Further Reading
- What Is MACD?
- Bollinger Bands
- Stochastic Oscillator (KD)
- What Is a Moving Average?
- What Is Divergence?
The financial markets research team at Titan FX. We produce educational content across a broad range of instruments, including forex (FX), commodities (crude oil, precious metals, agricultural products), equity indices, U.S. stocks, and crypto assets.
Primary Sources (by Category)
- Educational & research: Investopedia, CMT Association
- Market & data: Bloomberg, Reuters, and TradingView chart analysis and commentary