MACD Indicator Explained: Complete Beginner's Guide with Trading Examples

Among the many technical-analysis indicators available, MACD has become a staple because it shows both the direction of a trend and its strength in a single view. It tells you not just which way price is moving, but whether that move is gaining or losing steam — which is why it remains popular with beginners and professional traders alike.
This article explains MACD's operating principles and core parameters, and shows you how to apply golden crosses, death crosses, and divergences to capture potential trade setups. We also include a practical guide for MT4 / MT5 to help you build your own MACD trading workflow.
- MACD essence: A composite trend-and-momentum indicator built from the MACD line (fast), signal line (slow), and histogram, derived from moving averages
- Core read patterns: Golden / death crosses, histogram sign-flips, and price-vs-MACD divergence
- Default parameters: 12 / 26 / 9 (short-term traders may use 6 / 13 / 5; long-term may use 21 / 55 / 9)
- Five advantages: Visual trend reading / works in trend and counter-trend / cross-market applicability / multi-timeframe / easy to combine with other indicators
- Four limitations: Fake signals in ranging markets / lags during sudden moves / inherent moving-average lag / parameter tuning needs experience
1. What Is MACD?
MACD (Moving Average Convergence Divergence) is a widely used momentum and trend-tracking technical-analysis tool, developed in 1979 by analyst Gerald Appel. It is designed to capture trend changes and help traders time entries and exits.
MACD integrates three core capabilities into a single market view:
- Trend identification: Crossovers of the fast and slow lines reveal bullish vs bearish bias
- Momentum strength analysis: The length and direction of histogram bars reflect buying and selling pressure
- Reversal early warning: Divergences between price and MACD often warn of potential trend reversals
2. Components of the MACD Indicator
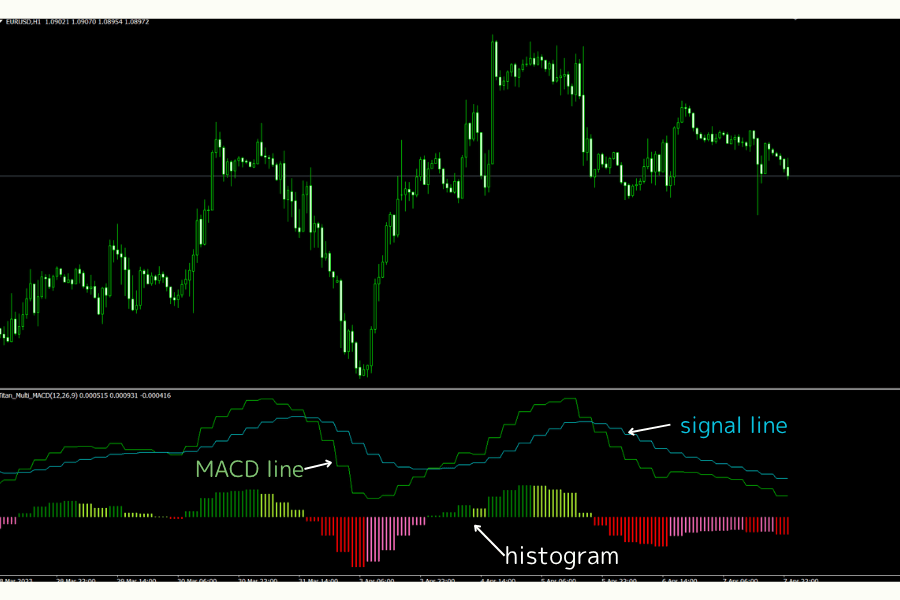
MACD is composed of three core elements: the MACD line (fast), signal line (slow), and histogram. Together they form a powerful trend-following plus momentum-analysis system that helps traders capture market shifts holistically.
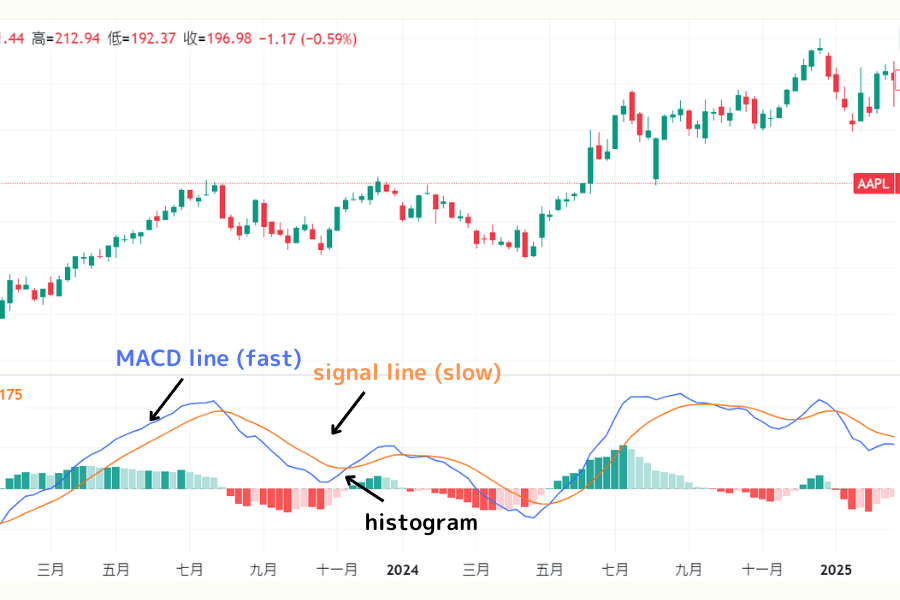
*Image source: TradingView
MACD line (fast)
The MACD line (DIF) is the difference between a short-term EMA and a long-term EMA. It's sensitive to short-term price action and reacts quickly to market dynamics — hence "fast line".
Formula: MACD line = short-term EMA − long-term EMA
Reading the MACD line:
- Positive value: short-term EMA above long-term EMA — uptrend, buyers in control
- Negative value: short-term EMA below long-term EMA — downtrend, sellers in control
Signal line (slow)
The signal line is the 9-day EMA of the MACD line, smoothing fast-line oscillations to reveal a more stable trend signal. It's slower to react — hence "slow line".
Formula: signal line = 9-day EMA of the MACD line
MACD histogram
The MACD histogram visualizes the difference between the MACD line and the signal line, intuitively reflecting momentum strength and trend changes.
Formula: MACD histogram = MACD line − signal line
Reading the histogram:
- Positive value: MACD line above the signal line — bullish momentum strengthening, possible buy
- Negative value: MACD line below the signal line — bearish momentum strengthening, possible sell
MACD parameter settings
The default MACD parameters are 12, 26, 9 — used by virtually every charting platform:
| Parameter | Description | Default | Role |
|---|---|---|---|
| Fast EMA | Short-term EMA | 12 days | Captures recent price action and short-term shifts |
| Slow EMA | Long-term EMA | 26 days | Tracks longer-term trend, providing a stable reference |
| Signal | EMA of MACD line | 9 days | Smooths the MACD line to generate trade signals |
3. How to Read MACD
On MT4 and MT5, the default MACD display actually shows only the signal line and histogram — not all three classic components (MACD line, signal line, histogram).
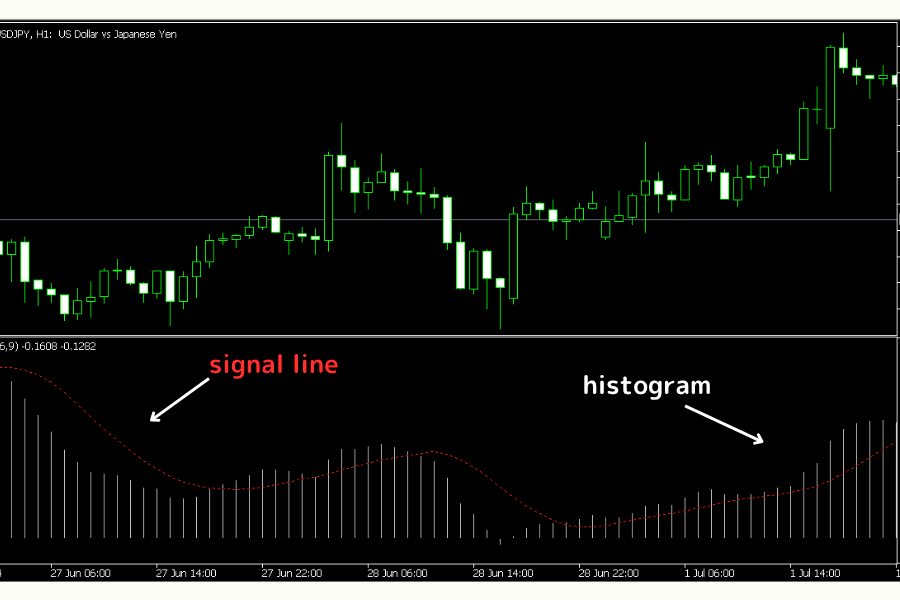
This default may surprise first-time platform users, but it actually reduces visual clutter. The simplification helps traders, especially beginners, identify key shifts more quickly and follow market dynamics with less noise.
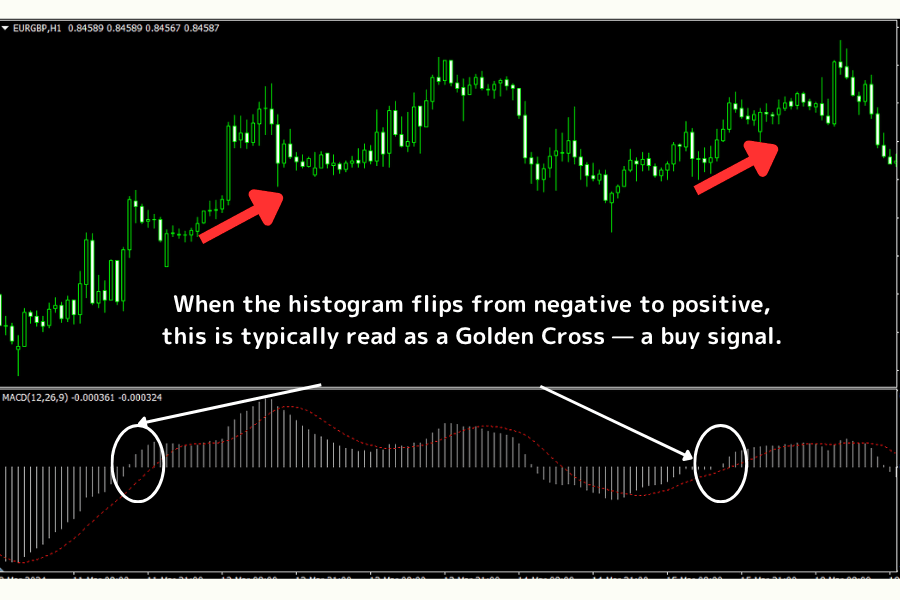
MACD histogram positive: "Buy signal"
When the histogram flips from negative to positive, this is typically read as a Golden Cross — a buy signal. It implies that buying momentum is strengthening and that prices may rise.
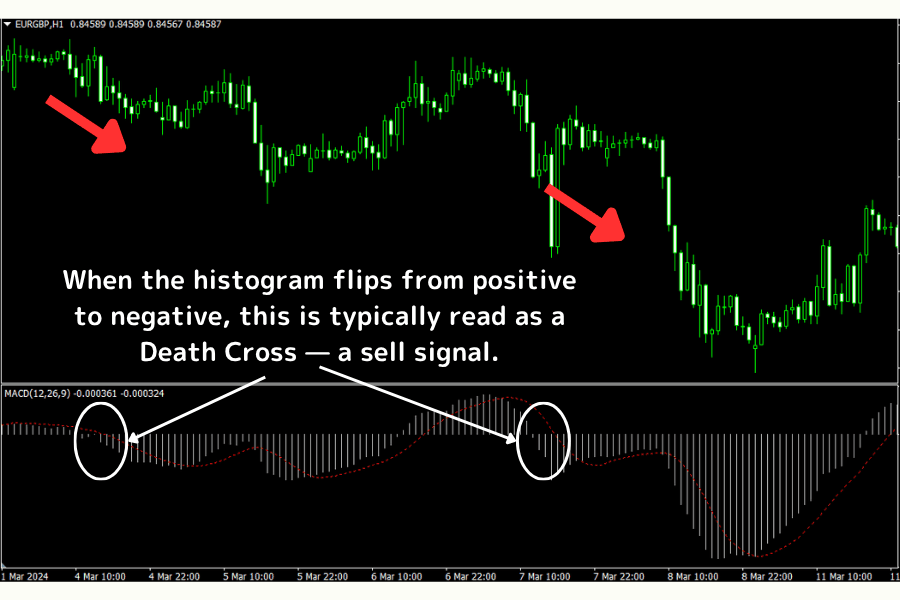
MACD histogram negative: "Sell signal"
When the histogram flips from positive to negative, this is typically read as a Death Cross — a sell signal. It implies that selling momentum is strengthening and that prices may fall.
4. Advantages of Using MACD
MACD is a core tool in technical analysis and is widely used by traders. Here are its main advantages:
Advantage 1: Visual reading makes trend identification clear
MACD helps traders judge both trend direction and trend strength. Through the cross angle of the MACD line and signal line, plus the length and changes of the histogram, you can read the bullish-vs-bearish balance directly.
The table below summarizes typical observations and their interpretations:
| Observation | Signal | Implication |
|---|---|---|
| MACD line crosses above signal line | Golden cross | Uptrend may be starting |
| MACD line crosses below signal line | Death cross | Downtrend may be starting |
| Histogram bars getting larger | Momentum expanding | Trend is accelerating |
| Histogram bars shrinking | Momentum waning | Trend may be entering consolidation |
| Histogram flips (positive↔negative) | Direction reversal | Trend may be reversing |
MT4 / MT5 user note
The default MT4 / MT5 MACD display shows only the signal line and histogram — the fast line (MACD line) is not included.
This means you cannot directly observe the "fast vs slow line cross" and must infer momentum and trend from the histogram alone — which is visually thinner.
Recommended fix:
Use Titan FX's dedicated Multi MACD custom indicator, which displays the MACD line, signal line, and histogram together on MT4 / MT5 — improving visual clarity and trade accuracy.
Learn more: Titan Multi MACD custom indicator install and usage
Advantage 2: Works for both trend-following and counter-trend strategies
MACD was originally designed for trend-following, but it can also be applied flexibly to counter-trend strategies, divergence reading, and swing trading.
Traders can adjust how they use MACD to suit market conditions and personal style — making it a versatile tool.
Advantage 3: Applicable across multiple financial markets
Since MACD is computed from price moving averages, it applies to any market where price action matters: forex (FX), equities, commodities (such as gold and crude oil), and even crypto (such as Bitcoin).
Advantage 4: Works on all timeframes
MACD parameters are flexible. Whether you trade 1-minute charts (super-short-term), daily charts (swing), or weekly charts (long-term investing), MACD provides reliable reference signals across timeframes — making it a strong cross-timeframe analysis aid.
Advantage 5: Combines well with other technical indicators
MACD can be combined with other indicators to improve analytical accuracy. For example:
- Pair with RSI → confirm momentum divergence and detect reversals earlier
- Pair with Bollinger Bands → boost accuracy when crosses occur at extreme bands
- Pair with support / resistance levels → filter out false signals and reinforce key price levels
5. Disadvantages of MACD
While MACD is a powerful technical-analysis tool, it has limitations. Below are the four main drawbacks to help traders evaluate where MACD fits — and where it doesn't:
Drawback 1: Prone to false signals
MACD's golden / death crosses can produce false signals, particularly in ranging markets where price oscillation triggers frequent crosses without an underlying trend, leading to whipsaws. Combine MACD with RSI or support / resistance to filter false signals.
Drawback 2: Cannot react to short-term volatility
Because MACD is based on average prices, it lags during sharp short-term moves — for example, the histogram may not reflect prices instantly during economic releases. Try shortening parameters (e.g. 6, 13, 5) or pair with Bollinger Bands.
Drawback 3: Lag affects timeliness
As an indicator derived from moving averages, MACD inherits a lag — by the time signals form, price has often already moved part of the way. Short-term traders may miss optimal entries; pair with leading indicators (e.g. Stochastic KD) for offset.
Drawback 4: Parameter tuning requires experience
The default parameters (12, 26, 9) do not fit all markets and need to be adjusted to market characteristics — otherwise signals may distort. Beginners may struggle to find the optimal settings; test different parameters and use historical data for optimization.
6. Drawing MACD on MT4 / MT5
On MT4 or MT5, drawing MACD takes just a few steps:
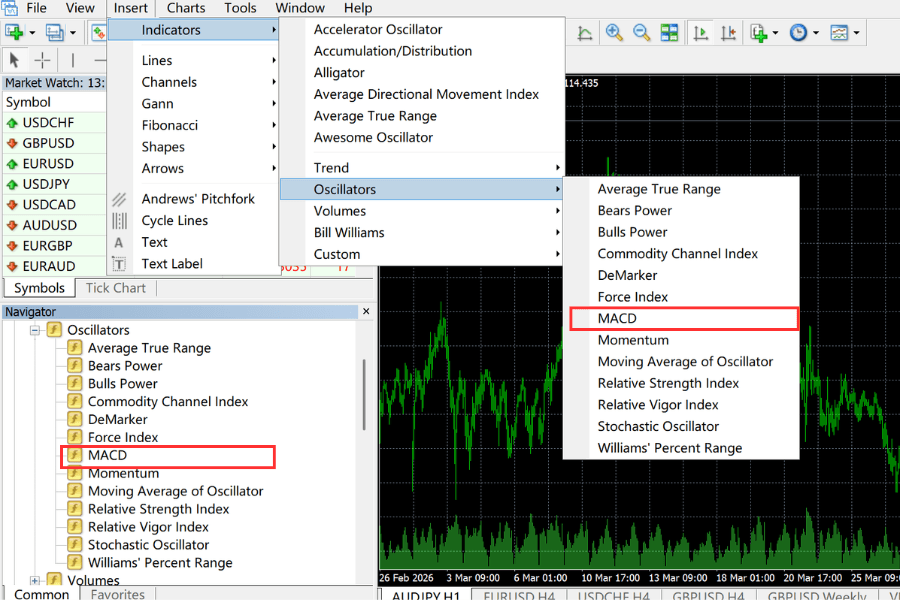
MT4: How to draw MACD
① Log in to MT4
② Open the chart for the trading pair you want to analyze
③ Click "Insert" → "Indicators" → "Oscillators" → "MACD"; or, in the Navigator, select "Indicators" → "Oscillators" → "MACD".
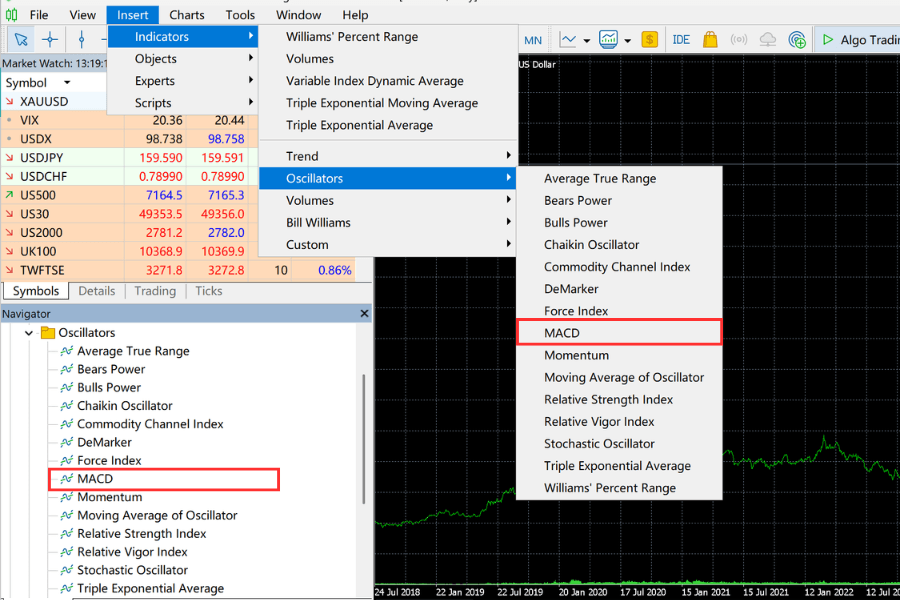
MT5: How to draw MACD
① Log in to MT5
② Open the chart for the trading pair you want to analyze
③ Click "Insert" → "Indicators" → "Oscillators" → "MACD"; or, in the Navigator, select "Indicators" → "Oscillators" → "MACD".
7. Titan FX's Free Custom MACD Indicator
Titan FX provides a wide range of free custom indicators for MT4 / MT5. They are designed to help traders optimize trading strategies and improve decision accuracy — useful for both beginners and experienced traders.
A free Titan FX trading account is all you need to download and install these indicators. Account setup is fast and simple, and you can open one without submitting an ID or address proof.
Open a free Titan FX demo accountMulti-Timeframe MACD (Titan_Multi_MACD)
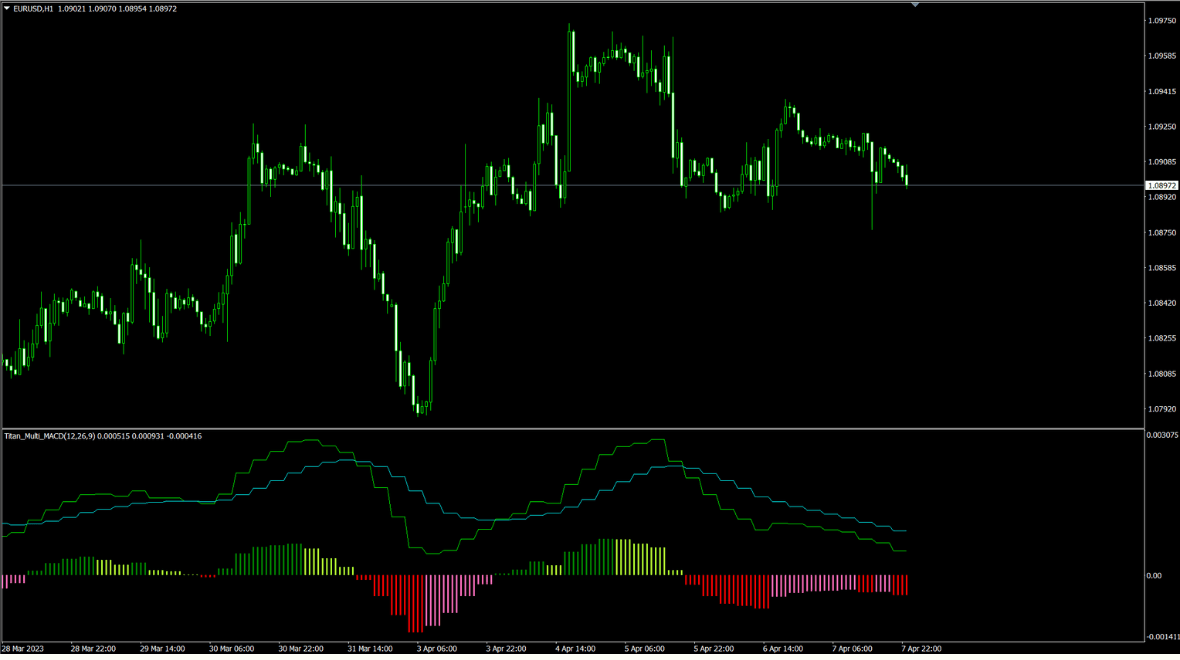
The Multi-Timeframe MACD displays both the current chart timeframe's MACD and a longer-timeframe MACD on the same chart.
In addition, the indicator shows the difference histogram between the MACD and signal lines — and the histogram colour shifts based on whether the previous candlestick increased or decreased, making subtle changes easy to spot.
Multi-Timeframe MACD (Titan_Multi_MACD) details and installation8. Frequently Asked Questions (FAQ)
Below are some common questions and answers about MACD.
Q1. What markets is MACD suitable for?
MACD works on stocks, forex, futures, and other liquid markets — particularly when there is a clear trend.
Q2. Do I have to use 12, 26, 9?
No. Short-term traders may switch to 6, 13, 5 for higher sensitivity, while long-term investors may try 21, 55, 9 to filter noise.
Q3. What does it mean when the MACD histogram lengthens / shortens?
A lengthening histogram signals strengthening trend momentum; a shortening one signals fading momentum and possible reversal.
Q4. What is MACD divergence and how do I spot it?
When price makes a new high but MACD does not (top divergence) or price makes a new low but MACD does not (bottom divergence), both can be important reversal warnings.
9. Conclusion
MACD is a core tool in technical analysis. Through the crosses of its fast and slow lines and the changes of its histogram, it provides a reliable read on trend direction and momentum strength.
This article walked through MACD from the basics to practical applications — the components, parameter tuning, and how to identify key signals such as golden cross, death cross, and divergence.
Whether you trade stocks, forex, or futures, combining MACD with the MT4 / MT5 setup steps and Titan FX's custom indicators can sharpen your read of market rhythm and improve trading-decision quality.
Further Reading
- Moving Averages (MA) Complete Guide
- Golden Cross
- Reversal Patterns
- Bollinger Bands
- RSI (Relative Strength Index)
- Titan FX Multi-Timeframe MACD Custom Indicator
The Titan FX Financial Markets Research and Analysis Team. Covering forex (FX), commodities (crude oil, precious metals, agricultural products), stock indices, US equities, and crypto assets, the team produces educational content for investors across a broad range of financial instruments.
Primary Sources (by category)
- Original works: Gerald Appel, Technical Analysis: Power Tools for Active Investors (2005) — creator of the MACD indicator
- Education and research: CMT Association, Investopedia: MACD, Wikipedia: MACD
- Platform documentation: MetaQuotes MT4 / MT5 standard MACD indicator reference
- Media and research: Bloomberg, Reuters, and Wall Street Journal technical-analysis coverage