How to Read Candlestick Charts: A Comprehensive Guide to 20 Candlestick Patterns and Market Predictions
A candlestick chart displays open, close, high, and low prices in a single candle, using color and shape to convey market sentiment at a glance. Widely used across stocks, forex, futures, and crypto, candlesticks are a staple of technical analysis for traders at every timeframe.
Candlestick charts, also referred to as K-line charts in some regions, are a visual charting tool used to represent price fluctuations. Their key feature is the ability to condense price movements within a given time period in a concise manner. Through the combination of color and shape, candlesticks intuitively present market price information and emotional fluctuations.
Due to their simplicity, ease of understanding, and effective reflection of market conditions, candlestick charts are widely used in technical analysis across financial markets such as stocks, forex, futures, precious metals, and cryptocurrencies. Whether for short-term traders or long-term investors, candlestick analysis plays a crucial role in decision-making.
This article will provide a comprehensive overview of candlestick chart concepts and history, explain their components, and explore 20 common candlestick patterns and their implications in the market.
- Candle Structure: Each candle shows four data points — open, close, high, low — within a chosen timeframe. Color (bullish/bearish) indicates price direction.
- 20 Patterns Covered: From simple single-candle forms (Marubozu, Doji, Hammer, Shooting Star) to multi-candle reversals (Morning Star, Three White Soldiers, Engulfing).
- Bullish vs Bearish Read: Body-to-wick ratio and pattern context reveal market psychology (buyers, sellers, indecision).
- Universal Application: Used across stocks, forex, futures, commodities, and crypto. Effective from 1-minute to monthly timeframes.
- Best Practice: Don't rely on a single pattern. Combine with trend direction, volume, and other technical indicators for confirmation.
Candlestick Charts: Components and Structure Explained
Candlestick charts, also known as K-line charts, are a popular tool used to depict price movements over time. This chart type visually represents the price fluctuations within a specific period, helping traders and investors understand market trends and sentiment more clearly.
Originating in 18th-century Japan, candlestick charts were initially used to track rice prices. Over time, they evolved and became widely adopted across global financial markets, including stocks, forex, futures, commodities, and cryptocurrencies. Due to their superior analytical capabilities and visual clarity, candlestick charts are an essential tool in technical analysis.
Components and Structure of a Candlestick
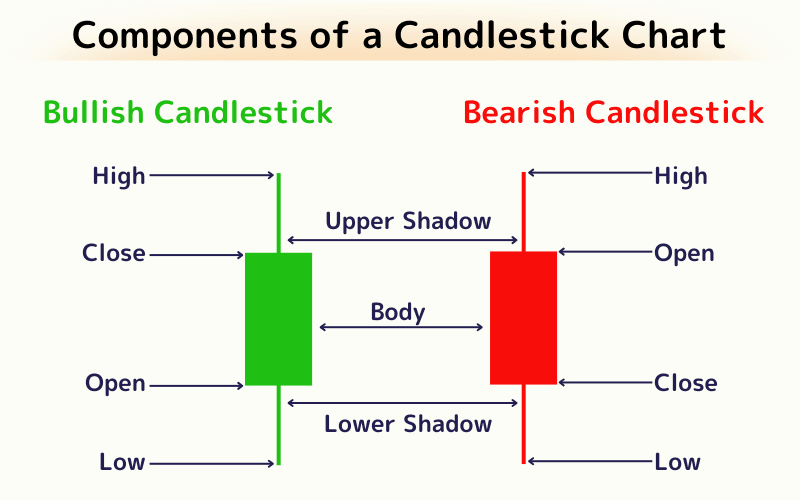
A candlestick is composed of six elements: the high price, low price, opening price, closing price, body, and shadows (or four key parts if considering only the prices). Together, they represent price fluctuations over a given period:
| Component | Description |
|---|---|
| High Price | The highest trading price within the period. |
| Low Price | The lowest trading price within the period. |
| Opening Price | The price at the start of the trading period. |
| Closing Price | The price at the end of the trading period. |
| Body | A rectangular area formed by the opening and closing prices. If the closing price is higher than the opening price, it forms a bullish candlestick (green); if lower, it forms a bearish candlestick (red). |
| Shadow | Thin lines extending from the body, representing the range between the high/low prices and the opening/closing prices. |
Candlestick Color Convention
In Western markets, it is common to use green for rising and red for falling. However, in regions like China, Taiwan, Japan, and South Korea, the red candlestick (red K) typically represents an upward movement, while the black candlestick (green K) represents a downward movement. It's important to be aware of this distinction!
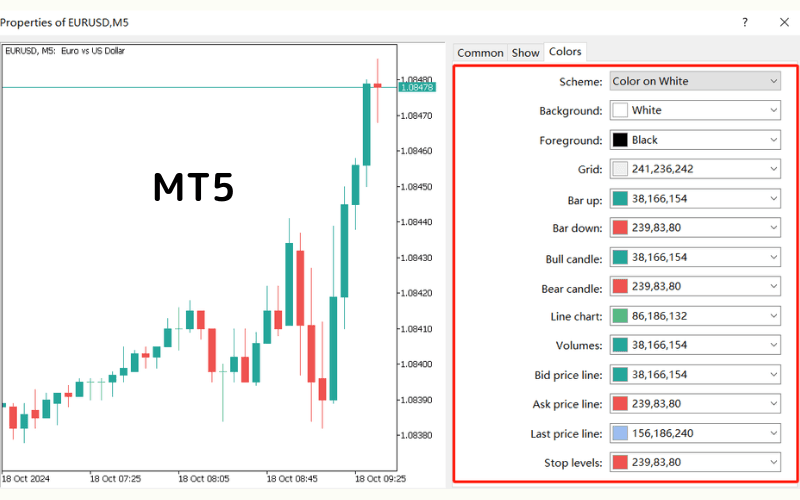
Candlestick colors can be customized based on personal preferences in trading platforms.
For instance, popular trading platforms like MT4/MT5, commonly used for Forex and CFD trading, default to a "Green on Black" color scheme for chart analysis. However, you can adjust the colors to suit your preferences, such as switching to "Black on White" or "Color on White" .
Candlestick Classification by Time Period
Candlestick charts can be classified into different types based on their time periods, such as daily candlesticks, weekly candlesticks, and monthly candlesticks.
These classifications capture price movements within a day, a week, or a month, with each candlestick representing price action during the respective time period.
In the MT4 software, there are 9 types of candlestick periods available, including minute charts (e.g., 1-minute, 5-minute), hourly charts, daily, weekly, and monthly charts.
MT5 expands on this range, offering up to 21 candlestick periods, including more minute and hourly chart options, as well as less common periods such as 3-minute and 12-hour charts.
Different candlestick timeframes are suitable for different types of traders. Depending on their trading strategies and goals, traders can choose the most appropriate timeframe for market analysis and decision-making.
Here is a simple guide to help understand which time periods are best suited for various types of traders:
| Trader Type | Suitable Time Periods | Description |
|---|---|---|
| Scalpers | 1-minute (M1), 5-minute (M5) | Aim for quick profits from small price differences, frequent market entry and exit. |
| Day Traders | 5-minute (M5), 15-minute (M15), 30-minute (M30), 1-hour (H1) | Open and close positions within the same day, aiming to capture intra-day market movements. |
| Short-Term Traders | 1-hour (H1), 4-hour (H4) | Hold positions from a day to a few weeks, taking advantage of price fluctuations within a trend. |
| Medium-Term Investors | Daily (D1), Weekly (W1) | Hold positions for weeks to months, analyzing medium-term market trends. |
| Long-Term Investors | Weekly (W1), Monthly (MN) | Hold positions for months to years, focusing on long-term price trends and fundamental analysis. |
20 Types of Candlestick Patterns and What They Indicate in the Market:
Candlestick charts feature 20 key patterns, each representing specific market sentiment and potential price movements.
1. Bullish Marubozu Candlestick
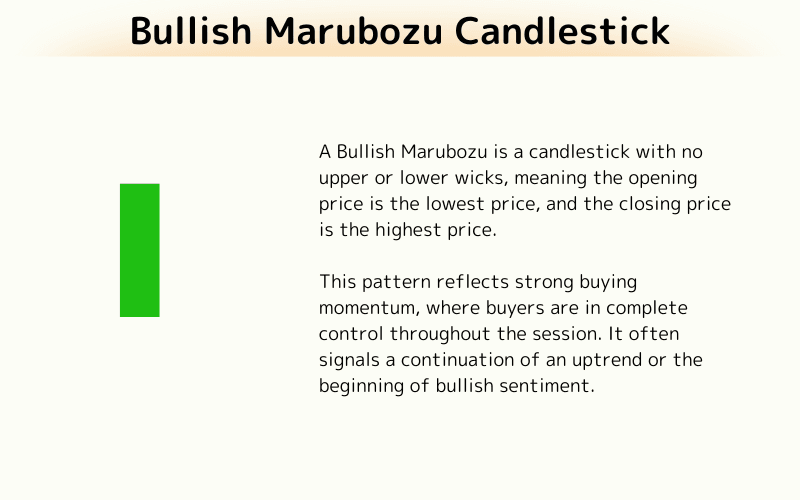
A Bullish Marubozu is a candlestick with no upper or lower wicks, meaning the opening price is the lowest price, and the closing price is the highest price. This pattern reflects strong buying momentum, where buyers are in complete control throughout the session. It often signals a continuation of an uptrend or the beginning of bullish sentiment.
2. Bearish Marubozu Candlestick
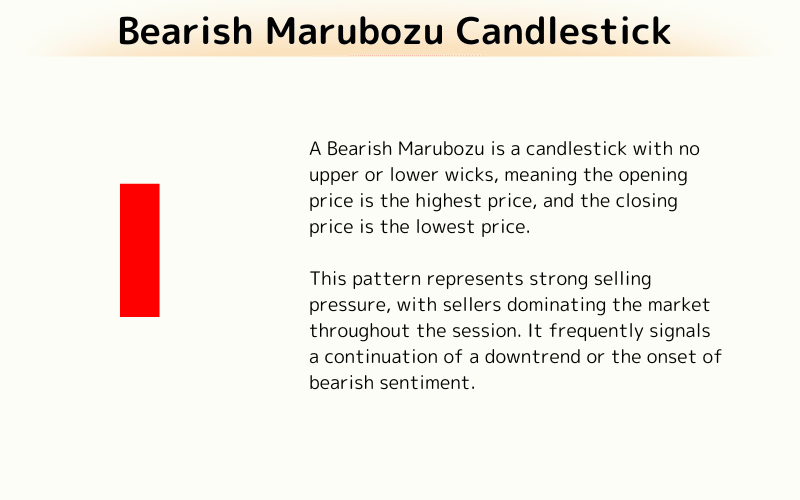
A Bearish Marubozu is a candlestick with no upper or lower wicks, meaning the opening price is the highest price, and the closing price is the lowest price. This pattern represents strong selling pressure, with sellers dominating the market throughout the session. It frequently signals a continuation of a downtrend or the onset of bearish sentiment.
3. Hammer Candlestick
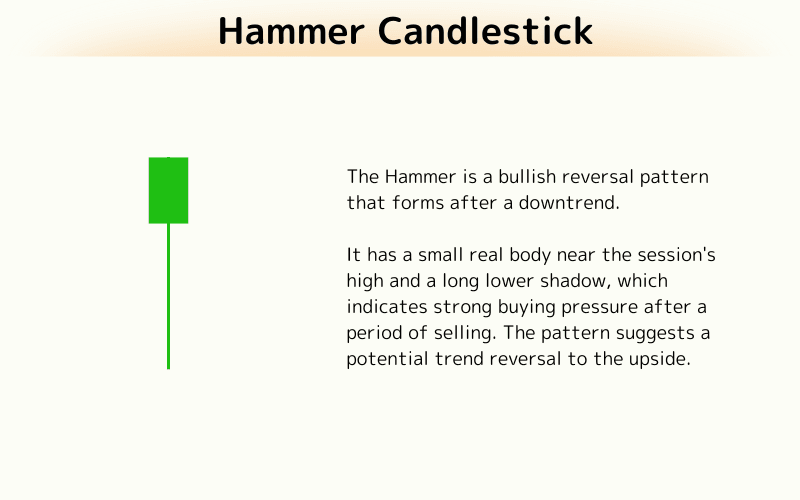
The Hammer is a bullish reversal pattern that forms after a downtrend. It has a small real body near the session's high and a long lower shadow, which indicates strong buying pressure after a period of selling. The pattern suggests a potential trend reversal to the upside.
4. Inverted Hammer Candlestick
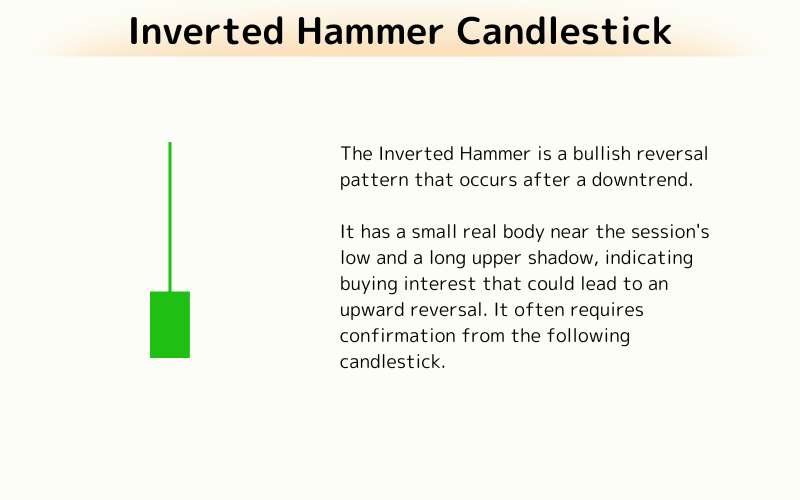
The Inverted Hammer is a bullish reversal pattern that occurs after a downtrend. It has a small real body near the session's low and a long upper shadow, indicating buying interest that could lead to an upward reversal. It often requires confirmation from the following candlestick.
5. Shooting Star Candlestick
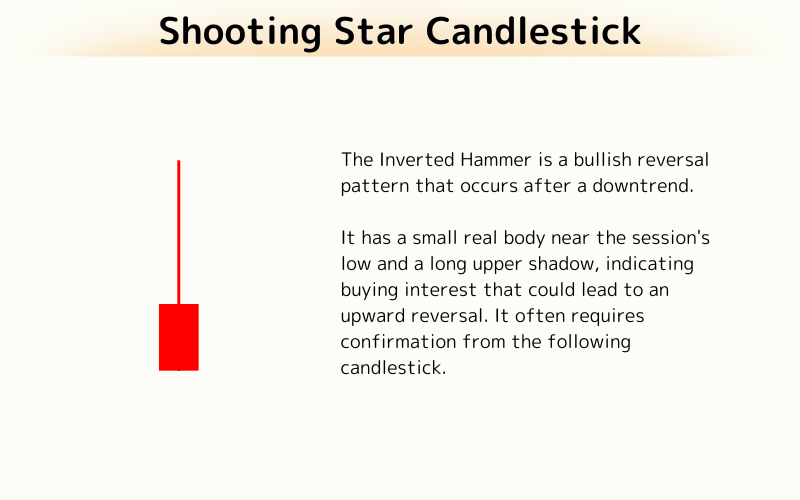
The Shooting Star is a bearish reversal pattern that appears after an uptrend.It has a small real body near the session's low and a long upper shadow, indicating that the price was pushed higher during the session but sellers regained control, driving the price down. This pattern signals a potential trend reversal to the downside.
6. Hanging Man Candlestick
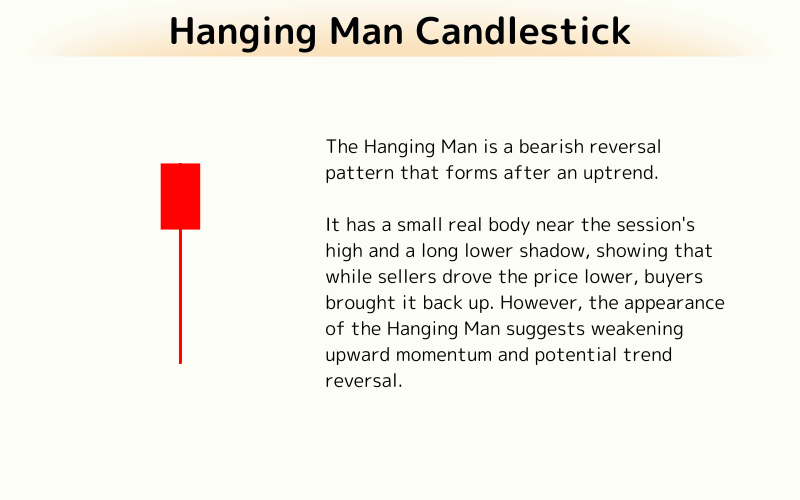
The Hanging Man is a bearish reversal pattern that forms after an uptrend. It has a small real body near the session's high and a long lower shadow, showing that while sellers drove the price lower, buyers brought it back up. However, the appearance of the Hanging Man suggests weakening upward momentum and potential trend reversal.
7. Bullish Engulfing Candlestick
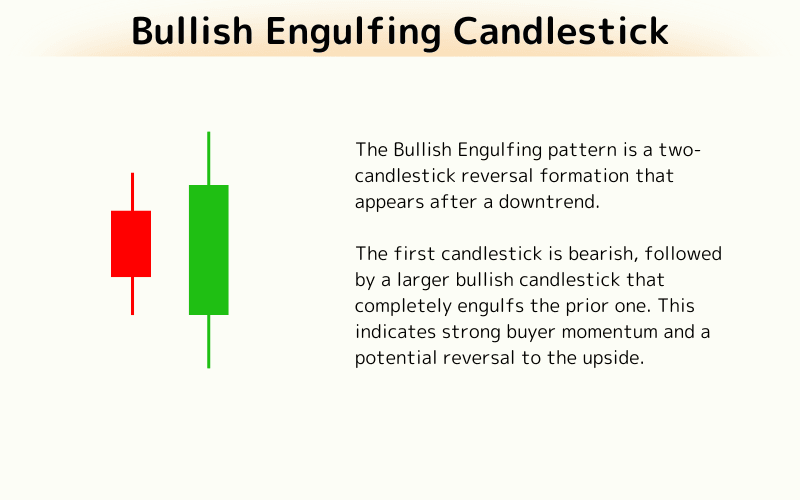
The Bullish Engulfing pattern is a two-candlestick reversal formation that appears after a downtrend. The first candlestick is bearish, followed by a larger bullish candlestick that completely engulfs the prior one. This indicates strong buyer momentum and a potential reversal to the upside.
8. Bearish Engulfing Candlestick
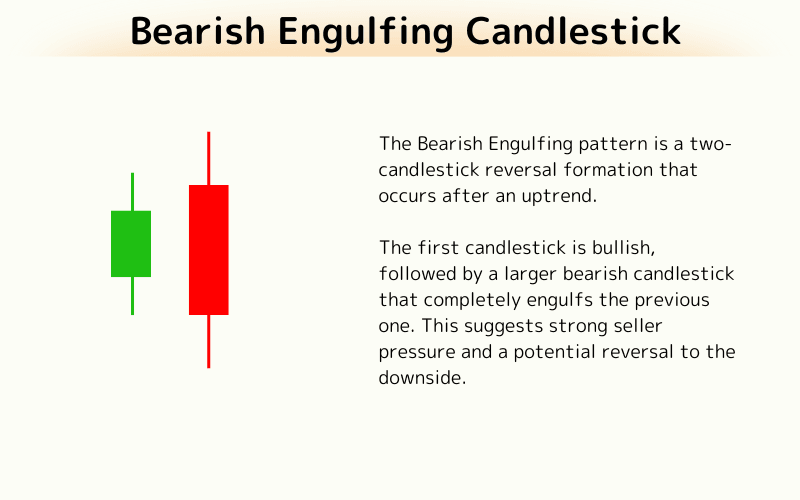
The Bearish Engulfing pattern is a two-candlestick reversal formation that occurs after an uptrend. The first candlestick is bullish, followed by a larger bearish candlestick that completely engulfs the previous one. This suggests strong seller pressure and a potential reversal to the downside.
9. Doji Candlestick
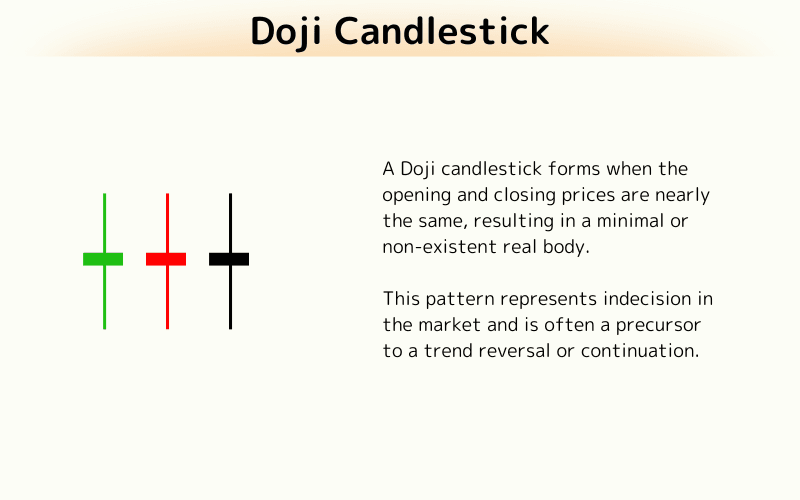
A Doji candlestick forms when the opening and closing prices are nearly the same, resulting in a minimal or non-existent real body. This pattern represents indecision in the market and is often a precursor to a trend reversal or continuation.
10. Dragonfly Doji Candlestick
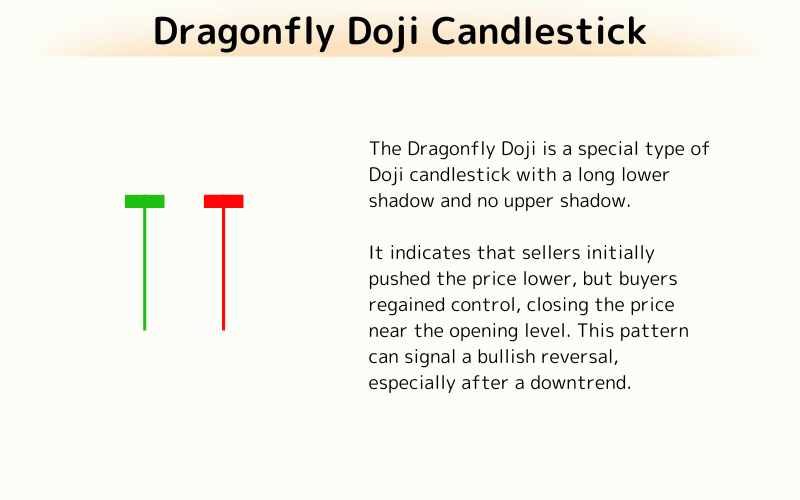
The Dragonfly Doji is a special type of Doji candlestick with a long lower shadow and no upper shadow. It indicates that sellers initially pushed the price lower, but buyers regained control, closing the price near the opening level. This pattern can signal a bullish reversal, especially after a downtrend.
11. Gravestone Doji Candlestick
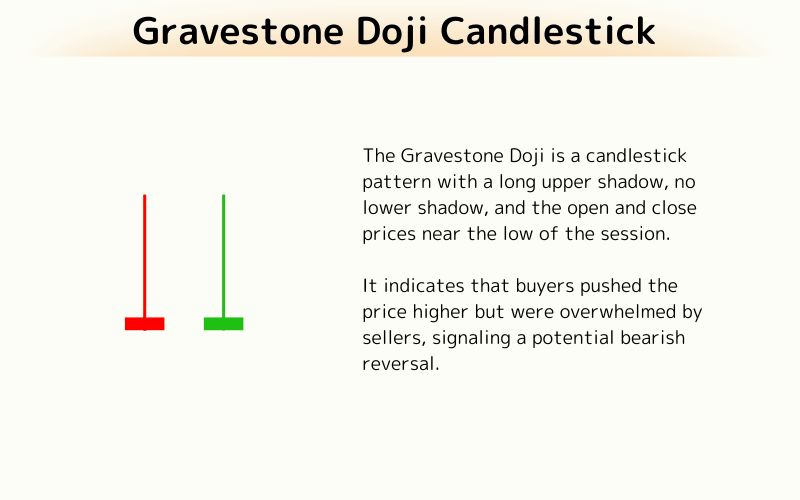
The Gravestone Doji is a candlestick pattern with a long upper shadow, no lower shadow, and the open and close prices near the low of the session. It indicates that buyers pushed the price higher but were overwhelmed by sellers, signaling a potential bearish reversal.
12. Morning Star Candlestick
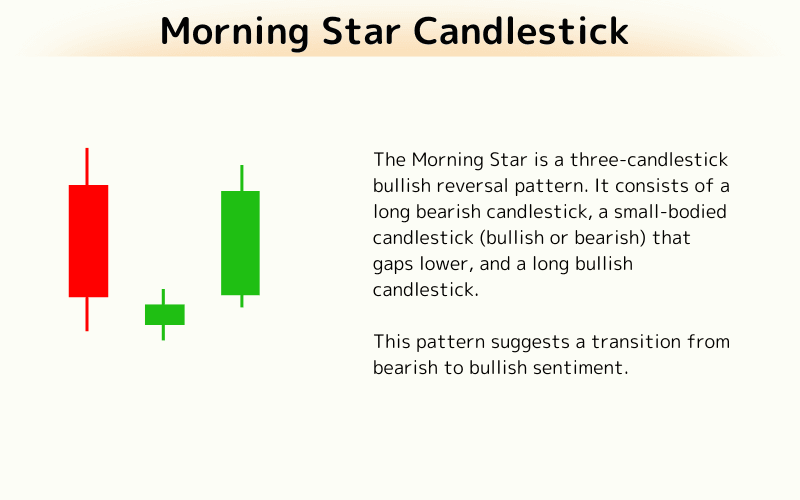
The Morning Star is a three-candlestick bullish reversal pattern. It consists of a long bearish candlestick, a small-bodied candlestick (bullish or bearish) that gaps lower, and a long bullish candlestick. This pattern suggests a transition from bearish to bullish sentiment.
13. Evening Star Candlestick
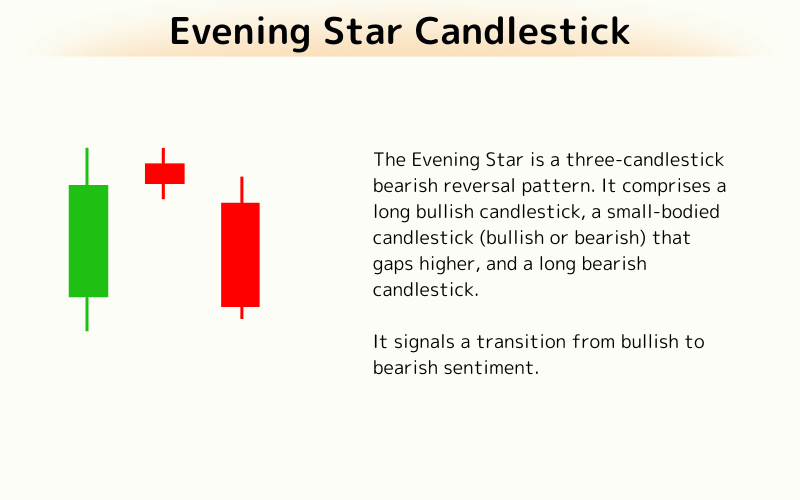
The Evening Star is a three-candlestick bearish reversal pattern. It comprises a long bullish candlestick, a small-bodied candlestick (bullish or bearish) that gaps higher, and a long bearish candlestick. It signals a transition from bullish to bearish sentiment.
14. Three White Soldiers Candlestick
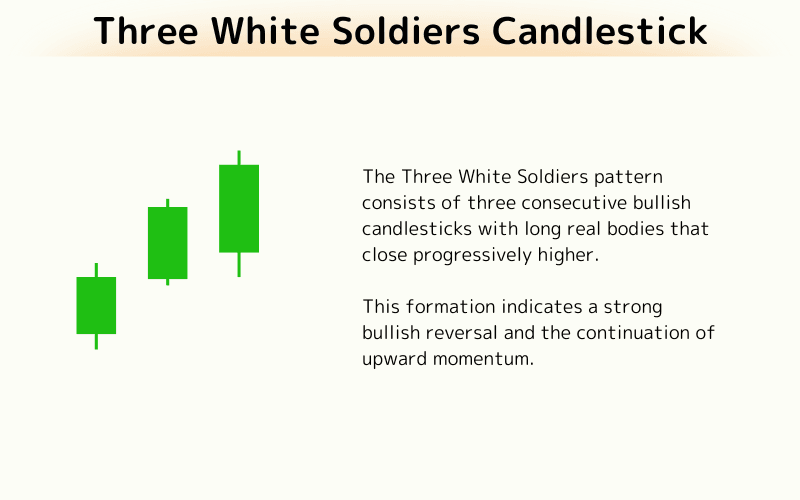
The Three White Soldiers pattern consists of three consecutive bullish candlesticks with long real bodies that close progressively higher. This formation indicates a strong bullish reversal and the continuation of upward momentum.
15. Three Black Crows Candlestick
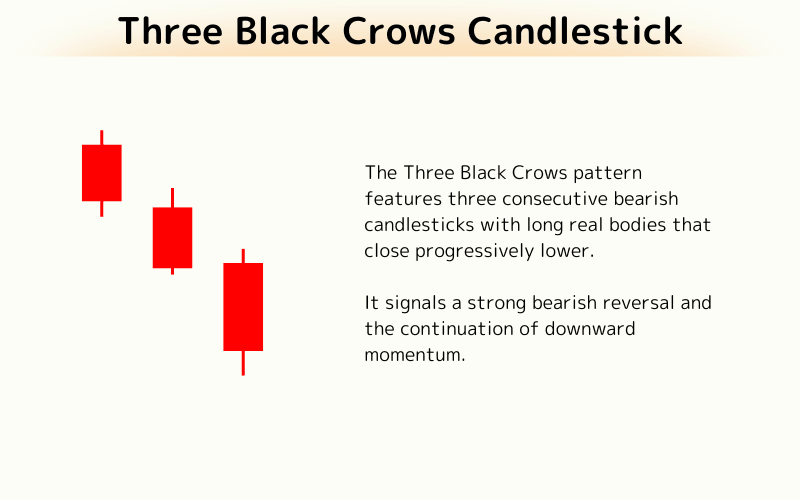
The Three Black Crows pattern features three consecutive bearish candlesticks with long real bodies that close progressively lower. It signals a strong bearish reversal and the continuation of downward momentum.
16. Spinning Top Candlestick
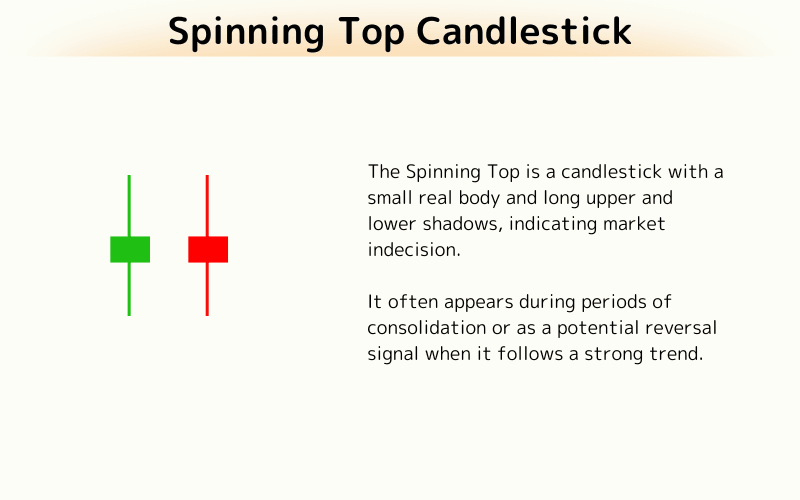
The Spinning Top is a candlestick with a small real body and long upper and lower shadows, indicating market indecision. It often appears during periods of consolidation or as a potential reversal signal when it follows a strong trend.
17. Piercing Line Candlestick
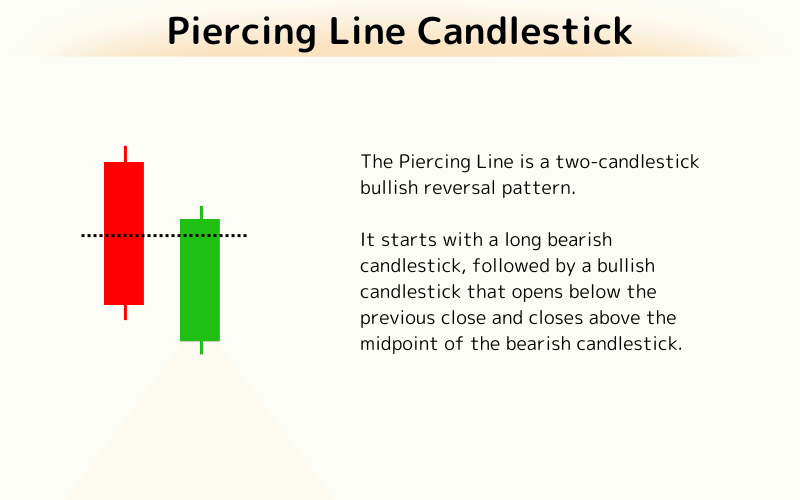
The Piercing Line is a two-candlestick bullish reversal pattern. It starts with a long bearish candlestick, followed by a bullish candlestick that opens below the previous close and closes above the midpoint of the bearish candlestick.
18. Dark Cloud Cover Candlestick
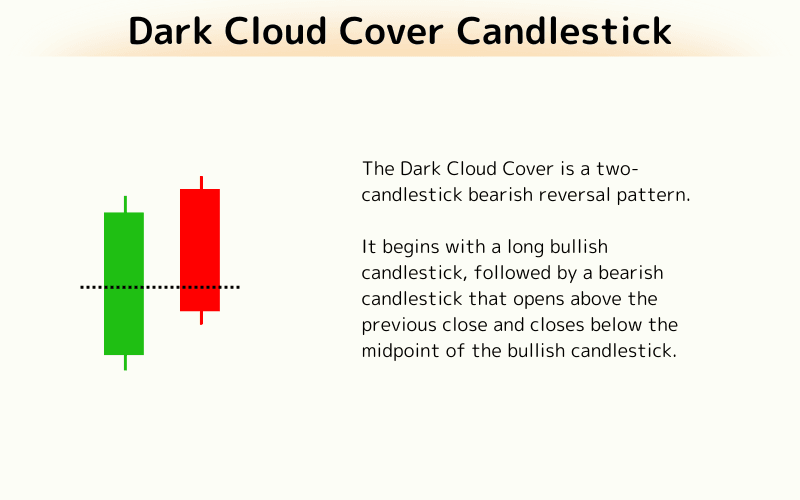
The Dark Cloud Cover is a two-candlestick bearish reversal pattern. It begins with a long bullish candlestick, followed by a bearish candlestick that opens above the previous close and closes below the midpoint of the bullish candlestick.
19. Harami (Bullish and Bearish) Candlestick
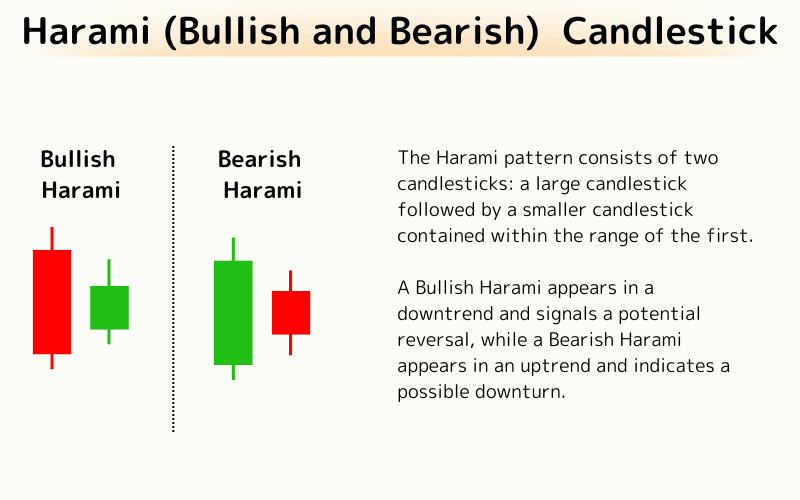
The Harami pattern consists of two candlesticks: a large candlestick followed by a smaller candlestick contained within the range of the first. A Bullish Harami appears in a downtrend and signals a potential reversal, while a Bearish Harami appears in an uptrend and indicates a possible downturn.
20. Tweezer Tops and Bottoms Candlestick
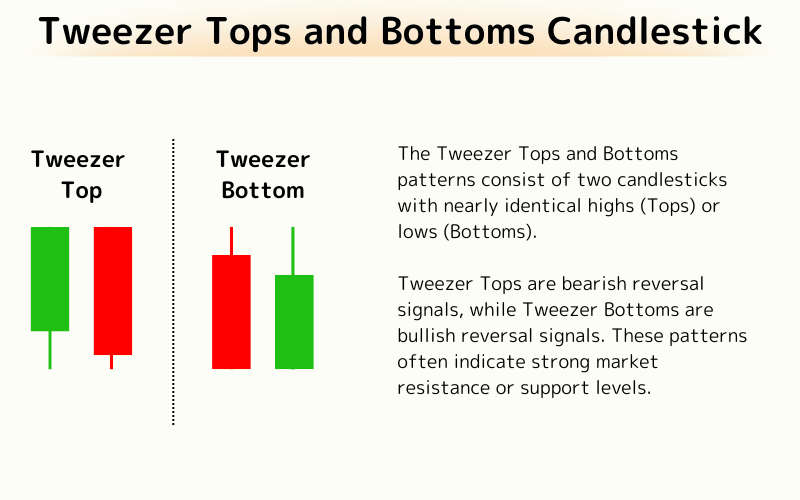
The Tweezer Tops and Bottoms patterns consist of two candlesticks with nearly identical highs (Tops) or lows (Bottoms). Tweezer Tops are bearish reversal signals, while Tweezer Bottoms are bullish reversal signals. These patterns often indicate strong market resistance or support levels.
Summary of 20 Candlestick Patterns
Understanding the 20 candlestick patterns is essential for traders seeking to decode market sentiment and make informed trading decisions. Each pattern, from the straightforward Marubozu to complex formations like Three White Soldiers or Morning Star, reveals unique insights into price action, trend reversals, or continuation signals. By mastering these patterns, traders can better anticipate market movements, enhance their strategies, and gain confidence in their trading decisions. Whether trading forex, stocks, or commodities, candlestick patterns serve as a powerful tool in technical analysis, providing clarity in the dynamic and often unpredictable financial markets.
FAQ
What does the color of a candlestick mean?
Candlestick colors typically signal price direction. Green (or white) usually marks a bullish candle (close above open), while red (or black) marks a bearish candle (close below open). Some platforms invert this convention; check your chart settings.
What do the wicks (shadows) of a candlestick represent?
Wicks show the highest and lowest prices reached during the candle's timeframe. Long wicks indicate high volatility (significant price exploration), while short wicks suggest tight price action. The ratio of body to wick reveals market sentiment and momentum.
How can I use candlestick charts for trading decisions?
Analyze individual patterns (Hammer, Shooting Star) and multi-candle formations (Morning Star, Engulfing) together with trend direction, volume, and technical indicators (moving averages, RSI). Never trade on a single pattern alone — wait for confirmation from multiple signals.
How do candlestick charts compare to other chart types?
Candlesticks pack four data points (OHLC) into a single visual, more information-dense than line charts (close only) and easier to interpret at a glance than bar charts. Their color-coded body and wick design lets traders read market psychology instantly.
Can candlestick charts be used in all markets?
Yes. Candlesticks work universally across stocks, forex, futures, commodities (oil, gold), and crypto. Timeframes can be adjusted from 1-minute (day trading) to monthly (long-term investing), making them suitable for any trading style.
Further Reading
- What is Technical Analysis?
- Moving Averages (MA) Explained
- What is RSI (Relative Strength Index)?
- Reversal Patterns: Complete Guide
- What is a CFD (Contract for Difference)?
Titan FX Trade Strategy Research Lab covers forex (FX), commodities (oil, precious metals, agricultural products), stock indices, U.S. equities, and crypto assets — producing educational content for retail investors across asset classes.
Primary Sources (by category)
- Education & Research: Investopedia: Candlestick, Steve Nison "Japanese Candlestick Charting Techniques" (1991, foundational reference)
- Chart Analysis Standards: StockCharts.com Chart Patterns, TradingView Education
- Historical Background: 18th-century Japanese rice market (Dojima Rice Exchange), Munehisa Homma's candlestick analysis, origins of modern technical analysis