Reversal Patterns: Key Features and Trading Strategies
Reversal Patterns are candlestick patterns used in technical analysis to identify potential trend changes in stocks, forex, or other financial markets.
These patterns indicate when the market might change from one trend to its opposite, such as from an uptrend to a downtrend or from a downtrend to an uptrend.
By analyzing these patterns, traders can capture potential tops or bottoms, allowing them to make trading decisions before a trend changes. This is crucial for optimizing entry and exit points, managing risks, and seeking the best returns.
This article introduces several key reversal patterns, including the Double Top and Double Bottom, Rounded Top and Rounded Bottom, Head and Shoulders Top and Bottom, V-Shaped and Inverted V-Shaped Patterns, Island Top and Island Bottom, and Diamond Top and Diamond Bottom patterns, along with their features and trading strategies.
Whether you're a novice trader or an experienced market participant, mastering these reversal patterns will be an important step toward enhancing your market analysis skills.

- Reversal patterns appear at the end of a trend and signal that the market may turn
- Main types: double top/bottom, head and shoulders, rounding, V/inverted-V, island reversal, diamond
- Head and shoulders is statistically the most reliable (about 4% failure rate, ~89% target hit)
- Confirmation needs a neckline/key-level break on volume to avoid false signals
- Combine with volume, oscillators and other tools, and set strict stops
- 1. Double Patterns (Double Top and Double Bottom)
- 2. Rounded Patterns (Rounded Top and Rounded Bottom)
- 3. Head and Shoulders Patterns
- 4. V-Shaped and Inverted V-Shaped Patterns
- 5. Island Patterns (Island Top and Island Bottom)
- 6. Diamond Patterns (Diamond Top and Diamond Bottom)
- 7. Pattern Reliability Comparison
- 8. Statistical Performance of Each Pattern
- 9. Best Patterns and Timeframes by Trading Style
- 10. MT4/MT5 Alert Setup Guide
- 11. Frequently Asked Questions
- 12. Summary of Candlestick Reversal Patterns
1. Double Patterns (Double Top and Double Bottom)
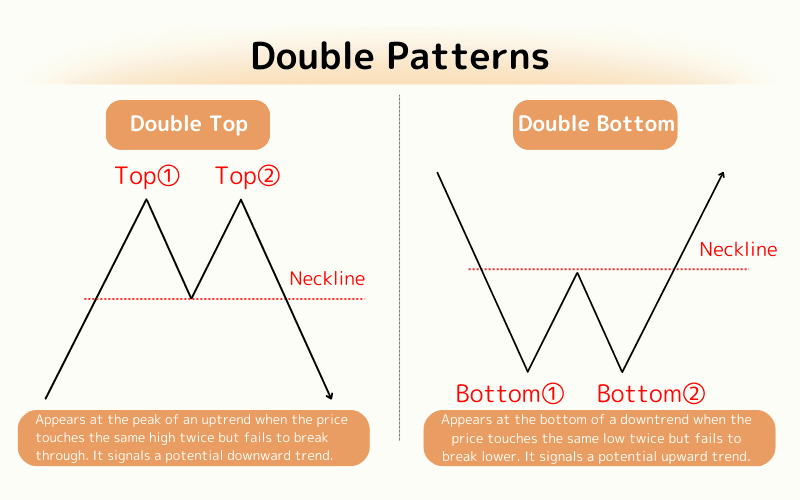
The Double Pattern (Double Top and Double Bottom) is a common trend reversal pattern that forms when the price fails to break the same horizontal line in two attempts, showing strong resistance or support at a certain price point.
This pattern consists of two nearly equal highs or lows, separated by a distinct valley or peak, forming a prominent M or W shape.
Double Pattern includes:
Double Top: Appears at the peak of an uptrend when the price touches the same high twice but fails to break through. It signals a potential downward trend.
Double Bottom: Appears at the bottom of a downtrend when the price touches the same low twice but fails to break lower. It signals a potential upward trend.
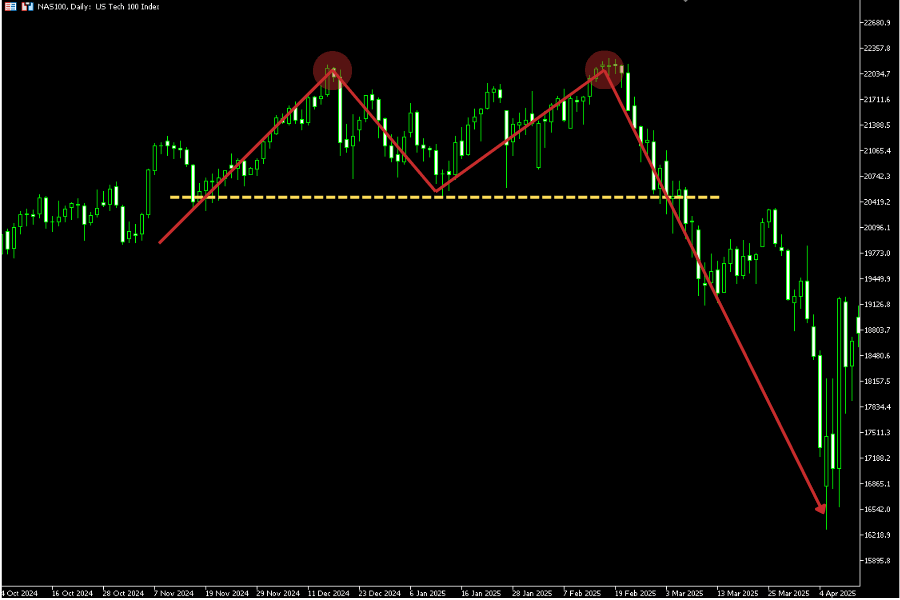
Real chart example:
2. Rounded Patterns (Rounded Top and Rounded Bottom)
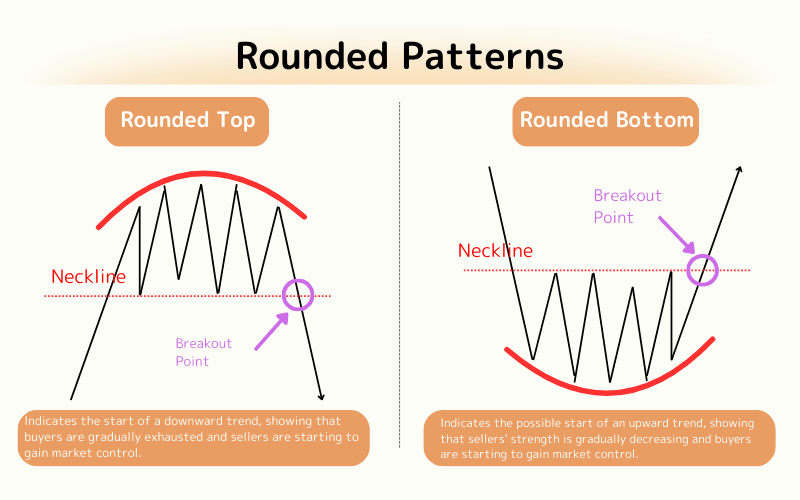
The Rounded Pattern (Rounded Top and Rounded Bottom) is another common trend reversal pattern seen in the market. It forms through slow and gradual price movements, indicating a natural transition in market trends within a specific price range.
This pattern consists of a gradual price increase or decrease, ultimately forming a smooth circular or semi-circular shape, resembling an inverted or upright bowl.
Rounded Pattern includes:
Rounded Top: Typically appears at the peak of an uptrend when the price rises gradually and then slowly forms a rounded top, indicating the beginning of a downtrend. This suggests the buyers are exhausted, and sellers begin to take control of the market.
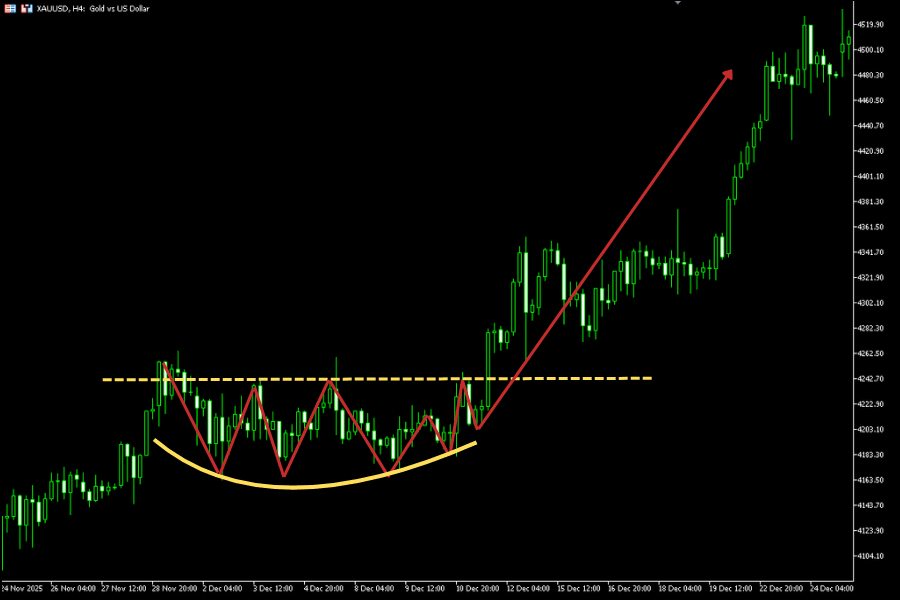
Rounded Bottom: Typically appears at the bottom of a downtrend when the price gradually falls and then slowly rises to form a rounded bottom, signaling the potential start of an uptrend. This suggests the selling pressure is weakening, and buyers are entering the market to take control of the trend.
Real chart example:
3. Head and Shoulders Patterns (Head and Shoulders Top and Bottom)
The Head and Shoulders Pattern is a very well-known trend reversal pattern in technical analysis, widely used to identify turning points at market tops and bottoms.
These patterns consist of three consecutive peaks or valleys, with the middle peak or valley (head) being the highest, and the two side peaks or valleys (shoulders) being smaller, forming a distinctive visual shape similar to a person's head and shoulders.
Head and Shoulders Pattern includes:
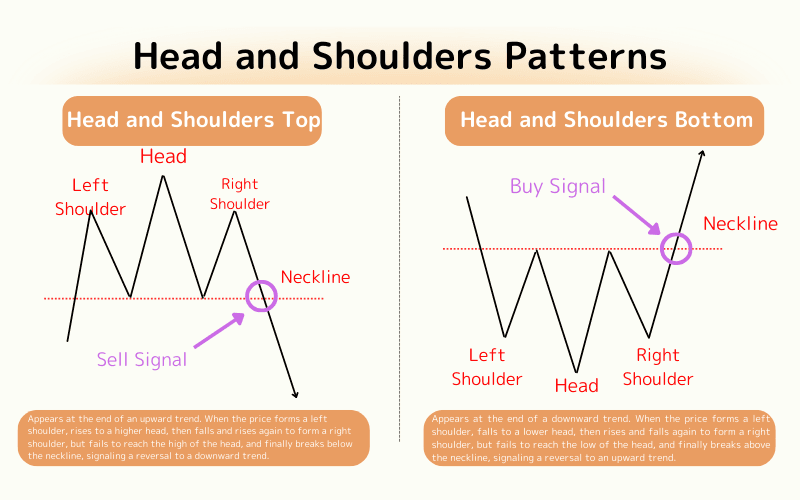
Head and Shoulders Top: Appears at the end of an uptrend when the price forms the left shoulder, rises to a higher head, then declines and rises again to form the right shoulder, but fails to reach the height of the head. The price then breaks below the support line (neckline), marking the trend reversal into a downtrend.
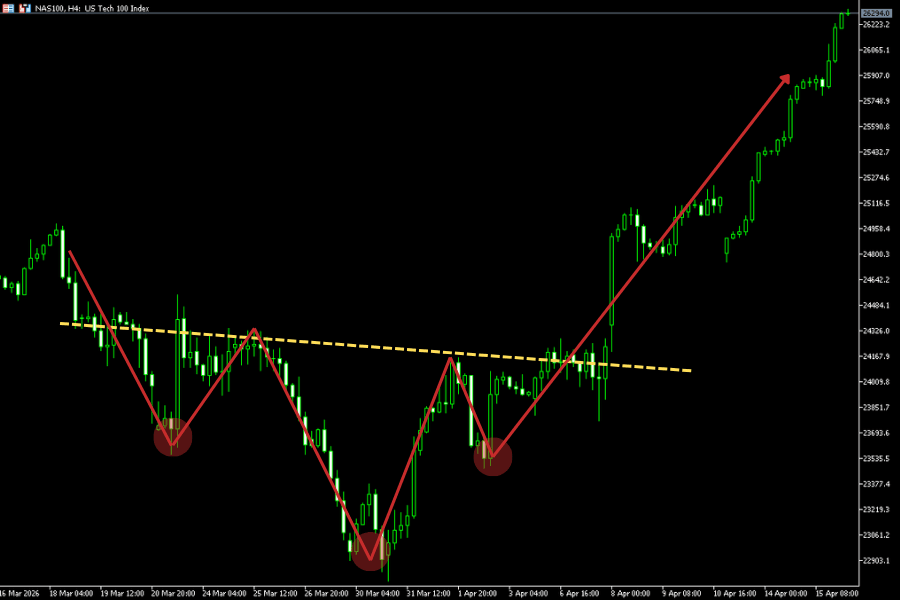
Head and Shoulders Bottom: Appears at the end of a downtrend when the price forms the left shoulder, falls to a lower head, then rises and falls again to form the right shoulder, but fails to reach the depth of the head. The price then breaks above the resistance line (neckline), marking the trend reversal into an uptrend.
Real chart example:
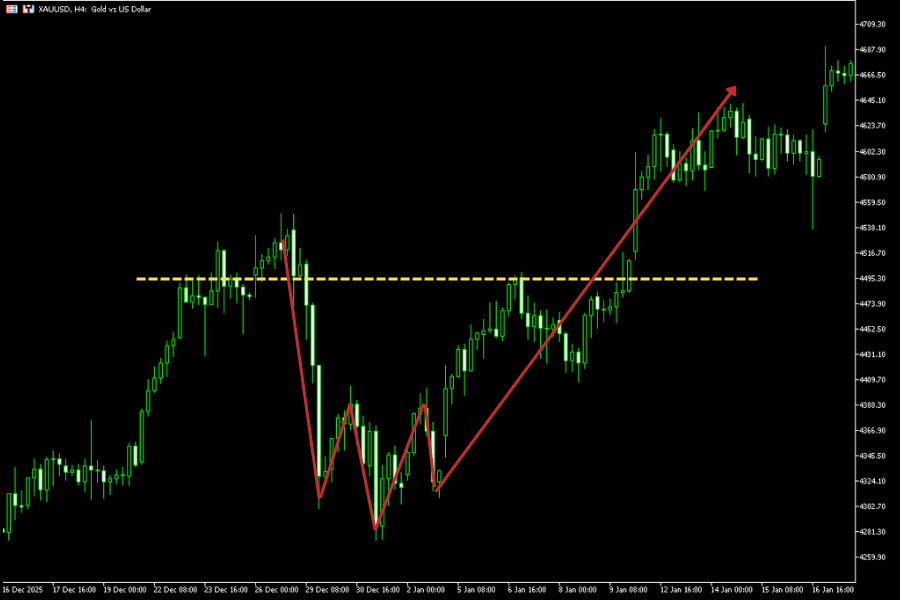
4. V-Shaped and Inverted V-Shaped Patterns
The V-Shaped and Inverted V-Shaped Patterns are quick and clear market reversal indicators, typically showing sudden and dramatic changes in market sentiment.
These patterns are named for their sharp and distinct V or inverted V shape, indicating that the price rapidly reaches a peak or bottom and then immediately reverses.
V-Shaped and Inverted V-Shaped include:
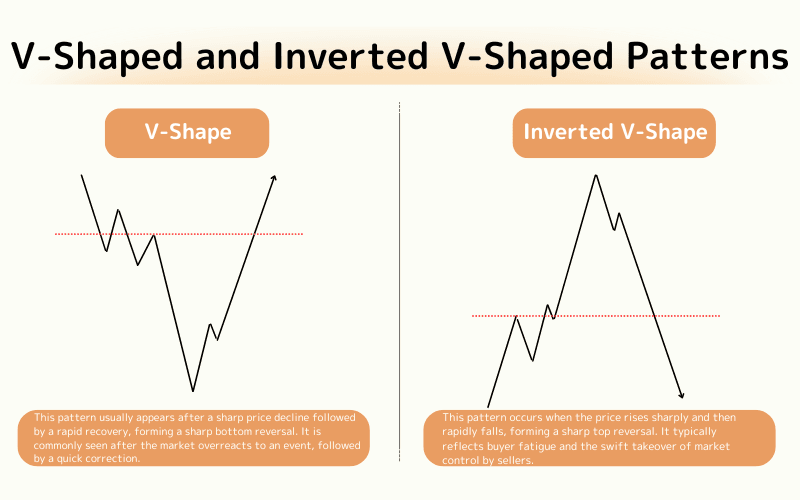
V-Shape: This pattern usually appears after a sharp price decline followed by a rapid recovery, forming a sharp bottom reversal. It is commonly seen after the market overreacts to an event, followed by a quick correction.
Inverted V-Shape: This pattern occurs when the price rises sharply and then rapidly falls, forming a sharp top reversal. It typically reflects buyer fatigue and the swift takeover of market control by sellers.
Real chart example:
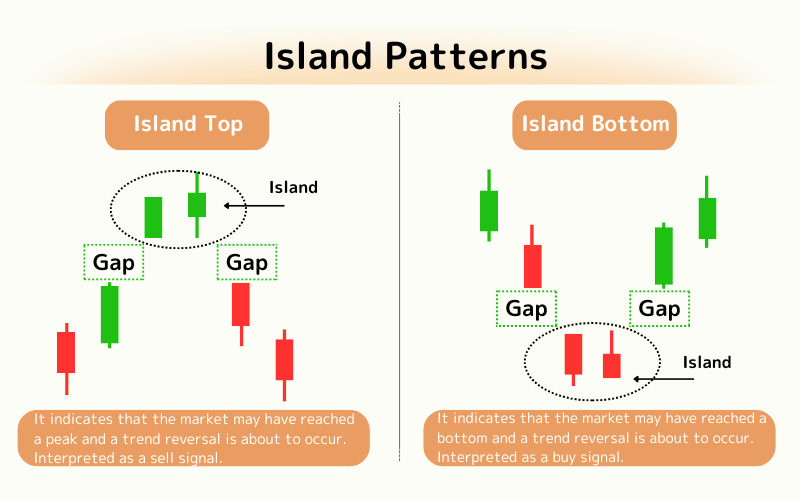
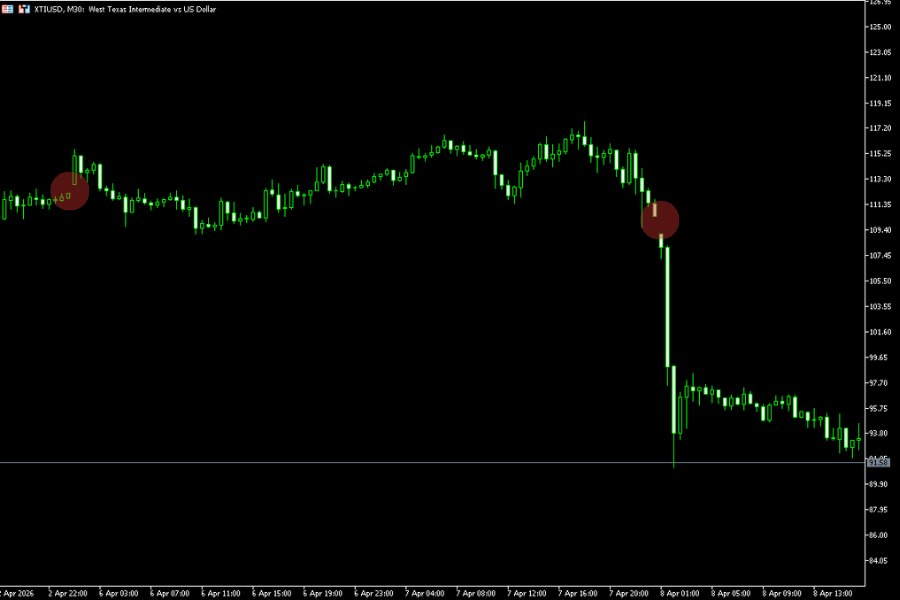
5. Island Patterns (Island Top and Island Bottom)
The Island Pattern (Island Top and Island Bottom) forms a unique reversal signal due to the gaps in the price chart.
This pattern appears as isolated areas of the chart separated by gaps on both sides, resembling an island.
Island Pattern includes:
Island Top: This pattern appears at the peak of an uptrend when one or more days of price action are completely separated by gaps on both sides, signaling the end of the uptrend and a potential downward move.
Island Bottom: This pattern appears at the bottom of a downtrend, also formed by gaps, signaling the end of the downtrend and a potential upward reversal.
Real chart example:
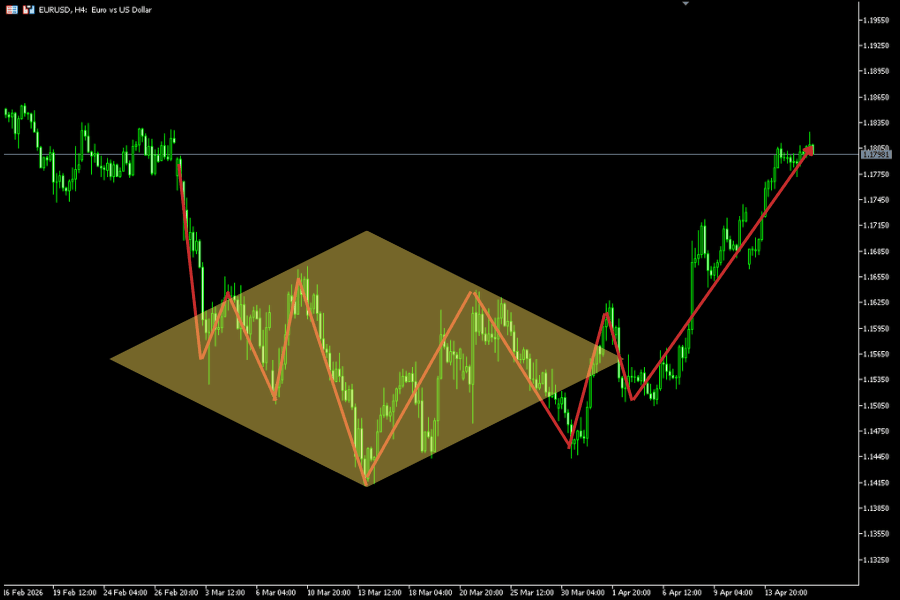
6. Diamond Patterns (Diamond Top and Diamond Bottom)
The Diamond Pattern (Diamond Top and Diamond Bottom) is a complex pattern in technical analysis used to identify market turning points.
This pattern consists of an initial expansion followed by a subsequent contraction in price, forming a shape similar to a diamond.
Diamond Pattern includes:
Diamond Top: Typically forms at the top of a bullish trend, signaling a potential trend reversal. In this pattern, the price first expands and then contracts, eventually breaking below the support line, indicating the beginning of a downtrend.
Diamond Bottom: The Diamond Bottom pattern forms at the bottom of a bearish trend, signaling a potential reversal to the upside. The price expansion and contraction eventually break above the resistance line, marking the beginning of an uptrend.
Real chart example:
7. Pattern Reliability Comparison
The reliability of reversal patterns varies significantly based on formation time, frequency of occurrence, and market conditions. The table below provides a quantitative assessment of each pattern.
| Pattern | Reliability | Formation Period | Frequency | Best Market | Confirmation Signal |
|---|---|---|---|---|---|
| Head and Shoulders | 5/5 | Long-term (weeks) | Medium | Forex, Indices | Neckline break + volume surge |
| Double (Top/Bottom) | 4/5 | Medium-term | High | All markets | Volume at breakout |
| V-Shape/Inverted V | 3/5 | Very short-term | Rare | News-driven | Sharp reversal in 2-3 bars |
| Rounding | 4/5 | Very long-term (months) | Low | Indices | Gradual shift in momentum |
| Island | 4/5 | Short-term | Rare | Major FX pairs | Gaps on both sides |
| Diamond | 3/5 | Medium-term | Very rare | Major FX pairs | Expansion to contraction |
Head and Shoulders is widely regarded as the most reliable reversal pattern. While it takes longer to form, the signal upon completion is powerful. V-shaped patterns can capture rapid reversals but are prone to false signals, making it essential to use them alongside other indicators.
8. Statistical Performance of Each Pattern
According to Thomas Bulkowski's "Encyclopedia of Chart Patterns," the statistical performance of major reversal patterns is as follows.
| Pattern | Avg. Target Hit Rate | Breakout Failure Rate | Avg. Formation Period |
|---|---|---|---|
| Head and Shoulders (Top) | ~89% of target | 4% | ~3 months |
| Head and Shoulders (Bottom) | ~74% of target | 5% | ~5 months |
| Double Top | ~72% of target | 16% | ~2 months |
| Double Bottom | ~66% of target | 11% | ~3 months |
| Rounded Top | ~52% of target | 28% | ~6 months |
| Rounded Bottom | ~62% of target | 18% | ~6 months |
These figures are based on historical stock market data. Results may differ in the forex market due to differences in liquidity and leverage.
Patterns with higher target hit rates make it easier to set price targets and are more useful for risk-reward calculations. Head and Shoulders (Top) is particularly notable with an 89% hit rate and is widely relied upon by professional traders.
Pay close attention to breakout failure rates as well. The 16% failure rate for Double Tops means a relatively higher risk of reversal after breakout, making stop-loss placement essential.
Source: Thomas Bulkowski, Encyclopedia of Chart Patterns (3rd Edition, Wiley)
9. Best Patterns and Timeframes by Trading Style
The effectiveness of reversal patterns varies depending on your trading style and timeframe. The table below shows the optimal pattern and timeframe combinations for each style.
| Trading Style | Recommended Timeframe | Best Patterns | Key Points |
|---|---|---|---|
| Scalping | 1min to 15min | V-Shape/Inverted V, Double | Target quick reversals; watch for false signals |
| Day Trading | 15min to 1H | Double, Head and Shoulders | Focus on patterns completing within the session |
| Swing Trading | 4H to Daily | Head and Shoulders, Island | Capture multi-day to multi-week trend changes |
| Position Trading | Weekly to Monthly | Rounding, Diamond | Capture major trend reversals for larger moves |
Scalpers target the quick reversals of V-shaped patterns on 1-minute or 5-minute charts. However, shorter timeframes produce more noise, so combining them with volume or oscillator indicators like RSI is essential.
Day traders find the Double pattern on 15-minute to 1-hour charts the most balanced, with clear entry points and straightforward take-profit and stop-loss placement.
Swing traders who focus on Head and Shoulders patterns on the daily chart can more easily capture reliable trend reversals.
10. MT4/MT5 Alert Setup Guide for Reversal Patterns on Titan FX
To effectively incorporate reversal patterns into your daily trading, setting alerts at key price levels on your charts can greatly improve efficiency. Below is a step-by-step guide for setting up alerts on Titan FX MT4/MT5.
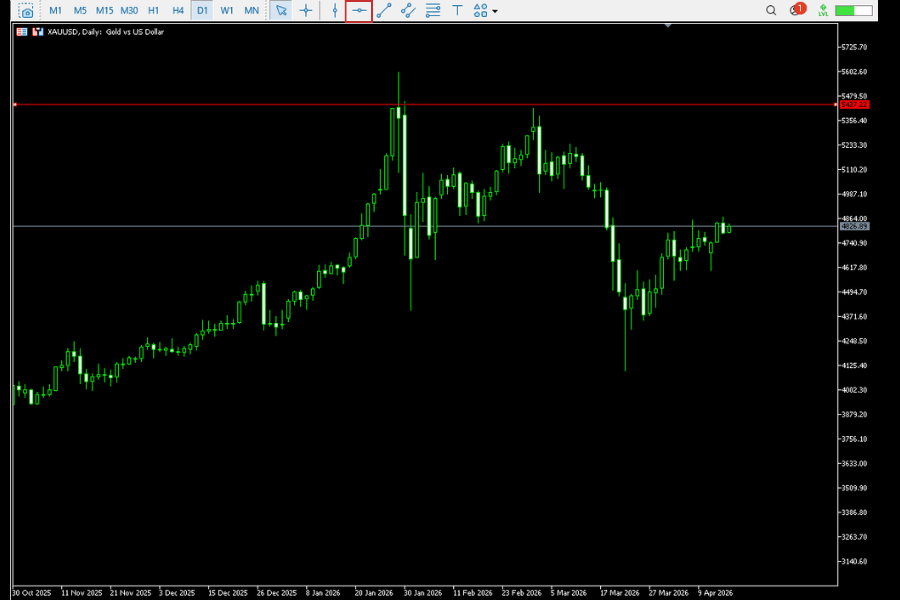
Step 1: Draw a Trigger Line on the Chart
From the MT4/MT5 drawing toolbar, select "Horizontal Line" and place it at the breakout point where the pattern would be confirmed, such as the neckline or key support/resistance level. For a Double Top, use the valley low as your reference. For Head and Shoulders, draw the neckline connecting the left and right shoulder lows.
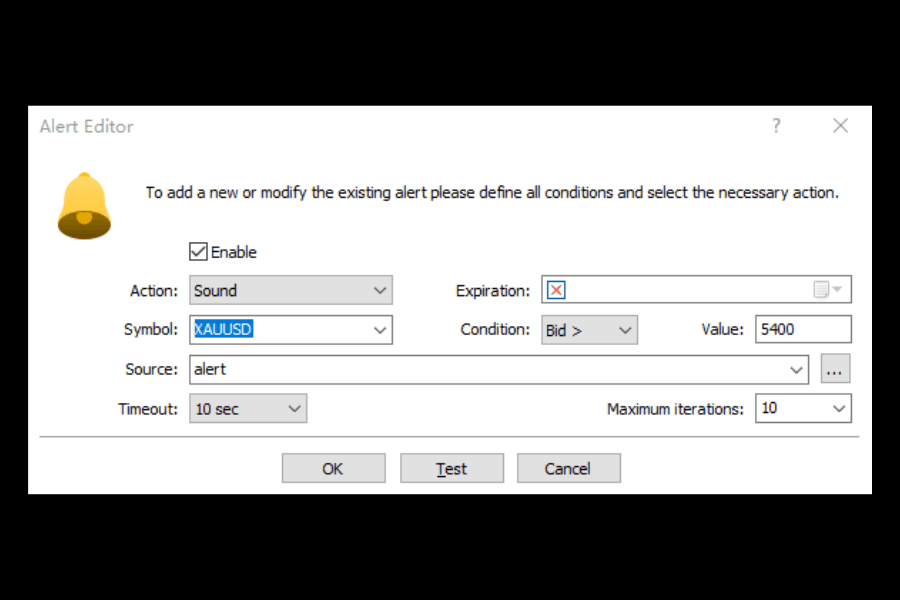
Step 2: Set the Alert Condition
Right-click on the chart and select "Alert" from the trade menu. Set the condition to "Bid crosses below (or above) specified price" and enter the price of the trigger line you drew. You can choose from "Sound," "Pop-up," or "Email" as the alert type.
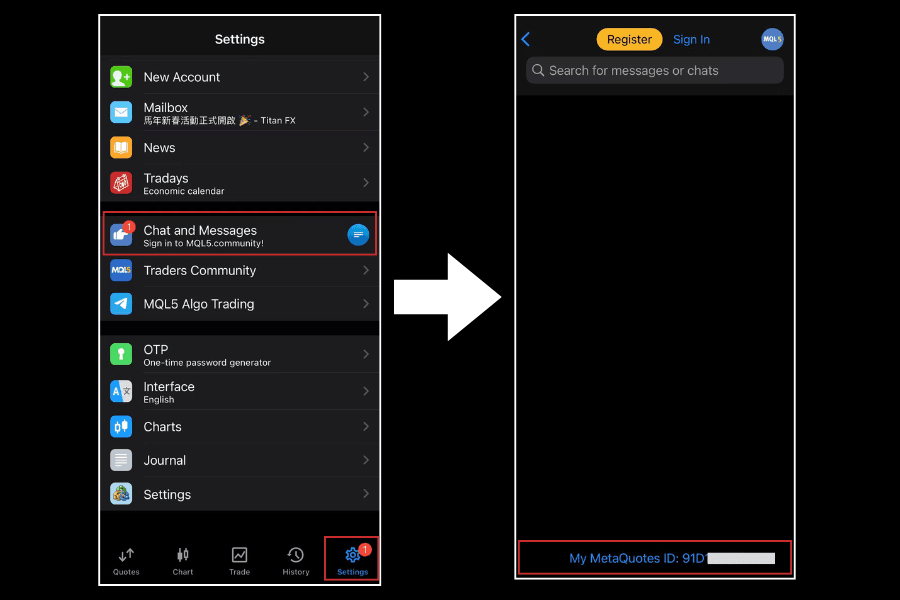
Step 3: Enable Mobile Notifications (Optional)
Install the MT4/MT5 mobile app, then open "Options" from the "Tools" menu on the desktop version. Navigate to the "Notifications" tab and configure push notifications. Enter your MetaQuotes ID so you can catch breakout moments even when away from your desk.
Titan FX offers free demo accounts. Try the alert features in a risk-free environment first. Demo accounts can be opened on the official website in minutes and include full access to all charting features available on live accounts.
11. Frequently Asked Questions
Q1. What is the difference between reversal and continuation patterns?
Reversal patterns signal a trend change (from uptrend to downtrend or vice versa), while continuation patterns (flags, pennants, wedges, etc.) indicate that the existing trend will resume after a temporary consolidation. Correctly distinguishing between the two is essential for making sound trading decisions.
Q2. Which reversal pattern is the most reliable?
Statistically, the Head and Shoulders pattern (especially the top formation) is considered the most reliable. It has a breakout failure rate of just 4% and a target hit rate of approximately 89%. However, no pattern should be used in isolation. Combining it with volume analysis and oscillator indicators further improves accuracy.
Q3. Are reversal patterns effective in the forex market?
Yes, reversal patterns are widely used in the forex market. However, since forex trades 24 hours a day, gaps are less common, making Island patterns less frequent than in stock markets. On the other hand, Double patterns and Head and Shoulders formations appear frequently in forex and maintain strong effectiveness.
Q4. How can you tell if a pattern is a false signal?
Volume confirmation is the most important criterion. If a breakout occurs without accompanying volume increase, the likelihood of a false signal rises. Additionally, checking for divergences using oscillators such as RSI or MACD, and verifying that the same pattern appears across multiple timeframes, are effective methods.
Q5. Should I wait for confirmation before entering a trade on a reversal pattern?
As a general rule, it is recommended to enter after the pattern completes and the breakout is confirmed. Entering during pattern formation increases the risk of the pattern failing and becoming a false signal. Beginners in particular should strictly follow the principle of entering after confirmation and always set clear stop-loss levels.
Q6. Can I practice reversal patterns on a demo account?
Yes, Titan FX demo accounts provide the same charting tools as the live market at no cost, allowing you to practice pattern recognition and alert setup in a risk-free environment. It is recommended to practice extensively on a demo account first, then transition to a live account once you are confident in identifying patterns.
For the latest charting tools, visit theXAUUSD instrument page.
Practice Reversal Patterns with Titan FX Up to 1:2,000 leverage (up to 1:1,000 on Standard and Blade accounts, and up to 1:2,000 on Micro accounts), low spreads, and flexible long/short trading. Available across Zero Standard, Zero Blade, and Zero Micro account types.
12. Summary of Candlestick Reversal Patterns
In technical analysis, reversal patterns play a key role in helping traders identify potential market tops or bottoms, allowing them to predict potential trend reversals.
This article discussed six major reversal patterns, each with its unique characteristics and trading strategies, including:
Double Top and Double Bottom:
Formed when the price fails to break the same level in two attempts, indicating strong resistance or support.
Rounded Top and Rounded Bottom:
Formed through smooth semi-circular price movements, showing gradual weakening of the trend and potential reversal.
Head and Shoulders Top and Bottom:
Composed of three peaks or valleys, with the middle point being the highest or lowest, signaling the end of a trend and a reversal.
V-Shape and Inverted V-Shape:
Formed through sharp price movements, indicating a rapid shift in market sentiment.
Island Top and Island Bottom:
Formed by isolated areas on the chart separated by price gaps, signaling sudden market reversals.
Diamond Top and Diamond Bottom:
Formed through price expansion and subsequent contraction, indicating potential market tops or bottoms.
By recognizing and applying these reversal patterns, traders can more effectively formulate entry and exit strategies, optimize risk management, and improve the accuracy of their trading decisions.
However, despite the valuable insights these patterns provide, traders should always combine them with other technical tools and market analysis to validate and strengthen trading signals, ensuring more comprehensive and robust investment decisions.
Further Reading
The financial markets research team at Titan FX. We produce educational content across a broad range of instruments, including forex (FX), commodities (crude oil, precious metals, agricultural products), equity indices, U.S. stocks, and crypto assets.
Primary Sources (by Category)
- Technical analysis references: Edwards & Magee — Technical Analysis of Stock Trends; Thomas N. Bulkowski — Encyclopedia of Chart Patterns (pattern statistics); Investopedia — reversal pattern definitions
- Trading practice: Titan FX — MT4/MT5 reversal-pattern alerts and technical-analysis education; TradingView — Chart Patterns