Head and Shoulders Top and Bottom: Structure, Measuring Rule, and Trading Strategies
The Head and Shoulders pattern—both the Top (bearish reversal) and the Bottom / Inverse Head and Shoulders (bullish reversal)—has been regarded as the most reliable chart reversal pattern since Edwards and Magee published Technical Analysis of Stock Trends in 1948. Thomas Bulkowski's Encyclopedia of Chart Patterns (2nd ed. 2005) documented a 93% success rate for Head and Shoulders Tops and 83% for Inverse Head and Shoulders Bottoms across 38,500+ occurrences. Updated 2021-2023 research by Bulkowski tracking post-2008 market regimes revised the failure rate to approximately 7% for Tops (still exceptionally low), reflecting greater algorithmic participation in modern markets.
This guide dissects the four structural components (left shoulder, head, right shoulder, neckline), the psychology of exhaustion, volume confirmation (the staircase pattern), three mandatory breakout conditions, the measuring rule, fakeout filtering, multi-indicator confluence with MACD divergence, RSI extremes, and Fibonacci retracements, and landmark historical cases spanning Dow 1929, Nikkei 1989, Nasdaq 2000, the 2008 Global Financial Crisis, Tesla 2022, and Bitcoin 2017-2018. Related reading: Reversal Patterns overview, Double Top and Double Bottom, Neckline definition, and MACD indicator.
- Head and shoulders top/bottom are classic trend-reversal patterns codified by Edwards & Magee
- The top (left shoulder, head, right shoulder) forms at the end of an uptrend; a neckline break signals a turn down
- The bottom is its mirror image, forming at the end of a downtrend; a neckline break signals a turn up
- Confirmation needs a neckline break on rising volume; the target ≈ the vertical distance from head to neckline
- Watch for false breaks — confirm with volume, a neckline retest and other indicators before entering
- 1. Why the Head and Shoulders Pattern Deserves Mastery
- 2. Head and Shoulders Top vs Bottom: Definitions and Differences
- 3. The Four Structural Components
- 4. Formation Process and Market Psychology
- 5. Three Mandatory Breakout Confirmation Conditions
- 6. The Measuring Rule and Target Price Calculation
- 7. Fakeout Signals and Filtering Conditions
- 8. Comparison with Other Reversal Patterns
- 9. Confluence with Other Technical Indicators
- 10. Historical Cases Across Global Markets
- 11. Trading Playbook and Risk Management
- 12. Frequently Asked Questions
- 13. Summary and Key Takeaways
1. Why the Head and Shoulders Pattern Deserves Mastery
The Head and Shoulders formation earned its "textbook-grade" status through three defining traits: an unambiguous geometry, a transparent psychological narrative, and a quantifiable price objective. Most reversal patterns (V-reversals, rounding tops, island reversals) rely on subjective judgment; the Head and Shoulders possesses three distinct peaks (or troughs) and a well-defined neckline, letting any trader apply the same identification standard. This is why it remains one of the few patterns that can be back-tested systematically and scanned algorithmically across thousands of instruments.
1.1 Historical Authority and Academic Endorsement
Edwards and Magee dedicated an entire chapter to the pattern in their 1948 textbook, calling it "the most trustworthy of all reversal patterns." The 11th edition (2018, updated by WHC Bassetti) preserves this ranking despite seventy-plus years of market evolution. Dow Theory, Gann school, Elliott Wave, and Wyckoff practitioners diverge on many signals but converge on the validity of the Head and Shoulders structure.
Bulkowski's Encyclopedia of Chart Patterns aggregated over 38,500 pattern occurrences across US equities, commodities, and forex between 1991 and 2005. Key findings:
- Head and Shoulders Top: 4% failure rate (original), revised to ~7% in post-2008 algorithmic environments
- Inverse Head and Shoulders Bottom: 11% failure rate
- Average decline after valid Top breakout: 22%
- Average advance after valid Bottom breakout: 38%
Even with a five-percentage-point accuracy discount, the pattern dramatically outperforms most single candlestick signals (hammer, engulfing, etc.).
1.2 Applicable Markets
The pattern appears across every major asset class:
- Equity indices: Dow Jones, S&P 500, Nasdaq 100, Nikkei 225—weekly and monthly charts
- Individual stocks: Apple, Tesla, Nvidia have formed daily H&S tops during corrections
- Forex: USDJPY, EURUSD, GBPUSD on daily and weekly frames
- Commodities: WTI Crude, Brent, Gold, Copper on weekly and monthly
- Cryptocurrencies: Bitcoin and Ethereum formed textbook H&S tops at 2017-2018 and 2021-2022 cycle highs
Cross-market universality derives from the "supply–demand–psychology–volume" four-factor model, not from any asset-specific structural trait.
1.3 Three Prerequisites for Valid Interpretation
Three conditions must hold:
- Clear prior trend: A Head and Shoulders Top must follow an established uptrend; a Bottom must follow a downtrend. Without a trend to reverse, a superficially similar three-peak formation is merely ranging price action.
- Neckline must be decisively broken: A closing price—not intraday wick—must cross the neckline, confirmed by volume expansion.
- Timeframe must be adequate: Weekly and daily charts carry strong statistical validity. Intraday charts (below 1 hour) are dominated by noise, and the pattern's statistical reliability collapses.
Ignoring any prerequisite converts an apparently textbook pattern into a high-probability loss.
2. Head and Shoulders Top vs Bottom: Definitions and Differences
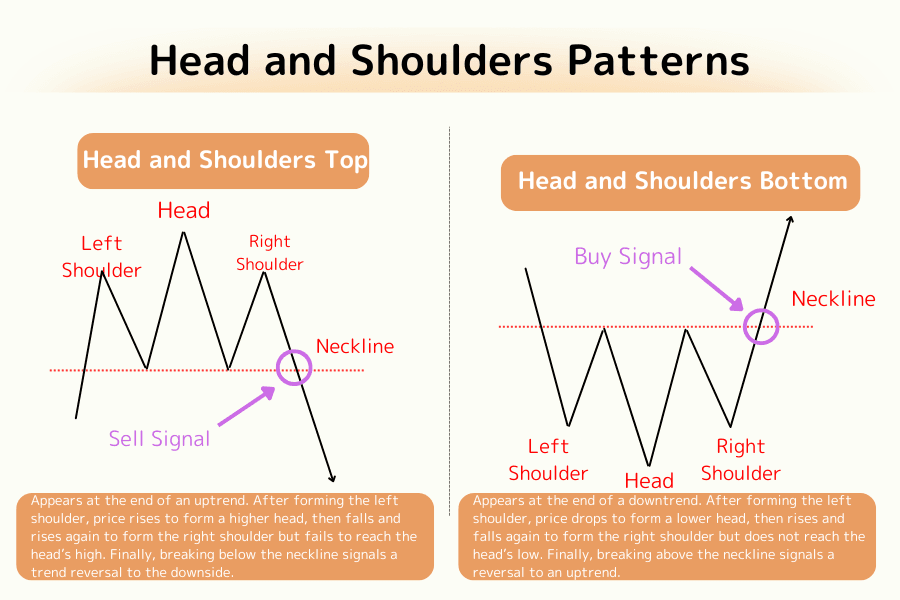
2.1 Head and Shoulders Top (Bearish Reversal)
The Head and Shoulders Top appears at the terminal phase of an established uptrend and signals exhaustion of bullish momentum. Its silhouette resembles a human head between two shoulders: the left shoulder prints a high, then pulls back; the head prints a higher high, then retraces; the right shoulder attempts a new high but fails, reaching only a level close to (or slightly below) the left shoulder. Connecting the two retracement lows between these peaks produces the neckline. When price closes below the neckline with volume confirmation, the pattern is confirmed and a sustained decline typically follows.
Quantitative acceptance criteria:
- The head should exceed both shoulders by at least 2-5% (otherwise the formation may be a Triple Top)
- Shoulder height asymmetry should remain within ±10%
- Breakout volume should exceed the 20-day average by at least 50% (ideally 100%+)
2.2 Inverse Head and Shoulders Bottom (Bullish Reversal)

The Inverse Head and Shoulders Bottom is the mirror image, appearing at the terminal phase of an established downtrend and signaling exhaustion of bearish momentum. The left shoulder marks a low and bounces; the head carves a deeper low and rallies; the right shoulder prints a higher low, unable to reach the head's depth. Connecting the two rebound highs between troughs forms the neckline. A closing break above the neckline confirms a bullish reversal.
Three practical differences from the Top pattern:
- Longer formation time: Accumulation phases require multiple tests and shakeouts, so the Bottom typically spans 30-50% more time than the Top
- Clearer volume staircase: The descending-then-ascending volume pattern (large on left shoulder, smaller on head, largest on breakout) is more distinct
- Advance often exceeds the measured target: Bulkowski's data shows a 38% average advance versus 22% average decline for Tops—an asymmetry rooted in secular bull-market dynamics
2.3 The Mirror Relationship
Both share five structural features:
- Three peaks or troughs
- A central extreme (head) more pronounced than the flanking shoulders
- Two approximately symmetric shoulders
- A neckline connecting the two inter-peak troughs (or inter-trough peaks)
- Staircase volume attenuation from left shoulder through head to right shoulder
Key differences:
| Aspect | H&S Top | Inverse H&S Bottom |
|---|---|---|
| Prior trend | Uptrend | Downtrend |
| Breakout direction | Close below neckline | Close above neckline |
| Signal | Bearish, short setup | Bullish, long setup |
| Formation duration | Shorter | Longer |
| Average move | 22% decline | 38% advance |
| Success rate | 93% (original) / ~93% (updated) | 83% |
2.4 Position in the Trend and Context
The pattern must appear after a clearly established prior trend, not inside a trading range. Validation tools:
- 20-day moving average slope
- 50/200-day moving average crossover (golden or death cross context)
- Weekly MACD position relative to zero line
- Dow Theory primary trend classification (see Dow Theory glossary)
A three-peak silhouette inside a multi-month sideways range is not a Head and Shoulders Top—there is no uptrend to reverse. This is the most common misidentification among beginners.
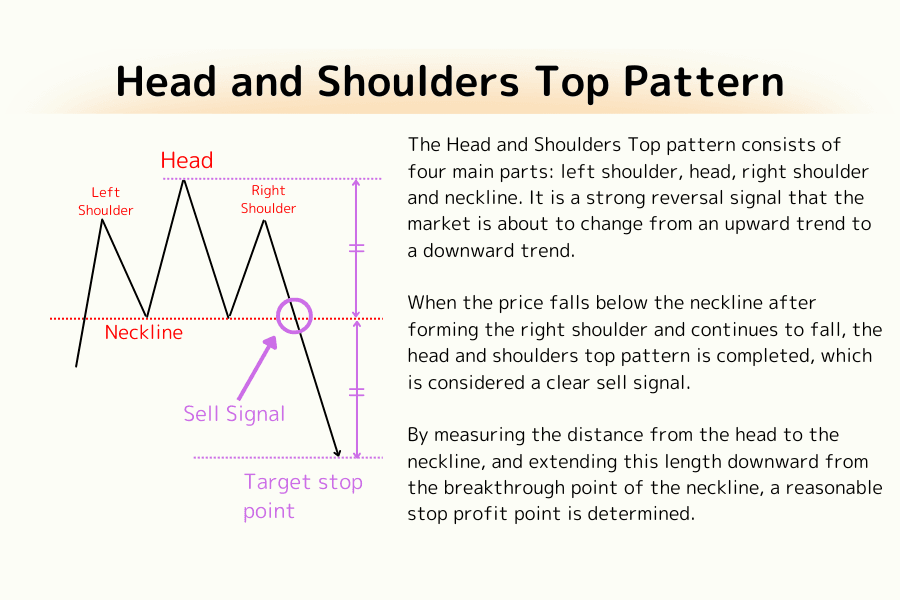
3. The Four Structural Components
3.1 Left Shoulder
The left shoulder represents the first sign of momentum exhaustion within the prevailing uptrend. Price reaches a new high, then pulls back—either on profit-taking or short-term overheating—forming the first peak. Most traders dismiss this pullback as a "healthy correction," unaware that it is the opening act of a reversal.
Key observations:
- Volume at the left shoulder high usually represents the single largest volume peak of the entire uptrend
- The pullback depth typically measures 38.2-50% of the prior advance (consistent with Fibonacci retracement levels)
- Time from left shoulder peak to the first trough averages 1-3 weeks on daily charts, 1-3 months on weekly
3.2 Head
The head is the decisive component. From the left shoulder trough, price rallies through the left shoulder high to set a new high—this new high is the head. Superficially, the uptrend appears intact. Yet volume during this rally is typically lower than volume at the left shoulder—the classic Wyckoff "volume-less new high," the core exhaustion signal.
Key observations:
- Head should exceed the left shoulder by at least 2-5% (the more pronounced, the more reliable)
- Volume reduction of 15%+ at the head versus the left shoulder significantly raises reversal probability
- The head may resolve as 1-3 closely spaced sub-peaks (double or triple head), in which case the highest closing price defines the "head"
- Retracement from the head to the neckline should be similar in depth to the left shoulder pullback (substantially deeper retracement may indicate a Double Top formation instead)
3.3 Right Shoulder
The right shoulder represents the bulls' "last attempt." From the neckline, price rallies but cannot reach the head's high, typically peaking near—or slightly below—the left shoulder high. This failure to mark a new high confirms that the uptrend has ended.
Key observations:
- Right shoulder high is usually 3-10% below the left shoulder high (approximately equal is acceptable; significantly lower indicates even weaker momentum)
- Right shoulder volume should be the smallest of the three peaks—if right shoulder volume increases, pattern validity should be questioned
- Time span is typically comparable to the left shoulder (±30% tolerance)
- The decline from the right shoulder is the true bearish initiation
3.4 Neckline
The neckline connects the two inter-shoulder retracement lows (Top) or rally highs (Bottom). It is the pattern's critical support/resistance zone and the breakout trigger. For a full glossary definition, see Neckline.
Three possible neckline slopes:
- Horizontal: Both lows/highs roughly equal—most textbook-perfect and most reliable
- Upward-sloping: In a Top, right-side low higher than left-side (residual bullish energy); decline after breakout often exceeds the measured target
- Downward-sloping: In a Top, right-side low below left-side (bears already active); prone to fakeouts due to early breaks
Interpretive rules:
- The neckline need not be perfectly straight; slight curvature is acceptable
- Once a closing price crosses the neckline with volume expansion, the pattern is confirmed
- After breakout, support-resistance polarity flips: former support becomes resistance (Top), former resistance becomes support (Bottom)
4. Formation Process and Market Psychology
A Head and Shoulders pattern is not merely geometry but a visualization of a trader-emotion cycle. Understanding the underlying psychology separates authentic patterns from superficial look-alikes.
4.1 Head and Shoulders Top: Three Stages of Bullish Exhaustion
Stage A — Left Shoulder: Excessive Optimism The uptrend has lasted months. Retail and institutional capital chases new highs. Left-shoulder volume is at an absolute peak. The consensus narrative declares "the trend continues." The pullback is treated as a buying opportunity; fundamental analysts raise price targets; media headlines trumpet bullish catalysts.
Stage B — Head: Final Momentum Impulse Price breaks above the left shoulder to set a new high. The bulls proclaim trend continuation. But volume falls materially below the left shoulder—smart money is no longer chasing. Participants are increasingly levered retail traders and short-term speculators. The head's volume-less new high is the covert distribution phase by informed capital.
Stage C — Right Shoulder: The Hope-to-Despair Pivot From the head's retracement low, bulls mount a counter-attack but fail to match the head's high. Right-shoulder volume contracts further—no new buyers remain. Early recognition by alert traders further suppresses right-shoulder height. When the neckline finally breaks, cascading stop-loss orders trigger, producing the "waterfall decline" that characterizes Head and Shoulders Top follow-throughs.
4.2 Inverse Head and Shoulders Bottom: Three Stages of Bearish Exhaustion
Inverse Bottoms represent the psychological transition from despair to hope.
Stage A — Left Shoulder: Final Capitulation A downtrend has extended for weeks or months. Retail investors stop out; media embraces bearish narratives. Left-shoulder volume spikes as "the last uncertain holders surrender."
Stage B — Head: Apparent Despair, Secret Accumulation Price breaks below the left shoulder to a lower low. Contrary to bearish expectation, volume contracts—the remaining holders refuse to sell. Smart money begins quiet accumulation.
Stage C — Right Shoulder: Trend Reversal Confirmation From the head's rally high, price declines but cannot penetrate the head's depth—bears are spent. The upside neckline break is accompanied by explosive volume as short sellers cover and fresh long capital enters. The post-breakout advance often exceeds the measured target because the "short-to-long-plus-new-bull" demand structure generates sustained buying pressure.
4.3 The Volume Staircase Pattern
Volume evolution provides an independent, price-parallel evidence stream. Typical volume pattern for a Head and Shoulders Top:
| Phase | Relative Volume Strength |
|---|---|
| Advance to left shoulder | Highest (market euphoria) |
| Left shoulder pullback | Moderate |
| Advance to head | Visibly reduced (warning) |
| Head retracement | Rising (profit-taking begins) |
| Advance to right shoulder | Lowest (buying exhausted) |
| Right shoulder decline | Moderate |
| Neckline break | Explosive (stops triggered + short entry) |
Violations of this staircase (e.g., right-shoulder volume exceeding head, or head volume exceeding left shoulder) warrant serious skepticism. The staircase reflects the Wyckoff supply-demand framework and is the single most important filter separating valid patterns from noise.
5. Three Mandatory Breakout Confirmation Conditions
Three peaks or troughs merely form the skeleton; only a valid neckline break triggers a trade.
5.1 Condition 1: Closing Price Must Cross the Neckline
Only closing-price crossings count as valid breakouts. Intraday probes that retrace before close are merely "tests" of the neckline. This condition eliminates:
- Gaps across the neckline that close back on the original side
- Long wicks touching the neckline with closes far from it
- Crossings on abnormally low volume
Advanced practitioners often require two consecutive closes across the neckline for additional noise filtering (the "2-day close rule").
5.2 Condition 2: Volume Expansion
The neckline break must coincide with significantly expanded volume:
- At minimum, 50% above the 20-day average
- Ideally, 100%+ (double or more)
- If breakout volume shrinks rather than expands, there is a 60%+ probability of fakeout
Volume is the one technical-analysis signal that cannot be falsified—price can be momentarily pushed by modest capital, but genuine concentration of buying or selling pressure manifests only in volume.
5.3 Condition 3: Throwback/Pullback Confirmation
Approximately 60% of Head and Shoulders patterns exhibit a throwback (Top) or pullback (Bottom)—price retests the neckline from the new side before resuming the direction of the breakout. This creates a second, lower-risk entry opportunity (stop-loss can be placed at the throwback peak or trough).
Throwback/pullback rules:
- Should complete within 3-10 trading sessions after the initial break
- Volume during the throwback should be materially lower than breakout volume
- Excessive retracement (Top: price returns above the neckline and beyond the right shoulder) may signal pattern failure
6. The Measuring Rule and Target Price Calculation
The most compelling feature of the Head and Shoulders is the quantifiable target price.
6.1 The Measuring Formula
Target = Breakout Price ± (vertical distance from head to neckline)
- H&S Top: Target = Neckline breakout − (Head high − Neckline value at head)
- H&S Bottom: Target = Neckline breakout + (Neckline value at head − Head low)
6.2 Worked Example
Suppose a stock forms an H&S Top with:
- Head high: $150
- Neckline at head's horizontal position: $130
- Neckline breakout: $130
Then vertical distance = $150 − $130 = $20 Target = $130 − $20 = $110
If price reaches $115 and reverses, the target has not been attained—continue holding short; if price breaks $110 and continues weakly, consider adding to the short or switching to a trailing stop.
6.3 Target-Attainment Probability and Overshoot
Per Bulkowski:
- H&S Top target attainment: ~55%
- Inverse H&S Bottom target attainment: ~71%
- Inverse H&S Bottoms overshoot the measured target by 2x or more in roughly 43% of cases
The asymmetry stems from:
- Down-market terminal phases often feature V-reversals and liquidity exhaustion, capping the decline
- Post-reversal bull markets extend for months or years, far outlasting the typical bear phase
Accordingly, H&S Bottom targets should be treated as "minimum expectations," commonly extended using Fibonacci retracement and extension or Elliott Wave projections.
7. Fakeout Signals and Filtering Conditions
Approximately 15-20% of apparent Head and Shoulders formations turn out to be fakeouts. Learning to filter them dramatically reduces losses.
7.1 Five Characteristics of Fakeouts
- No volume expansion at breakout: A technical crossing without supply-demand conviction
- Return across neckline within 3 sessions: True breakouts typically extend; rapid reversal back into the pattern suggests a trap
- Severely asymmetric shoulders: A right shoulder far above the left (Top) indicates unextinguished bullish energy
- No MACD/RSI divergence: Powerful reversals almost always pair with momentum divergence
- Indistinct prior trend: Apparent three-peak formations within multi-month ranges are not H&S patterns
7.2 Triple-Filter Confirmation
Recommended triple filter:
- Time filter: Two consecutive closes across the neckline
- Volume filter: Breakout volume ≥ 1.5× the 20-day average
- Price filter: Crossing magnitude ≥ 3% of the head-to-neckline distance
All three satisfied simultaneously reduces fakeout rate below 5%.
7.3 Pre-Trade Checklist
Before entering:
- Prior trend clearly established (3+ months of uptrend/downtrend)
- Three peaks/troughs fully formed, head clearly exceeds both shoulders
- Shoulder asymmetry within ±10%
- Volume staircase exhibits graduated decline
- Closing-price neckline crossing with volume expansion
- MACD or RSI divergence observable
- Reward-to-risk ratio at measured target ≥ 1:2
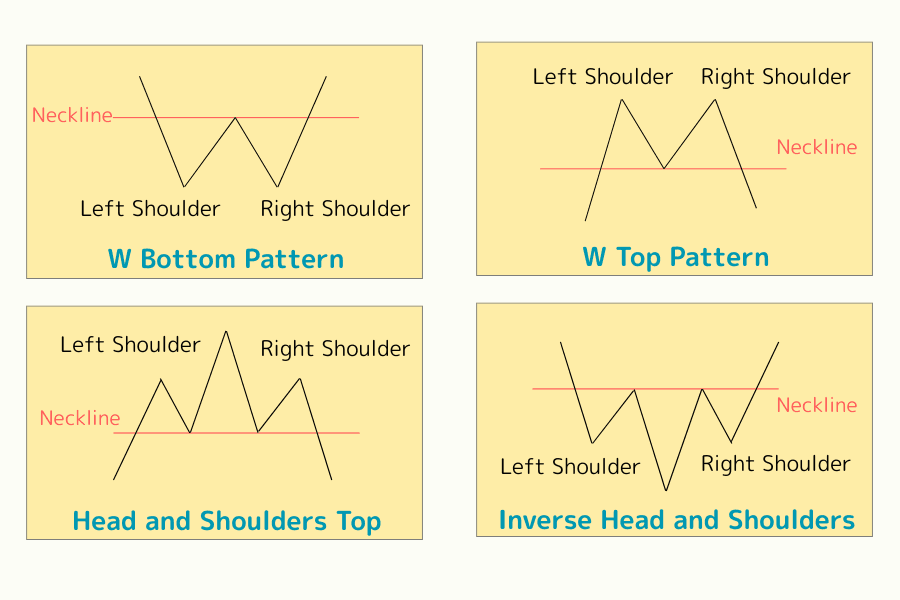
8. Comparison with Other Reversal Patterns
8.1 H&S vs Double Top / Double Bottom
Double Top and Double Bottom patterns are the simpler cousin—only two peaks/troughs separated by a single trough/peak.
| Aspect | Head and Shoulders | Double Top / Bottom |
|---|---|---|
| Peak count | 3 (head most extreme) | 2 (approximately equal) |
| Formation time | Longer | Shorter |
| Reliability | Higher | Moderate |
| Measured move | Deeper (22-38%) | Shallower (15-25%) |
| Signal clarity | High | Requires confirmation |
8.2 H&S vs Triple Top / Triple Bottom
Triple Tops show three peaks of approximately equal height (rather than a central taller peak). If the middle peak exceeds the shoulders by only ±2%, the formation is a Triple Top, not a Head and Shoulders. Psychology is similar, but momentum exhaustion is slower.
8.3 H&S vs Rounding Top / Bottom
Rounding tops/bottoms are long, smooth curves without three distinct peaks/troughs. Rounding patterns are extremely reliable but harder to identify. They may coexist with H&S patterns—a seeming H&S Bottom viewed at higher timeframe may be part of a larger rounding bottom.
8.4 H&S vs Continuation Patterns (Wedges, Flags, Pennants)
Reversal patterns (H&S, Double, Rounding) signal trend reversal; continuation patterns (Wedges, Flags, Triangles) signal trend continuation after pause.
The most common confusion is between Descending Wedges and Inverse Head and Shoulders Bottoms—similar appearance but Descending Wedges have two converging trendlines and no distinct "head" that extends lower than the shoulders. The distinguishing question: Does the middle trough visibly extend deeper than the flanking troughs? H&S Bottom yes, Descending Wedge no.
9. Confluence with Other Technical Indicators
9.1 MACD Divergence
The most potent confirming signal. The ideal H&S Top configuration:
- Left shoulder: MACD histogram positive
- Head: MACD histogram contracts or turns negative (bearish divergence)
- Right shoulder: MACD clearly below zero line
When price sets a new high but MACD fails to confirm, this bearish divergence is the gold-standard exhaustion signal. See the full guide at MACD Indicator Guide and the proprietary Titan Multi-MACD indicator.
9.2 RSI Overbought/Oversold
RSI typically enters overbought territory (>70) at the head, then rapidly retreats. If the head's RSI reading is lower than the left shoulder's (RSI divergence), signal reliability further improves. See RSI Technical Analysis for practical application.
9.3 Moving Average System
Moving averages provide trend confirmation:
- At head formation, 50-day MA still sloping up
- At neckline break, 50-day MA flattens
- During target-attainment period, 50-day MA crosses below 200-day MA (death cross)
All three signals aligning constitute strong H&S Top confirmation. H&S Bottom shows the mirror (golden cross).
9.4 Fibonacci Retracement
Advanced targets after measuring rule attainment:
- Compute 61.8% and 78.6% Fibonacci retracements from the left-shoulder trough (or origin of the initial advance) up to the head's peak
- Post-breakdown, H&S Top declines often find support at these deeper retracement levels
- Post-breakout, H&S Bottom advances often extend to Fibonacci 1.272 and 1.618 extensions
See the Fibonacci Retracement Basics guide and the Titan Auto-Fibonacci indicator.
10. Historical Cases Across Global Markets
10.1 Dow Jones 1929 — Pre-Crash Structure
The 1929 pre-crash Dow Jones Industrial Average formed a partial Head and Shoulders-like top on monthly charts:
- Left shoulder: early 1929 around 320
- Head: September 3, 1929 at 381.17 (historic peak until 1954)
- Right shoulder: October 1929 around 355 (failed rally)
- Neckline: approximately 325
The break of the neckline in late October 1929 coincided with Black Thursday (Oct 24) and Black Tuesday (Oct 29). Dow reached 41.22 by July 1932—an 89% decline over 34 months, one of history's most devastating bear markets.
10.2 Nikkei 225, 1989 — Bubble Peak
Japan's asset bubble produced the largest weekly H&S Top in recorded history:
- Left shoulder: October 1987 near 27,000
- Head: December 29, 1989 at 38,915.87 closing high (bubble-era peak; held for 34 years until surpassed on February 22, 2024; intraday high was 38,957.44), volume 25% below left shoulder
- Right shoulder: January-February 1990 near 33,000 (further volume contraction)
- Neckline: approximately 30,000
The neckline break extended Nikkei's decline to 14,309 by August 1992—a 52% decline against a measured target of 8,915 below the neckline (objective satisfied and exceeded).
10.3 Nasdaq Composite, 2000 — Dot-Com Peak
The dot-com bust produced an equally clear weekly pattern:
- Left shoulder: January 2000 near 4,200
- Head: March 10, 2000 at 5,132.52 (volume materially below left shoulder)
- Right shoulder: August-September 2000 near 4,200
- Neckline: approximately 3,500
The neckline break in November 2000 led to a collapse to 1,108.49 by October 2002—a 78% decline that dwarfed the measured target of ~1,900. The magnitude illustrates that in extreme conditions (dot-com mania, 2000 tech bubble), the measuring rule represents a conservative floor, not a ceiling. See contextual VIX Volatility Index behavior during crisis periods.
10.4 S&P 500, 2007-2008 — Global Financial Crisis
Prior to the Lehman Brothers collapse, the S&P 500 formed a monthly H&S Top:
- Left shoulder: July 2007 at 1,555
- Head: October 11, 2007 at 1,576.09 (intraday 1,576.09, closing 1,565.15 — narrow head)
- Right shoulder: May 2008 at 1,440 (failed rally)
- Neckline: approximately 1,400
The neckline break in early 2008 preceded the crescendo of the Global Financial Crisis, with the S&P falling to 666.79 in March 2009 (57% decline). The measured target of ~1,224 was attained; the overshoot reflects the exceptional severity of the 2008-2009 crisis.
10.5 Tesla (TSLA), 2022 — Post-Peak Decline
Tesla formed a textbook daily H&S Top after its split-adjusted all-time high:
- Left shoulder: September 2021 around $297 (split-adjusted)
- Head: November 4, 2021 at $414.50 (post-split), volume contraction versus September peak
- Right shoulder: December 2021 around $381
- Neckline: approximately $260
The January 2022 neckline break initiated a decline to $101.81 by January 2023—a 75% decline from peak, exceeding the ~$107 measured target. Tesla's 2022 case demonstrates that the pattern remains reliable for individual growth stocks in high-volatility regimes.
10.6 Bitcoin (BTCUSD), 2017-2018 — First Crypto Bubble Top
Bitcoin's parabolic 2017 rally terminated in a daily H&S Top:
- Left shoulder: December 8, 2017 near $17,300
- Head: December 17, 2017 at approximately $19,783 cycle peak (CoinDesk BPI); subsequently surpassed in 2021 and 2024. Significant volume contraction versus left shoulder on many exchanges
- Right shoulder: January 6, 2018 near $17,200
- Neckline: approximately $13,800
The January 2018 neckline break initiated a decline to $3,192 by December 2018—an 84% decline against a measured target of ~$7,700 (objective satisfied and substantially exceeded). The pattern's applicability to cryptocurrencies was demonstrated despite the asset class's novelty and extreme volatility.
11. Trading Playbook and Risk Management
11.1 Entry Selection
Three common entry approaches:
- Aggressive: Enter on the neckline close breakout itself (lower win rate but captures maximum move)
- Standard: Confirm closing break, wait for throwback/pullback to the neckline, enter on re-rejection (optimal reward-to-risk ratio)
- Conservative: Enter on resumption of the post-throwback move (misses some of the move but minimizes false-signal exposure)
11.2 Stop-Loss Placement
Common stop levels:
- H&S Top: 1-2% above the right shoulder high (breach invalidates the pattern)
- H&S Bottom: 1-2% below the right shoulder low
- Aggressive stop: first post-breakout retracement high/low (tighter risk but higher whipsaw exposure)
Avoid placing stops directly on the neckline—throwbacks routinely test the neckline itself; a too-close stop is easily swept.
11.3 Position Sizing
Risk-based position sizing principles:
- Risk no more than 1-2% of total capital on any single trade
- Wider stop distance → smaller position (fixed-dollar-risk principle)
- At first measured target attainment, consider taking 50-67% of position off, leaving the remainder for a trailing stop approach
- For position-sizing detail with CFD leverage considerations, reference Titan FX's educational materials
11.4 The Titan FX Platform and Applicable Instruments
Titan FX provides over 200 CFD contracts across FX, precious metals, energies, indices, and individual equities—all tradeable on MT4 and MT5 platforms:
- Native bidirectional trading: CFDs inherently support long and short, allowing direct entry on H&S Tops (short) and H&S Bottoms (long)
- Automated scanning tools: Pair with Titan FX's proprietary Support-Resistance indicator, Key Reversal indicator, and auto-Fibonacci tools for rapid pattern identification
- Cross-market comparison: Scan FX, indices, and commodities simultaneously to capture multi-market reversal opportunities
12. Frequently Asked Questions
Q1. Is the 93% success rate of the H&S pattern really accurate?
Bulkowski's original figure of 93% (Tops) and 83% (Bottoms) applies under strict definitional conditions: measured target, time window, and volume confirmation. Most retail traders do not consistently apply these confirmation criteria, and realized accuracy typically falls between 55% and 70%. The high statistical figures require rigorous triple-filter application (time, volume, price) to approach academic levels. Updated 2021-2023 research suggests the success rate remains above 90% under strict conditions, though algorithmic participation has introduced more fakeouts during the confirmation phase.
Q2. What signals indicate H&S pattern failure?
Three primary failure signals:
- Neckline break followed by rapid (3-5 session) return across the neckline with close back inside the pattern
- Breakout on contracting rather than expanding volume, lacking follow-through
- Price reaches less than 50% of the measured target and reverses above the right-shoulder high (Top) or below the right-shoulder low (Bottom)
Any one of these warrants immediate stop-loss execution.
Q3. Which timeframes produce reliable H&S patterns?
Weekly and daily timeframes are most reliable; 4-hour charts require caution; 1-hour and below are dominated by noise. Typical measured-target-attainment windows: weekly H&S patterns 6-24 months, daily 2-8 weeks, 4-hour 3-10 days. Ultra-short timeframes (1-15 minute) may produce visually similar formations but lack statistical validity.
Q4. When is the optimal entry timing after a neckline break?
For the standard entry approach: wait 3-10 trading sessions after the initial break for a throwback/pullback, then enter near the neckline when volume is contracting relative to the breakout. If volume expands during the throwback, or if the retracement exceeds the right-shoulder high (Top) or low (Bottom), abandon the trade setup.
Q5. Why do H&S Bottom breakouts frequently exceed the measured target?
Two compounding factors:
- Terminal bearish phases typically exhaust selling capacity; breakout-coincident short-covering generates explosive short-term volume
- Post-reversal bull markets commonly extend for months or years—far longer than typical bear phases
Bulkowski's data shows an average 38% advance for Bottoms versus 22% decline for Tops, precisely reflecting this asymmetry.
Q6. Does the H&S pattern work reliably on cryptocurrencies?
Partially reliable with adjustments. Cryptocurrency volatility is 3-5x that of equities or forex, so: (1) shoulder height asymmetry tolerance widens to ±15%; (2) the volume staircase is less consistent because leveraged derivatives dominate flow; (3) measured targets are often attained rapidly but also reverse rapidly. Recommend daily-or-higher timeframes and heavier reliance on RSI/MACD divergence as confirming signals. The 2017-2018 Bitcoin case demonstrates the pattern's validity when applied with caution.
13. Summary and Key Takeaways
The Head and Shoulders Top and Inverse Head and Shoulders Bottom remain the most essential reversal patterns in technical analysis. Their enduring value rests on three pillars: structural clarity (four components allowing standardized identification), psychological transparency (three exhaustion stages mapped directly to crowd emotion), and quantifiable targets (neckline-to-head distance providing a minimum expected move).
Four core principles for reliable application:
- Pattern recognition depends on prior trend: Three-peak formations within ranging price action are not Head and Shoulders patterns
- Volume is the non-falsifiable confirmation: The left-shoulder–head–right-shoulder staircase decline is the key evidence separating valid patterns from coincidence
- Breakout confirmation requires triple filtering: closing-price crossing + volume expansion + either two consecutive closes or throwback validation
- The measuring rule is a conservative floor: H&S Bottom advances frequently exceed theoretical targets; pair with Fibonacci extensions to establish upper bounds
Combined with MACD divergence, RSI extremes, support and resistance, and Fibonacci retracement, accuracy can be pushed to a stable 80%+ range. For new practitioners, begin with weekly timeframe observation for 6-12 months before extending to daily and shorter frames.
Further reading: Reversal Patterns overview, Double Top and Double Bottom, Island Reversal, Symmetrical Triangle Pattern.
Further Reading
- What Are Reversal Patterns?
- Double Top / Double Bottom
- Symmetrical Triangle Pattern
- What Is a Candlestick Chart?
The financial markets research team at Titan FX. We produce educational content across a broad range of instruments, including forex (FX), commodities (crude oil, precious metals, agricultural products), equity indices, U.S. stocks, and crypto assets.
Primary Sources (by Category)
- Technical analysis references: Edwards & Magee — Technical Analysis of Stock Trends (11th ed., 2018); Thomas N. Bulkowski — Encyclopedia of Chart Patterns (2nd ed., 2005); Richard D. Wyckoff — The Wyckoff Method
- Market data and education: CFA Institute — Technical Analysis curriculum; Bloomberg Terminal — historical data; TradingView — Chart Patterns Database