Dow Theory
If you start learning technical analysis, Dow Theory is almost unavoidable. Trace the thinking behind tools like moving averages and MACD, and much of it leads back to this very theory.
This article covers Dow Theory's six core principles, the analytical tools used alongside it, its known limitations, and how it integrates with modern chart patterns and technical indicators.
- What Dow Theory is and why it matters for technical analysis
- The six core principles that define trend identification
- How to confirm trends using volume, multiple indices, and supplementary tools
- Practical integration with chart patterns, reversal formations, and oscillators
- The limitations of Dow Theory and common misconceptions
- 1. Overview of Dow Theory
- 2. Origins and Development of Dow Theory
- 3. Six Core Principles of Dow Theory
- 4. Analytical Tools in Dow Theory
- 5. Limitations of Dow Theory
- 6. Practical Applications of Dow Theory in Trading
- 7. Integrating Dow Theory with Other Trading Strategies
- 8. Frequently Asked Questions (FAQ)
- 9. Conclusion
Key Takeaways
- The six core principles of Dow Theory and their modern relevance
- How to identify the three phases of a trend (accumulation, public participation, distribution)
- Practical applications of Dow Theory in forex and CFD trading
- Limitations of Dow Theory and how to complement it with other methods
1. Overview of Dow Theory
In the realm of financial market analysis, Dow Theory occupies an extremely important position. Founded by Charles Dow in the late 19th century, it has undergone over a century of development and refinement. It not only serves as one of the foundations of technical analysis but also has profoundly influenced the analysis and trading strategies of modern markets such as stocks, forex, and commodities.
This article will delve into the core principles of Dow Theory, its applications, limitations, and its integration with other strategies, providing investors with a comprehensive and practical knowledge guide.
2. Origins and Development of Dow Theory
Charles Dow, a renowned American securities analyst and journalist, founded Dow Theory based on his detailed observation and analysis of the Dow Jones indices. Dow attempted to uncover the inherent patterns in market price fluctuations to reveal the underlying market dynamics.
Although Charles Dow did not leave behind a systematic work, later experts and scholars, such as S.A. Nelson, W. Hamilton, and Robert Rhea, compiled, interpreted, and expanded upon his ideas, leading to the formation of a complete and systematic framework. Initially applied mainly to the stock market, Dow Theory has since been widely adapted to various financial markets, continuously expanding its influence.
3. Six Core Principles of Dow Theory
Dow Theory has the following six basic principles.
- Principle 1: Market Prices Reflect All Information
- Principle 2: The Diversity of Trends
- Principle 3: The Three Stages of Long-Term Trends
- Principle 4: Mutual Verification of Averages
- Principle 5: Volume Confirms the Trend
- Principle 6: Continuation and Reversal of Trends
1. Market Prices Reflect All Information
Dow Theory holds that market prices are a comprehensive reflection of all publicly available information. Whether it is macroeconomic data, company financial reports, or unexpected events like political changes and natural disasters, all such factors are quickly and fully reflected in market prices.
This principle provides a theoretical basis for technical analysis, allowing investors to gain insights into the underlying information by studying price movements.
Real-world example: Before the 2008 Financial Crisis broke, stock markets had already begun reflecting the vulnerabilities within the financial system. As market prices started to decline, many investors failed to recognize the signal in time, resulting in significant losses. By applying Dow Theory, investors could have identified market uncertainty through price trends and taken preventive measures.
In practice, investors should closely monitor price fluctuations to assess whether the market has already absorbed the latest economic or political information. If the price does not respond as expected after reflecting new information, it may indicate a shift in market sentiment, prompting investors to adjust their strategies.
2. The Diversity of Trends
By direction, trends can be divided into:
Uptrend
The market's high points and low points gradually rise, and prices show a sustained upward movement.
Downtrend
The market's high points and low points continuously decrease, and prices keep declining.
Sideways Trend
Prices fluctuate within a narrow range, and there is no clear direction.
Different trend types require investors to adopt different trading strategies. For example, in an uptrend, investors look for buying opportunities; in a downtrend, they avoid buying or consider short-selling; in a sideways trend, range trading is suitable.
By cycle, trends can be divided into:
Primary Trend
Lasting for over a year, this trend dictates the long-term direction of the market, which can be upward, downward, or sideways.
Secondary Trend
Lasting from a few weeks to a few months, this is often a correction within the primary trend or the beginning of a reverse trend.
Minor Trend
Lasting from a few days to a few weeks, this is a short-term fluctuation within a secondary trend, with little impact on long-term investment decisions.
Investors need to consider trends across different cycles when formulating their investment plans.
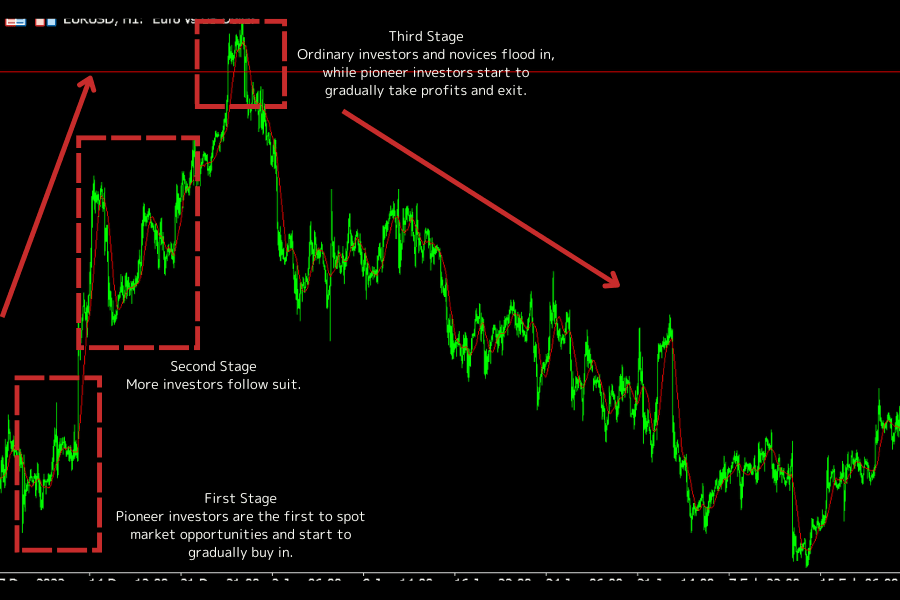
3. The Three Stages of Long-Term Trends
First Stage: Accumulation
Pioneering investors spot market opportunities early and begin buying, although stock prices show signs of upward movement, the volatility is relatively moderate.
Second Stage: Public Participation
As stock prices rise and market sentiment improves, more investors join in, and market trading enthusiasm peaks.
Third Stage: Distribution
The media reports extensively, trading volume surges, and retail investors flood in. Meanwhile, pioneering investors begin to realize profits, signaling that the trend is nearing its end. The stages of a downtrend are the reverse.
4. Mutual Verification of Averages
In the early days of Dow Theory, the focus was on the Dow Jones Industrial Average (DJIA) and the Dow Jones Transportation Average (DJTA). Dow emphasized that when the industrial index shows an upward or downward trend, the transportation index should also follow a similar direction to confirm the validity of the market trend.
In modern financial markets, this concept can be extended to mutual verification between related markets or indices to enhance trend judgment accuracy.
Related: Stock Index Trading Guide
5. Volume Confirms the Trend
Volume is an important indicator for assessing the strength and sustainability of a trend.
In an uptrend, price increases are usually accompanied by a rise in trading volume, signaling a high level of market participation, strong buying power, and a greater likelihood of trend continuation.
In a downtrend, price declines are usually accompanied by a drop in volume. If prices rise but trading volume fails to increase, it could signal that the trend may lack continuation, or even reverse soon.
6. Continuation and Reversal of Trends
Once a market trend is formed, it tends to continue until a clear reversal signal appears, such as a price breaking through important trend lines, or key support and resistance levels.
However, it is crucial to distinguish between a mid-term correction and a trend reversal when interpreting reversal signals, to avoid costly mistakes.
Understanding these six principles is equivalent to grasping the skeleton of technical analysis. Trend identification, risk management, and trade timing can all be built on this foundation.
4. Analytical Tools in Dow Theory
Dow Theory holds that confirming trend validity is the key to determining trade direction. Beyond observing price itself, combining supplementary verification methods and technical tools helps improve accuracy and reduce the risk of misjudgment.
Multi-Index Verification (Index Confirmation)
Trend validity should be assessed by observing the synchronization of multiple markets or related indices.
- For example, if DJIA and DJTA both make new highs or new lows simultaneously, the trend direction is confirmed.
- If one diverges, trend continuation needs to be reassessed, as it may signal a false breakout or an impending trend reversal.
Volume Confirmation
Volume serves as important corroboration of trend reliability:
- In an uptrend, if price rises are accompanied by increasing volume, it indicates strong buyer participation and a valid trend.
- In a downtrend, if price declines are accompanied by rising volume, it also serves as a confirmation signal.
- If price moves without corresponding volume, caution is warranted, as it may be a false signal.
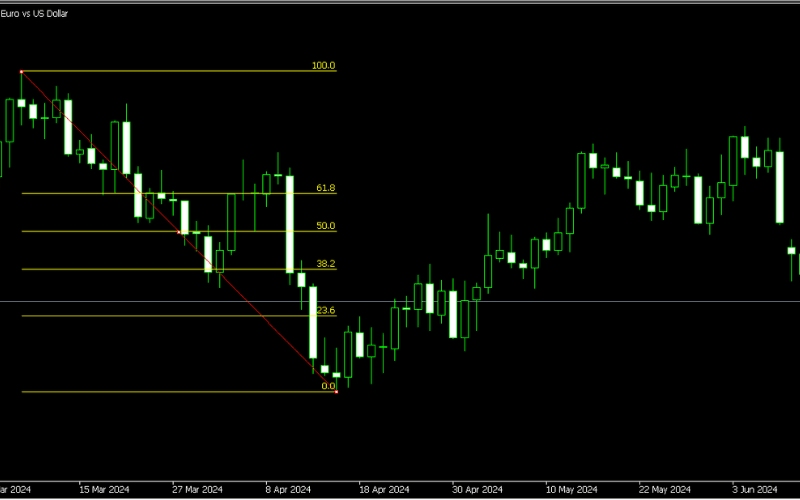
Fibonacci Retracement
Fibonacci retracement levels are based on the Fibonacci sequence and are commonly used in Dow Theory to identify potential price retracement or rebound levels.
For example, in an uptrend, price retracements may find support at Fibonacci retracement levels (such as 38.2%, 50%, or 61.8%) before resuming upward movement.
In a downtrend, retracements might face resistance at these levels. Fibonacci retracement levels help investors predict possible price turning points, in conjunction with Dow Theory's trend identification, to identify better entry and exit points.
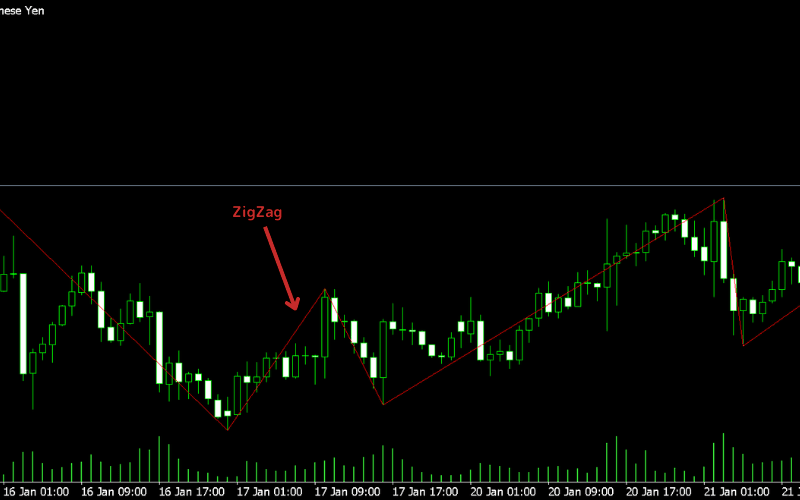
ZigZag Indicator
The ZigZag indicator helps investors clearly identify significant price fluctuations while filtering out small market noise. This makes it easier to track changes in the market trend.
With this indicator, investors can easily pinpoint market highs and lows, aligning with Dow Theory's trend judgments -- such as identifying higher highs and higher lows in an uptrend, and lower highs and lower lows in a downtrend.
Trendlines
By connecting the highs or lows of market prices, trendlines provide a more visual way to identify the direction and strength of a trend.
A breakout of the trendline often signals a potential reversal, which aligns with Dow Theory's idea that a trend will continue until a clear reversal signal appears. For example, an effective breach of an uptrend line might suggest the end of the uptrend, and vice versa.
Moving Averages
The crossing of short-term and long-term moving averages can provide important buy or sell signals. For example, when the short-term moving average crosses above the long-term moving average, it may signal the beginning of an uptrend. Conversely, when the short-term moving average crosses below the long-term moving average, it might indicate the arrival of a downtrend.
Moving averages smooth out price data and display the market's average cost, helping confirm trends and assess their strength and continuation.
Learn More About Moving Averages5. Limitations of Dow Theory
Lagging Signals
Because Dow Theory focuses on the continuity of trends, reversal signals tend to appear relatively late, which might cause investors to miss optimal entry or exit points. Therefore, when applying Dow Theory in practice, it is often necessary to combine it with other high-sensitivity indicators or analytical methods to compensate for this drawback.
Non-Absolute Nature of the Theory
Dow Theory is not universally applicable in all market conditions. In extreme market volatility, speculative bubbles, or irrational behavior, its effectiveness may be challenged. Investors should apply a combination of various analytical methods for a more comprehensive understanding of the market.
False Breakouts
In sideways or volatile markets, false breakouts are common, where the price briefly breaks through a key level and then quickly reverses. This could lead investors to make incorrect trading decisions. To mitigate this risk, investors can use volume analysis, multi-timeframe analysis, and other methods to improve their ability to judge the validity of breakouts.
Dow Theory's limitations are not only due to lagging signals and false breakouts but also influenced by the strong impact of market environments, especially during extreme market events.
Real-world example: During the 2008 Financial Crisis, Dow Theory signals reacted late. The abnormal market fluctuations were not immediately recognized by the price trends predicted by Dow Theory. Investors relying solely on Dow Theory might have misjudged the timing of market reversals, missing the opportunity to protect their capital.
During the 2020 COVID-19 pandemic, the market was hit by a sudden shock. Dow Theory's effectiveness was weakened in such an unexpected event, as prices fluctuated sharply, and trend reversals were difficult to predict.
Mitigation strategies:
- Combine fundamental analysis and market sentiment analysis to aid trend judgment
- Use moving averages, MACD, RSI, and other tools for multi-factor cross-validation
- Set stop-loss mechanisms and risk management baselines to avoid false breakout traps
- During extreme market conditions, reduce position sizes or pause trend-following strategies until the market stabilizes
6. Practical Applications of Dow Theory in Trading
Trend Identification and Strategy Formulation
Investors can identify market trends based on Dow Theory, actively seeking buying opportunities during an uptrend and considering selling or shorting during a downtrend. In sideways trends, range trading strategies, such as buying low and selling high, are effective.
Buy and Sell Signals and Risk Management
Confirm trend continuation using trendlines, volume, and other tools, and set reasonable stop-loss and take-profit levels. For example, in an uptrend, setting the stop-loss just below key support levels helps manage risk; during a downtrend, the take-profit can be set near key resistance levels to lock in profits.
7. Integrating Dow Theory with Other Trading Strategies
Integration with Chart Pattern Analysis
Flag and Triangle Patterns
In the uptrend identified by Dow Theory, flag and triangle patterns often appear as consolidation forms. After the consolidation ends and the price breaks out upwards, accompanied by an increase in volume, it is usually a signal of trend continuation. Investors may consider adding to positions or buying. Conversely, in a downtrend, the opposite applies.
Rectangular and Wedge Patterns
Rectangular patterns (box patterns) often appear in sideways trends, where the price fluctuates between two parallel lines. Wedge patterns, whether ascending or descending, may indicate potential trend changes.
In the context of Dow Theory, if a rectangle pattern breaks out upwards, it may signal the end of the sideways trend and the start of an uptrend. A breakout from a descending wedge may suggest an acceleration of the downtrend. Investors can develop buy and sell strategies based on these patterns combined with trend analysis.
Integration with Reversal Patterns Analysis
Head and Shoulders, Double Top, and Triple Top
The head-and-shoulders pattern is a classic reversal formation. In an uptrend, if a head-and-shoulders pattern forms and the price breaks below the neckline after the right shoulder, along with an increase in volume, this could signal a strong reversal in trend. This is consistent with Dow Theory's view on trend reversals, and investors should consider selling or shorting.
Double tops and triple tops are similar. Their formation and breakout are also key signals of trend reversal, prompting investors to adjust their trading strategy accordingly.
Titan FX offers comprehensive technical analysis courses, covering moving averages, candlestick patterns, Fibonacci, Bollinger Bands, ATR, MACD, and other key tools. The goal is to provide investors with a practical guide to help them navigate the fast-changing global markets and increase their chances of making profitable trades.
Related: Candlestick Patterns Analysis
Comprehensive Use of Technical Indicators
KDJ Indicator
The KDJ indicator reflects the market's overbought and oversold conditions as well as price volatility.
In an uptrend, when the KDJ indicator enters the overbought zone and starts turning downward, it may signal an imminent short-term correction. Investors may consider reducing positions. In a downtrend, when the KDJ indicator enters the oversold zone and starts turning upward, it may signal a potential reversal.
Combining the KDJ indicator with Dow Theory's trend analysis can help investors better time their trades and enhance the effectiveness of Dow Theory.
8. Frequently Asked Questions (FAQ)
Q1. Can Dow Theory be used together with Elliott Wave Theory?
Yes. Elliott Wave Theory divides trends into impulse and corrective waves, which aligns closely with Dow Theory's three-phase trend logic. Used together, they make it easier to locate where a trend stands and to anticipate potential turning points.
Q2. Can Dow Theory alone be used to time entries and exits?
Not really. Dow Theory is best at identifying trend direction and phase, not precise entry or exit points. In practice, confirm timing with other tools such as moving averages, Bollinger Bands, or MACD.
Q3. How can I avoid false breakouts when using Dow Theory?
Don't act on a single signal. Look for confluence — a trendline break, rising volume, and confirmation across related indices — before treating a breakout as valid.
Q4. Is Dow Theory suitable for day trading or short-term trading?
It is mainly for medium- to long-term trend analysis and is less suited to day trading or very short-term setups. For shorter horizons, use more responsive technical or price-volume tools.
9. Conclusion
As a classic theory of technical analysis, Dow Theory provides investors with a systematic market analysis framework and trend identification method. Despite its limitations, when combined with other technical indicators and trading strategies, it can effectively compensate for its shortcomings and increase trading success rates.
In the complex and dynamic financial markets, understanding and flexibly applying Dow Theory can help investors better capture market trends, make informed investment decisions, and achieve higher returns in their trading activities.
Further Reading
Titan FX Research. We produce educational content for investors, covering a wide range of financial instruments including forex, commodities (crude oil, precious metals, agricultural products), stock indices, U.S. equities, and digital assets.
Primary Sources by Category
- Technical analysis foundations: Charles Dow's editorials (Wall Street Journal), S.A. Nelson's 'The ABC of Stock Speculation', Robert Rhea's 'The Dow Theory'
- Market indices and data: S&P Dow Jones Indices (official DJIA and DJTA data), major exchange volume data
- Technical indicators: General technical analysis literature on Fibonacci Retracement, ZigZag, Moving Averages, and KDJ/Stochastics