Fibonacci: Sequence, Golden Ratio, Types & Drawing Methods

Fibonacci is a set of ratios (such as 0.382, 0.5, and the 0.618 golden ratio) derived from the sequence 1, 1, 2, 3, 5, 8…, used in technical analysis to project support, resistance, and retracement targets. Common tools include retracement, extension, fan, and time zones — all drawable directly on MT4/MT5.
The Fibonacci sequence, discovered by the Italian mathematician "Leonardo Fibonacci," is a classic mathematical sequence.
It runs 1, 1, 2, 3, 5, 8, 13… with each number the sum of the two before it. What captivates traders is that the ratio between adjacent numbers converges toward roughly 0.618 — the "golden ratio" found throughout nature and art — a proportion that market prices, too, seem to echo time and again.
The various ratios derived from the Fibonacci sequence have been widely applied in the financial markets and have become a powerful tool for analyzing price fluctuations.
This article will explore the basic concepts of Fibonacci, the sequence and ratios, the golden ratio, and how to draw them on the MT4/MT5 platforms.
- The Fibonacci sequence and the origin of the golden ratio (0.618)
- Six Fibonacci tools: retracement, time zones, fan, arcs, expansion, channel
- How to draw Fibonacci tools on MT4/MT5
- Using Titan FX's free custom indicators
- FAQs such as how Fibonacci differs from pivot points
1. Fibonacci Interpretation: From the Fibonacci Sequence to Fibonacci Ratios
The following will provide an in-depth analysis of how the Fibonacci sequence and Fibonacci ratios work.
Fibonacci Sequence
The Fibonacci sequence is generated by starting with 1, and adding the adjacent two numbers to produce the next number, continuing this pattern to extend the sequence.
1, 1, 2, 3, 5, 8, 13, 21, 34, 55, 89, 144, 233, 377, 610, 987, 1597, 2584, 4181, 6765, 10946…
For example, adding the first "1" and the second "1" gives the third number "2".
Similarly, adding the second "1" and the third "2" results in the fourth number "3". Adding the third "2" and the fourth "3" gives the fifth number "5", and so on.
This regularity is the most distinctive feature of the Fibonacci sequence and can be represented by the following formula:
F(0) = 0,
F(1) = 1,
F(n) = F(n−1) + F(n−2) (n≥2)
Origin of the Fibonacci Sequence
The Fibonacci sequence is named after the Italian mathematician Fibonacci, whose full name was Leonardo of Pisa. He lived in the 13th century and was one of the most famous mathematicians of medieval Europe. Fibonacci first introduced this sequence in his 1202 book Liber Abaci.
The discovery of the Fibonacci sequence arose from an interesting mathematical problem: imagine a rabbit population under ideal conditions. Each month, a pair of rabbits produces a new pair, and the new rabbits begin reproducing in the second month. Starting with a single pair, how many pairs of rabbits would there be after several months? Through this problem, Fibonacci derived the famous Fibonacci sequence.
This sequence not only has wide applications in mathematics but is also observed in nature. For example, the arrangement of sunflower seeds, the spiral shape of seashells, and the distribution of pine cone scales are all manifestations of the Fibonacci sequence in nature.
Fibonacci Ratios (Golden Ratio)
Fibonacci ratios are derived from various ratios of the Fibonacci sequence.
When we look at these ratios, we notice they follow certain patterns (close to the values in the table below).
By changing the way the numbers are divided, we can obtain various ratios.
Here are some main Fibonacci ratios:
| Fibonacci Ratio | Calculation Method |
|---|---|
| 0.236 (23.6%) | Any number divided by the number two positions ahead (e.g., 55 ÷ 233 = 0.236) |
| 0.382 (38.2%) | Any number divided by the number one position ahead (e.g., 34 ÷ 89 = 0.382) |
| 0.618 (61.8%) | Any number divided by its adjacent number (e.g., 144 ÷ 233 = 0.618) |
| 1.618 (161.8%) | Any number divided by the number directly before it (e.g., 610 ÷ 377 = 1.618) |
| 2.618 (261.8%) | Any number divided by the number one position before it (e.g., 987 ÷ 377 = 2.618) |
| 4.236 (423.6%) | Any number divided by the number two positions before it (e.g., 1597 ÷ 377 = 4.236) |
Among these, 1.618 (161.8%) is the so-called golden ratio, which is considered the most aesthetically pleasing ratio in the world. "1 to 1.618" is regarded as the most harmonious proportion.
Definition of the Golden Ratio
The golden ratio refers to the division of a line segment into two parts where the ratio of the longer part (a) to the shorter part (b) is equal to the ratio of the entire segment (a + b) to the longer part (a), i.e.:
𝜙 = (𝑎 + 𝑏) / 𝑎 = 𝑎/𝑏,
where, 𝜙 ≈ 1.6180339887…
The golden ratio has been widely applied in architecture, artworks, and even everyday items like business cards.
These Fibonacci ratios have been extensively studied and have developed into various tools used in technical analysis.
2. Types of Fibonacci Tools (MT4 & MT5)
Fibonacci tools are essential components of technical analysis, helping traders identify potential reversal levels, price targets, and trend dynamics. These tools leverage Fibonacci ratios (23.6%, 38.2%, 50%, 61.8%, etc.) to mathematically derive critical price and time relationships. Below is an overview of key Fibonacci tools and their primary applications:
| Name | Description |
|---|---|
| Fibonacci Retracement | Identifies potential support and resistance levels during price retracements. |
| Fibonacci Time Zones | Divides time axis with Fibonacci ratios to predict potential trend reversal points. |
| Fibonacci Fan | Projects multiple support/resistance lines from a single origin point using Fibonacci ratios. |
| Fibonacci Arcs | Draws curved levels combining price and time dimensions to identify reversal zones. |
| Fibonacci Expansion | Predicts price targets in trend continuation patterns, often used for setting profit targets. |
| Fibonacci Channel | Creates parallel channel lines to identify breakout points and potential trend developments. |
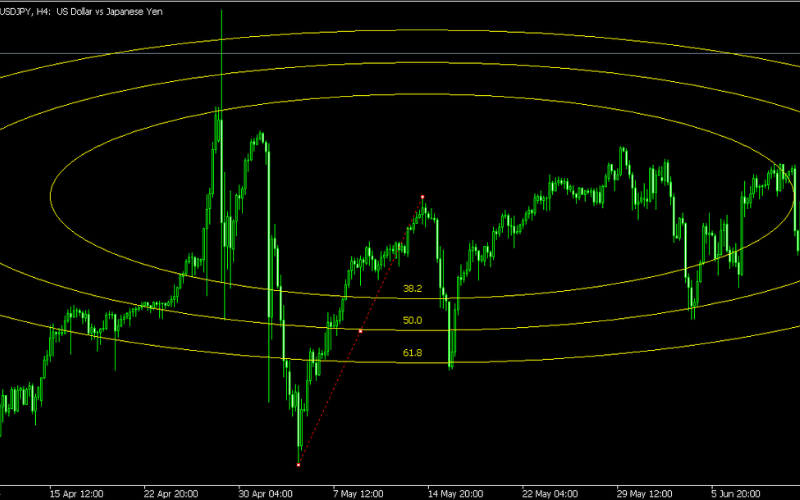
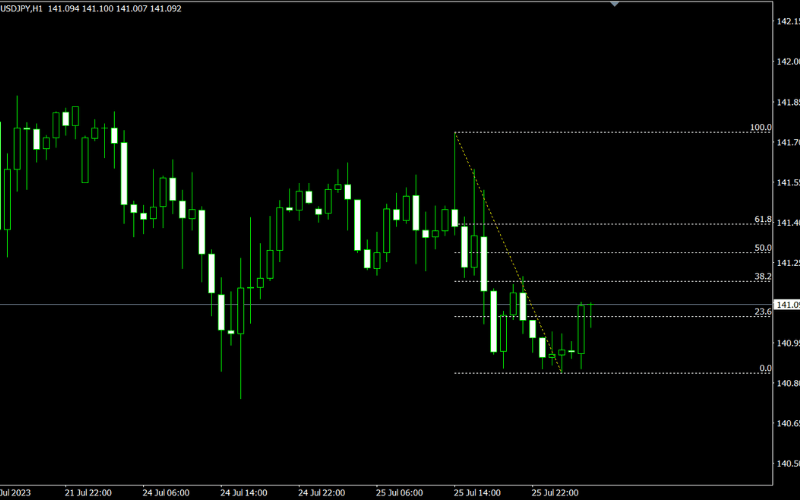
Fibonacci Retracement
Fibonacci Retracement is a commonly used tool in technical analysis, aimed at identifying potential support and resistance levels during price retracements.
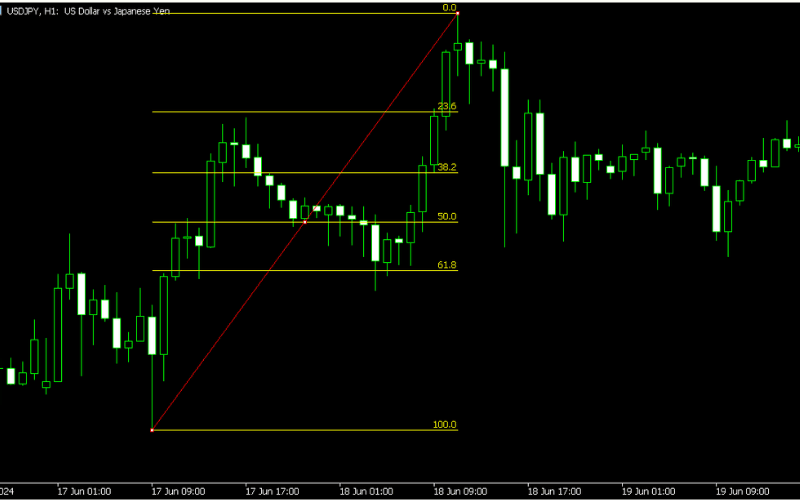
This tool is based on the Fibonacci sequence, where a series of horizontal lines are drawn between the starting and ending points of a price trend, helping traders predict key areas where prices may retrace.
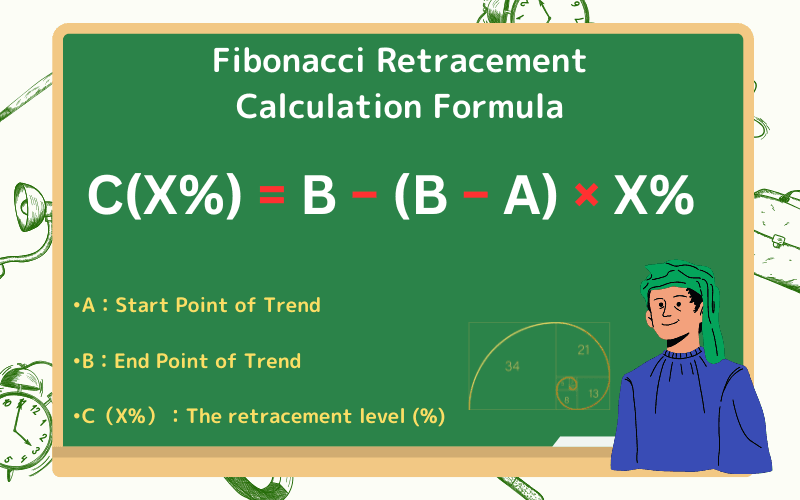
Fibonacci Retracement Calculation Method
Formula: C(X%) = B − (B − A) × X%
•A is the starting price (low or high)
•B is the ending price (high or low)
•X% is the Fibonacci retracement ratio (such as 23.6%, 38.2%, 50%, 61.8%)
•C(X%) is the corresponding retracement price
This formula means: Starting from the ending price B, the retracement price range (B - A) is reduced by X%, resulting in the retracement level C(X%).
These levels represent the percentage of price retracement, i.e., the proportion of price movement from high to low. Each retracement level has its own significance.
| Retracement Level | Calculation Formula | Explanation |
|---|---|---|
| 23.6% Retracement | C(23.6%) = B − (B − A) × 0.236 | A weaker retracement in an uptrend; a weaker bounce in a downtrend. |
| 38.2% Retracement | C(38.2%) = B − (B − A) × 0.382 | A common support level in an uptrend; a common resistance level in a downtrend. |
| 50% Retracement | C(50%) = B − (B − A) × 0.5 | A psychological barrier, widely used in technical analysis; common in both up and down trends. |
| 61.8% Retracement | C(61.8%) = B − (B − A) × 0.618 | A golden support level in an uptrend; a golden resistance level in a downtrend. |
| 78.6% Retracement | C(78.6%) = B − (B − A) × 0.786 | A deeper retracement in an uptrend, possibly indicating trend reversal; a deeper bounce in a downtrend, possibly indicating trend reversal. |
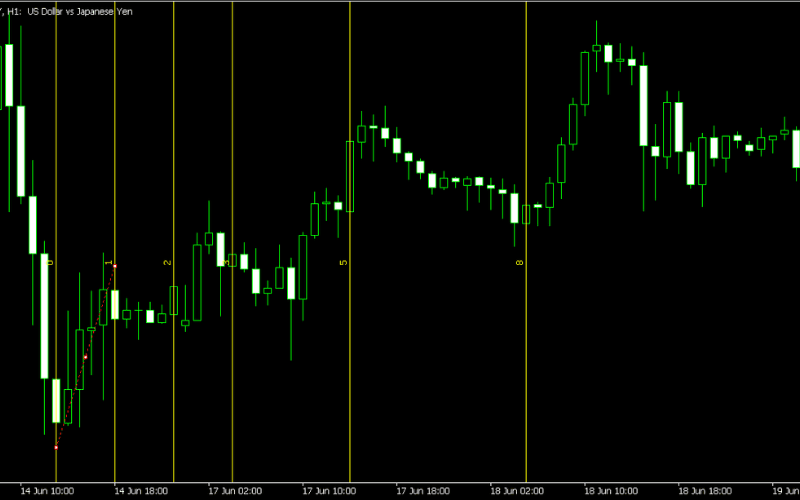
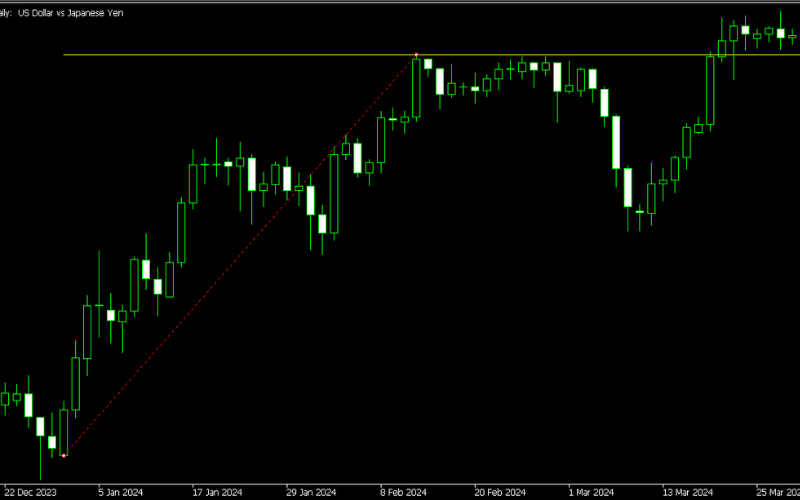
Fibonacci Time Zones
Fibonacci Time Zones is a unique tool in technical analysis that focuses on dividing the time axis using Fibonacci ratios, helping traders predict key time points for trend changes.
This tool is suitable for identifying time windows for trend reversals or accelerations, providing traders with a reference for the time dimension.
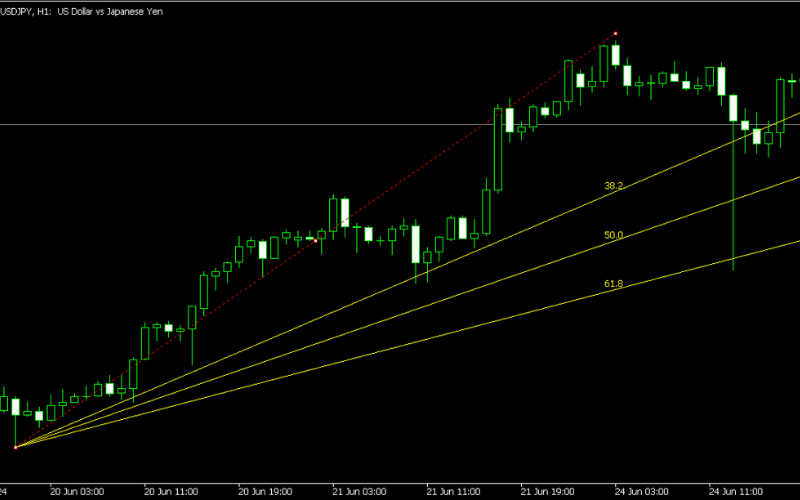
Fibonacci Fan
Fibonacci Fan is a technical analysis tool that combines price and time by drawing Fibonacci ratio lines in multiple directions from the trend starting point. It helps traders identify potential support and resistance areas.
This tool is used to predict key areas for price pullbacks or rebounds, particularly suited for trend-following trading.
Fibonacci Arcs
Fibonacci Arcs is a curved analysis tool that combines price and time. It draws Fibonacci ratio arcs between the trend start and end points, marking potential market change areas.
This tool is ideal for identifying key areas for price pullbacks or breakouts, especially in range-bound markets.
Fibonacci Expansion
Fibonacci Expansion is a tool used to predict price trend extension targets, helping traders set profit-taking goals or identify potential reversal points.
This tool is commonly used in trend-following trades, providing traders with clear references for profit-taking or scaling in positions.
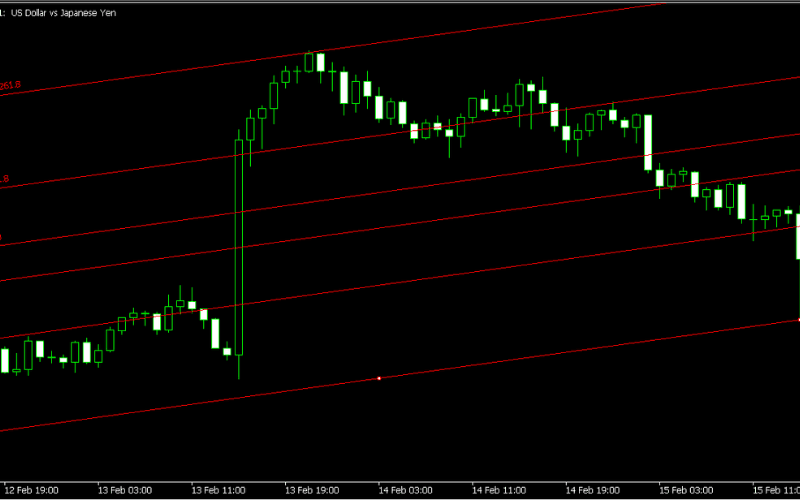
Fibonacci Channel
Fibonacci Channel is a technical analysis tool that combines trendlines and Fibonacci ratios. It creates parallel channel lines to help traders identify trend changes and breakout points.
This tool is ideal for predicting price fluctuations within a channel and recognizing breakout or reversal signals.
3. Drawing Fibonacci Tools (MT4/MT5)
While the basic steps for drawing Fibonacci tools are similar on MetaTrader 4 (MT4) and MetaTrader 5 (MT5) platforms, there are some differences in the interface and certain operations. Below is an introduction to how to draw Fibonacci tools on both MT4 and MT5 platforms.
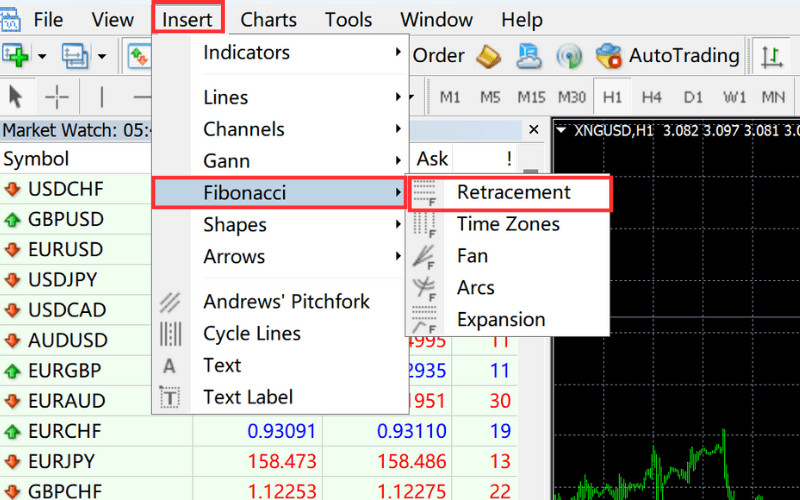
Drawing Fibonacci Tools on MT4
MT4 provides 5 types of Fibonacci tools.
① Log into MT4
② Open a chart for the trading instrument
③ Click "Insert" in the menu bar, then select "Fibonacci" and choose one of the Fibonacci tools.
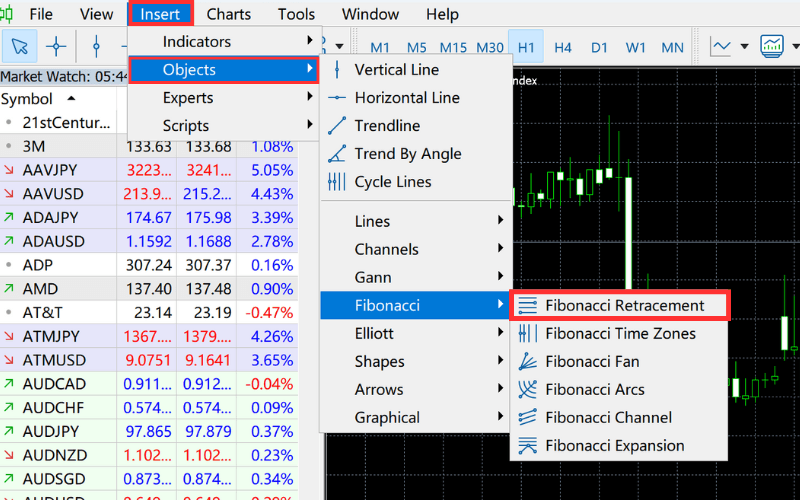
Drawing Fibonacci Tools on MT5
MT5 provides 6 types of Fibonacci tools.
① Log into MT5
② Open a chart for the trading instrument
③ Click "Insert" in the menu bar, then select "Objects" → "Fibonacci," and choose one of the Fibonacci tools.
4. Titan FX Free Custom Indicators (MT4/MT5)
Titan FX offers a range of custom indicators designed for MT4/MT5 platforms to assist traders in optimizing their strategies and improving decision-making accuracy. These tools provide valuable support for both beginner and experienced traders.
Auto Fibonacci Retracement (Titan_auto_fibonacci)
This indicator automatically draws Fibonacci retracement lines based on ZigZag movements.
The most recent movement is set to 1, and as the number increases, the Fibonacci retracement lines corresponding to previous ZigZag movements are automatically displayed.
Auto Fibonacci Retracement ToolMulti-Period Support and Resistance Lines (Titan_Support_Resistance)
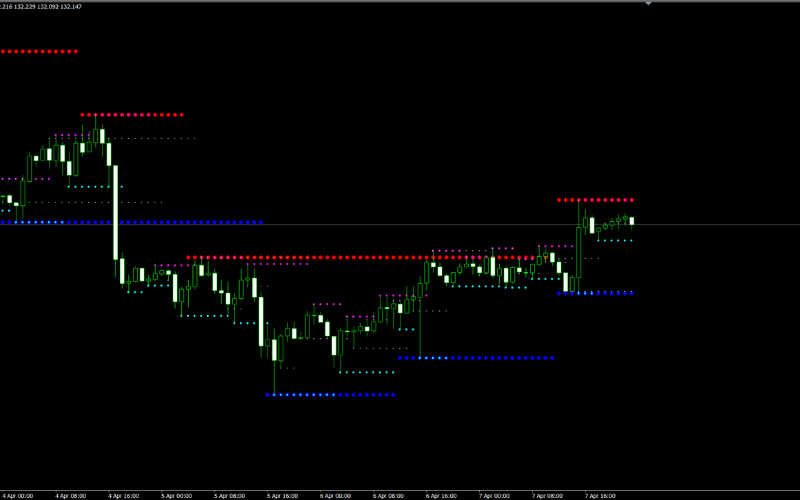
This indicator displays support and resistance levels on a chart using fractal calculations for short-term, medium-term, and long-term periods. Levels that have been significant as support or resistance in the past may become important turning points in the future.
Support and Resistance IndicatorDisplay Potential Support and Resistance Lines (Titan_SR_line)
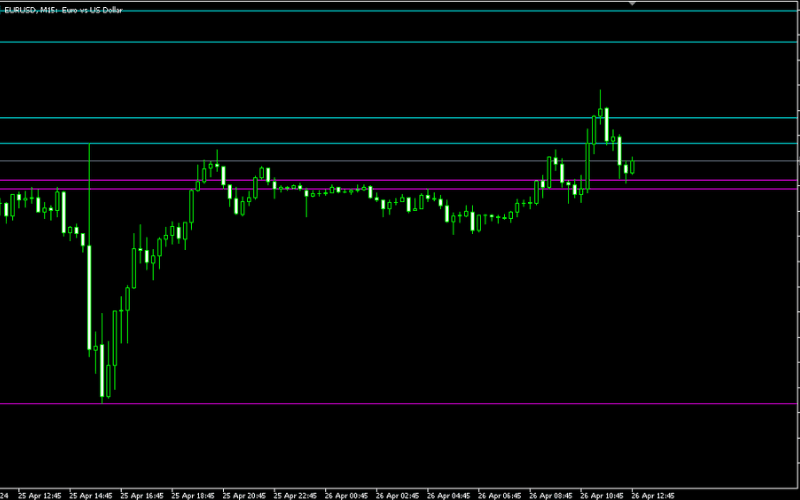
In the financial markets, predicting price fluctuations and identifying support and resistance levels is crucial. Our indicator can display key support and resistance levels, including high/low prices, pivot points, Moving Averages, and Relative Strength Index (RSI). These indicators help traders make more effective trading decisions.
Learn more and install the "SR Line"5. Fibonacci-Related Q&A
Q1: What is the difference between Fibonacci and Pivot Points?
The difference between Fibonacci tools (such as retracements and extensions) and pivot points lies in their calculation basis.
Fibonacci is based on specific price movements and uses the golden ratio from the Fibonacci sequence to calculate retracement, bounce, or extension targets.
Pivot points, on the other hand, are calculated based on the previous trading day's "candlestick data" and display potential support and resistance levels.
Q2: What is the answer to the "Rabbit Problem" in Fibonacci?
The "Rabbit Problem" originates from Fibonacci's book Liber Abaci and presents a mathematical scenario:
If a pair of rabbits reproduces after two months and produces a new pair every month thereafter, how many pairs of rabbits will there be after one year?
After 0-1 months, there will be one pair; after 2 months, there will be two pairs; after 3 months, there will be three pairs; after 4 months, there will be five pairs, and so on. This follows the Fibonacci sequence: 1, 1, 2, 3, 5, 8, 13, 21, 34, 55, 89, 144, 233... After 12 months, there will be 233 pairs of rabbits.
This problem is solved using the rules of the Fibonacci sequence, and the answer is that there will be 233 pairs of rabbits after one year.
6. Summary
The Fibonacci sequence, introduced by Italian mathematician Leonardo Fibonacci in the 13th century, originates from a rabbit population problem. Its sequence (1, 1, 2, 3, 5, 8...) and the golden ratios derived from it (61.8%, 38.2%, etc.) are widely applied in financial markets.
Fibonacci retracement tools help traders identify support and resistance levels during price pullbacks, while Fibonacci expansions are used to predict trend continuation targets. Combining these tools with technical analysis can improve the accuracy of trading strategies.
Although Fibonacci tools are simple and versatile, their subjectivity and limitations with historical data require caution. It is recommended to combine them with other indicators (such as Moving Averages and RSI) and risk management measures, as well as to utilize automated tools on MT4/MT5 platforms (such as the Fibonacci retracement indicator provided by Titan FX) for more robust opportunities in the market.
Further Reading
Titan FX's financial-market research team. We cover a broad set of instruments — foreign exchange, commodities (crude oil, precious metals, agricultural products), equity indices, US equities, and digital assets — producing educational content for investors.
Primary Sources (by Category)
- Fibonacci and ratio definitions: Investopedia — Fibonacci Retracement, BabyPips — Fibonacci
- Technical-analysis method: StockCharts — Fibonacci Retracements