Indicator for displaying support and resistance levels (Titan_SR_line)
Indicator Overview
It is important to consider support and resistance levels when forecasting price movements in financial markets. Levels such as highs/lows over a certain period, pivot levels, retracement levels against highs/lows of a certain period, and levels of technical indicators like moving averages and RSI are often focused on by many traders and are likely to be recognized as support or resistance levels. This indicator displays these levels on the chart as lines, highlighting potential support and resistance levels.
The items that can be displayed are as follows.
Hovering the cursor over a line on the chart allows you to check which level it represents through a tooltip.
| Item | Description |
|---|---|
| Previous day's high/low | Levels of the previous day's high and low |
| Last 30 days' high/low | Levels of the high and low over the past 30 days |
| Last 13 weeks' high/low | Levels of the high and low over the past 13 weeks |
| Last 52 weeks' high/low | Levels of the high and low over the past 52 weeks |
| Pivot (PP) | Pivot PP level |
| Pivot (S1) | Pivot S1 level |
| Pivot (S2) | Pivot S2 level |
| Pivot (S3) | Pivot S3 level |
| Pivot (R1) | Pivot R1 level |
| Pivot (R2) | Pivot R2 level |
| Pivot (R3) | Pivot R3 level |
| 1-month high/low retracement (38.2%) | Retracement level (38.2%) for the high/low of the past month |
| 1-month high/low retracement (50%) | Retracement level (50.0%) for the high/low of the past month |
| 1-month high/low retracement (61.8%) | Retracement level (61.8%) for the high/low of the past month |
| 13-week high/low retracement (38.2%) | Retracement level (38.2%) for the high/low of the past 13 weeks |
| 13-week high/low retracement (50.0%) | Retracement level (50.0%) for the high/low of the past 13 weeks |
| 13-week high/low retracement (61.8%) | Retracement level (61.8%) for the high/low of the past 13 weeks |
| 52-week high/low retracement (38.2%) | Retracement level (38.2%) for the high/low of the past 52 weeks |
| 52-week high/low retracement (50.0%) | Retracement level (50.0%) for the high/low of the past 52 weeks |
| 52-week high/low retracement (61.8%) | Retracement level (61.8%) for the high/low of the past 52 weeks |
| Moving average (20) | Level of the moving average over 20 days |
| Moving average (60) | Level of the moving average over 60 days |
| Moving average (90) | Level of the moving average over 90 days |
| Moving average (200) | Level of the moving average over 200 days |
| Standard deviation (1σ) | Standard deviation (1σ) level over 20 days |
| Standard deviation (2σ) | Standard deviation (2σ) level over 20 days |
| Standard deviation (3σ) | Standard deviation (3σ) level over 20 days |
| Standard deviation (-1σ) | Standard deviation (-1σ) level over 20 days |
| Standard deviation (-2σ) | Standard deviation (-2σ) level over 20 days |
| Standard deviation (-3σ) | Standard deviation (-3σ) level over 20 days |
| RSI reaching 80 level | RSI level reaching 80 on a daily chart |
| RSI reaching 70 level | RSI level reaching 70 on a daily chart |
| RSI reaching 30 level | RSI level reaching 30 on a daily chart |
| RSI reaching 20 level | RSI level reaching 20 on a daily chart |
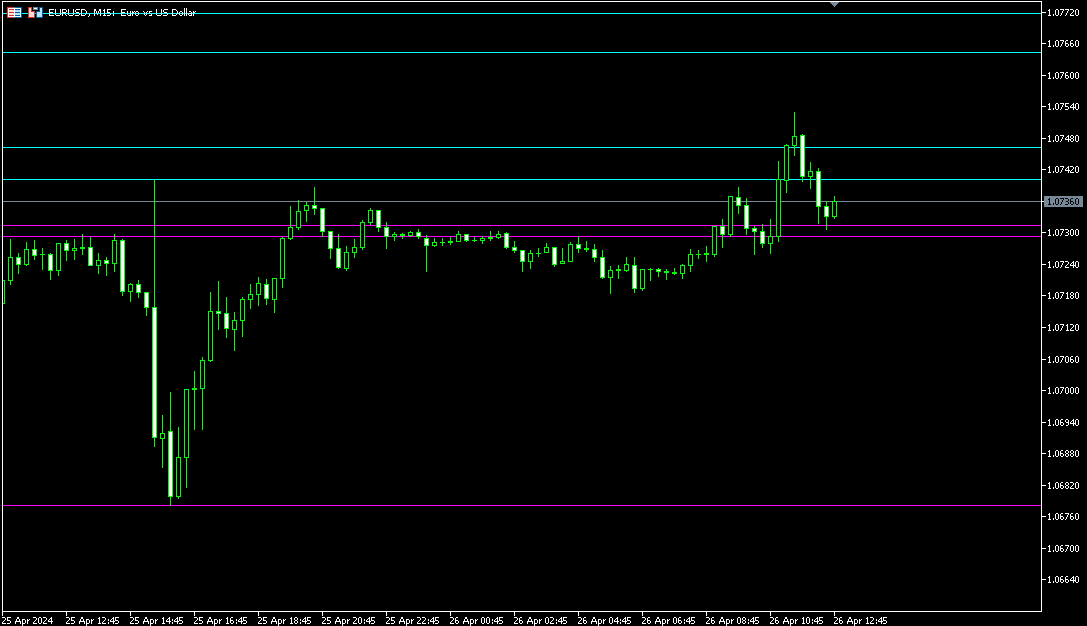
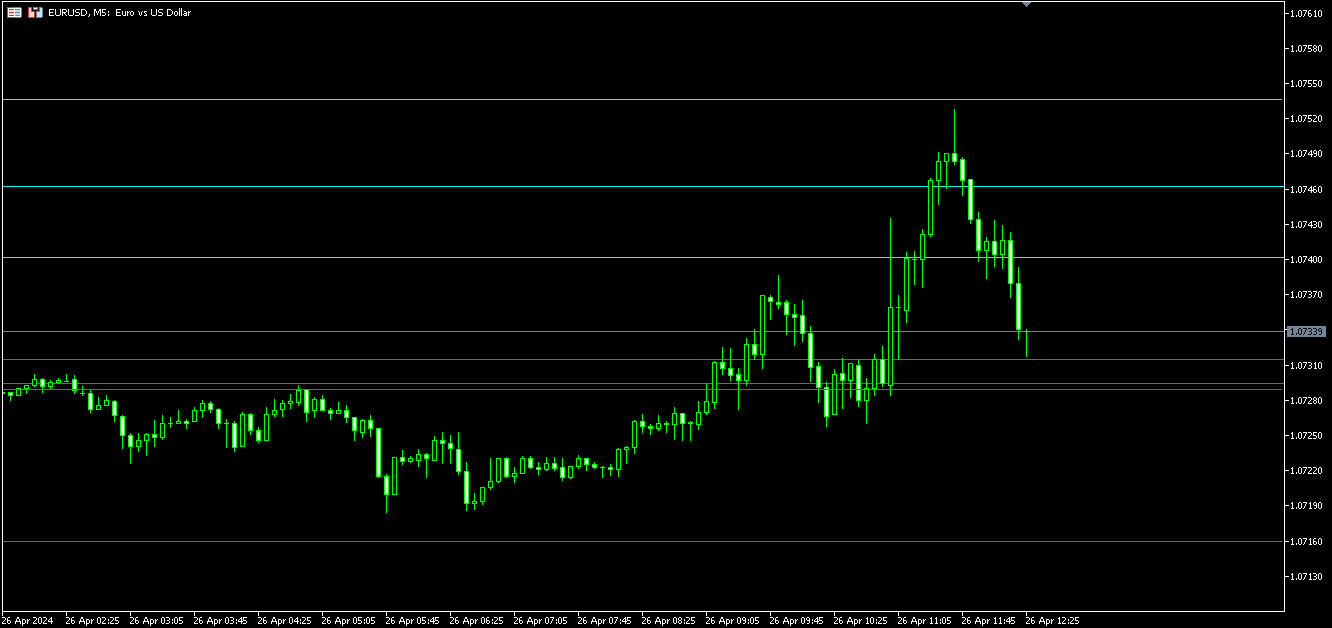
【Example of indicator displayed on a 5-minute EURUSD chart】
This indicator only works on the Windows version of TitanFX MT5 and MT4.
Indicator Terms of Use
Only those who agree to all the following items may use the indicators distributed on this website (https://research.titanfx.com):
1.The indicators and related descriptions are based on various data believed to be reliable, but their accuracy and completeness are not guaranteed.
2.The data displayed by the indicators do not guarantee your investment results. Also, the displayed content may vary due to market conditions and communication environments.
3.Please make investment decisions using indicators at your own risk. We are not responsible for any disadvantages or damages arising from the use of indicators.
4.Specifications of the indicators are subject to change without notice. Changes will be announced on the indicator description pages, etc.
5.Indicators should only be used by customers who have downloaded them. Transferring or selling the indicators to third parties is prohibited.
Indicator Settings
Input (for MT5) / Parameter Input (for MT4) Tab Settings
| Variable Name | Description | Default |
|---|---|---|
| Display Range (Number of Bars) | Specifies how far back in terms of bars to display. | 1000 |
| High/Low | Specifies whether to display lines for the highs and lows over a certain period. 'true' will display them. | true |
| Line color(support) | Specifies the color of lines for levels below the current level for highs/lows. | Magenta |
| Line color(resistance) | Specifies the color of lines for levels above the current level for highs/lows. | Aqua |
| Pivot | Specifies whether to display lines for pivot levels. 'true' will display them. | true |
| Line color(support) | Specifies the color of lines for pivot levels below the current level. | Magenta |
| Line color(resistance) | Specifies the color of lines for pivot levels above the current level. | Aqua |
| RSI | Specifies whether to display lines for RSI levels. 'true' will display them. | true |
| Line color(support) | Specifies the color of lines for RSI levels below the current level. | Magenta |
| Line color(resistance) | Specifies the color of lines for RSI levels above the current level. | Aqua |
| Retracement | Specifies whether to display lines for retracement levels. 'true' will display them. | true |
| Line color(support) | Specifies the color of lines for retracement levels below the current level. | Magenta |
| Line color(resistance) | Specifies the color of lines for retracement levels above the current level. | Aqua |
| Moving average | Specifies whether to display lines for moving average levels. 'true' will display them. | true |
| Line color(support) | Specifies the color of lines for moving average levels below the current level. | Magenta |
| Line color(resistance) | Specifies the color of lines for moving average levels above the current level. | Aqua |
| Standard deviation | Specifies whether to display lines for standard deviation levels. 'true' will display them. | true |
| Line color(support) | Specifies the color of lines for standard deviation levels below the current level. | Magenta |
| Line color(resistance) | Specifies the color of lines for standard deviation levels above the current level. | Aqua |
Color (for MT5) / Color Settings (for MT4) Tab Settings
| MT5 | MT4 | Description |
|---|---|---|
| Pivot(R3) | 0 | Sets the thickness and style of the Pivot R3 line. (Color is set in parameters) |
| Pivot(R2) | 1 | Sets the thickness and style of the Pivot R2 line. (Color is set in parameters) |
| Pivot(R1) | 2 | Sets the thickness and style of the Pivot R1 line. (Color is set in parameters) |
| Pivot(PP) | 3 | Sets the thickness and style of the Pivot PP line. (Color is set in parameters) |
| Pivot(S1) | 4 | Sets the thickness and style of the Pivot S1 line. (Color is set in parameters) |
| Pivot(S2) | 5 | Sets the thickness and style of the Pivot S2 line. (Color is set in parameters) |
| Pivot(S3) | 6 | Sets the thickness and style of the Pivot S3 line. (Color is set in parameters) |
| Moving average(20) | 7 | Sets the thickness and style of the Moving Average 20 line. (Color is set in parameters) |
| Moving average(60) | 8 | Sets the thickness and style of the Moving Average 60 line. (Color is set in parameters) |
| Moving average(90) | 9 | Sets the thickness and style of the Moving Average 90 line. (Color is set in parameters) |
| Moving average(200) | 10 | Sets the thickness and style of the Moving Average 200 line. (Color is set in parameters) |
| Standard deviation(3σ) | 11 | Sets the thickness and style of the Standard Deviation 3σ line. (Color is set in parameters) |
| Standard deviation(2σ) | 12 | Sets the thickness and style of the Standard Deviation 2σ line. (Color is set in parameters) |
| Standard deviation(1σ) | 13 | Sets the thickness and style of the Standard Deviation 1σ line. (Color is set in parameters) |
| Standard deviation(-1σ) | 14 | Sets the thickness and style of the Standard Deviation -1σ line. (Color is set in parameters) |
| Standard deviation(-2σ) | 15 | Sets the thickness and style of the Standard Deviation -2σ line. (Color is set in parameters) |
| Standard deviation(-3σ) | 16 | Sets the thickness and style of the Standard Deviation -3σ line. (Color is set in parameters) |