Fibonacci Retracement Guide: Sequence, Drawing, Pros & Cons

Fibonacci retracement is a technical-analysis tool that uses Fibonacci ratios (23.6%, 38.2%, 50%, 61.8%, 78.6%) to mark potential support and resistance levels within a price pullback.
When a trend pulls back, the question every trader asks is where the move might pause or reverse. Fibonacci retracement is so widely used precisely because it answers that — by mapping a few key ratios of a prior swing onto the chart, it turns potential support and resistance into clear, visual levels that work across stocks, FX, and futures.
This article will introduce the basics of Fibonacci Retracement, including the origin and definition of the Fibonacci sequence, step-by-step drawing methods, a comprehensive analysis of advantages and disadvantages, and practical methods for analyzing support and resistance levels.
- Core idea: maps Fibonacci ratios onto a pullback to show support/resistance
- Common levels: 23.6%/38.2%/50%/61.8%/78.6%, 61.8% is the golden one
- Roots: derived from the Fibonacci sequence and golden ratio (~1.618)
- Drawing: low-to-high in uptrends, high-to-low in downtrends; point choice is subjective
- Use it well: prone to false signals, confirm with MA/RSI and price action
- 1. The Origin of the Fibonacci Sequence
- 2. Definition of the Fibonacci Sequence
- 3. The Golden Ratio
- 4. Formula and Common Levels of Fibonacci Retracement
- 5. Advantages and Disadvantages of Fibonacci Retracement
- 6. Fibonacci Retracement Drawing Method (MT4/MT5)
- 7. Custom Indicators Provided by Titan FX (MT4/MT5)
- 8. Fibonacci Retracement FAQs
- 9. Conclusion
1. The Origin of the Fibonacci Sequence
The Fibonacci sequence is named after the Italian mathematician Fibonacci, i.e., Leonardo of Pisa. He lived in the 13th century and was one of the most famous mathematicians of medieval Europe. It was in the book published in 1202, Liber Abaci, that Fibonacci first introduced this sequence.
The discovery of the Fibonacci sequence originated from an interesting mathematical question involving rabbit reproduction under ideal conditions. The assumption is that a pair of rabbits reproduces a new pair every month, and the newborns also start to reproduce from their second month of life. If it starts from a pair of rabbits, how many pairs of rabbits will there be after several months? Fibonacci derived the renowned Fibonacci sequence while solving this question.
This sequence is not only widely applicable in mathematics but also observable in nature. For example, the arrangement of sunflower seeds, the spiral shape of shells, and the distribution of pinecone scales all demonstrate the patterns of the Fibonacci sequence. It has also been utilized in financial analysis, such as FX and stock markets.
2. Definition of the Fibonacci Sequence
The Fibonacci sequence is an infinite series starting with 0 and 1, with each subsequent number being the sum of the two preceding numbers. Its formula is as follows:
F(0) = 0,
F(1) = 1,
F(n) = F(n–1) + F(n–2) (n≥2)
Some of the initial terms of the Fibonacci sequence are as follows:
0, 1, 1, 2, 3, 5, 8, 13, 21, 34, 55, 89, ...
This sequence has many interesting properties, one of which is its relation to the Golden Ratio. The Golden Ratio is approximately 1.618, and as the sequence progresses, the ratio of each term to its preceding term approaches this golden ratio.
3. The Golden Ratio
The Golden Ratio (𝜙, Phi) refers to the ratio of two numbers that equals the ratio of their sum to the larger number, i.e.:
𝜙 = (𝑎+𝑏)/𝑎 = 𝑎/𝑏,
Where,𝜙 ≈ 1.6180339887…
In the Fibonacci sequence, the ratio between consecutive terms approaches the Golden Ratio as the sequence progresses.
5/3 ≈ 1.666,
8/5 ≈ 1.6,
13/8 ≈ 1.625,
21/13 ≈ 1.615
This relationship is not only found in mathematics but also prevalent in nature, art, and architecture. The Fibonacci sequence and the Golden Ratio form the basis for many aesthetic and natural phenomena.
4. Formula and Common Levels of Fibonacci Retracement
Fibonacci Retracement lines are based on the ratios derived from the Fibonacci sequence, which facilitate traders in developing buy and sell strategies through the calculation of critical levels of price retracement. The formula and commonly used levels of Fibonacci Retracement are as follows.
Formula of Fibonacci Retracement
The levels of Fibonacci Retracement are calculated as percentages of the price movement from the start point (low) to the end point (high) of a trend.
Common retracement levels include 23.6%, 38.2%, 50%, 61.8%, and 78.6%.
These levels refer to the percentages of price retracement, i.e., the ratio of price retrace from a high level to a low level. Each retracement level has its important meaning.
The calculation formula and meaning of the retracement level are as follows:
Assuming the price has risen from lower level A to higher level B, then the Fibonacci Retracement levels can be calculated by the following formulas:
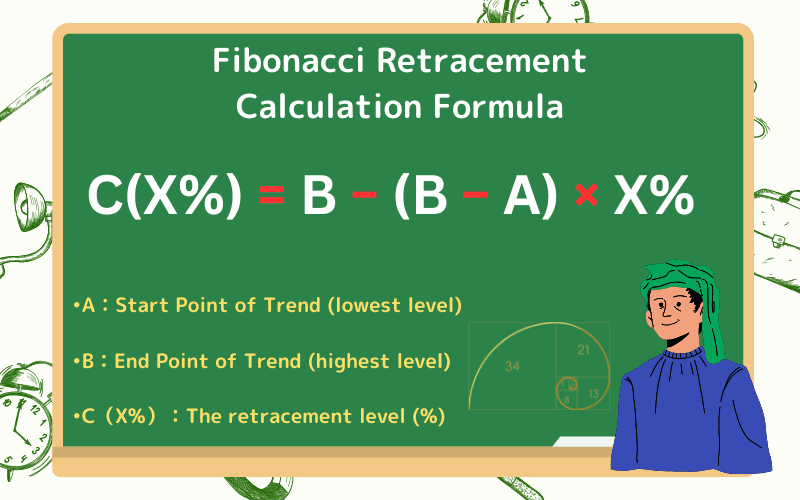
C (X%) = B – (B – A) × X%
Where:
• A: Start Point of Trend (lowest level)
• B: End Point of Trend (highest level)
• C: The retracement level (%)
| Retracement Level | Formula | Description |
|---|---|---|
| 23.6% | C (23.6%) = B – (B – A) × 0.236 | Weak pullback in an uptrend; minor rebound in a downtrend. |
| 38.2% | C (38.2%) = B – (B – A) × 0.382 | Common support level in an uptrend; common resistance level in a downtrend. |
| 50% | C(50%) = B – (B – A) × 0.5 | A psychological level, widely used in technical analysis, common in both uptrend and downtrend. |
| 61.8% | C(61.8%) = B – (B – A) × 0.618 | The level is based on the Golden Ratio, the support level in an uptrend, and the resistance level in a downtrend. |
| 78.6% | C(78.6%) = B – (B – A) × 0.786 | Deep retracement in an uptrend or strong rebound in a downtrend, indicating a possible trend reversal. |
5. Advantages and Disadvantages of Fibonacci Retracement
As a technical analysis tool, while Fibonacci Retracement has wide application and significance, it also has limitations. The advantages and disadvantages of Fibonacci Retracement are as follows:
Advantages of Fibonacci Retracement
| Advantages | Description |
|---|---|
| Easy to Use | The drawing and use of Fibonacci Retracement is relatively easy, only requiring identification of the start and end points of the trend. |
| Clear and Straightforward | Fibonacci Retracement clearly demonstrates potential levels of support and resistance, helping traders identify key levels of price changes quickly. |
| Wide Applicability | Fibonacci Retracement can be used across various markets, including stocks, FX, futures, and crypto, and is useful for both short-term and long-term investments. |
| Historically Validated | Fibonacci Retracement is based on historical price data, with many traders finding that these levels were effective in past markets. |
| Can Be Improved by Other Tools | Fibonacci Retracement can be combined with other technical tools, such as moving averages and RSI, enhancing the accuracy of trading strategies. |
Disadvantages of Fibonacci Retracement
| Disadvantages | Description |
|---|---|
| Subjectivity | The selection of start and end points for the trend is subjective, and different traders may choose different points, resulting in different retracement levels. |
| Over-reliance on History | Fibonacci Retracement is based on historical price data, but market movements are unpredictable, and past data may not accurately reflect future trends. |
| False Signals | Fibonacci Retracement levels do not always work, and market fluctuations may produce false signals, leading traders to make incorrect judgments. |
| Needs to Be Combined with Other Tools | The accuracy of Fibonacci Retracement is low when used alone, and it is best used in conjunction with other tools to improve the effectiveness of a trading strategy. |
| Impact of Market Sentiment | Fibonacci Retracement cannot account for market sentiment, and external events such as news or financial crises can cause markets to deviate from predicted levels. |
6. Fibonacci Retracement Drawing Method (MT4/MT5)
Fibonacci Retracement is a simple and effective technical analysis tool that helps traders determine potential levels of support and resistance. Below are the detailed steps for drawing Fibonacci Retracement lines:
Step 1: Select the Start and End Points of the Trend
First, identify a clear price trend. This could be either an uptrend or a downtrend.
In an uptrend, select the start point (lowest point) and the end point (highest point).
In a downtrend, select the start point (highest point) and the end point (lowest point).
Step 2: Draw the Fibonacci Retracement Line
Find the Fibonacci Retracement tool in your charting software, which is typically available in most trading platforms.
After selecting the Fibonacci Retracement tool, follow these steps to draw the retracement:
In an uptrend:
Draw a line from the start point (lowest point) to the end point (highest point).
In a downtrend:
Draw a line from the start point (highest point) to the end point (lowest point).
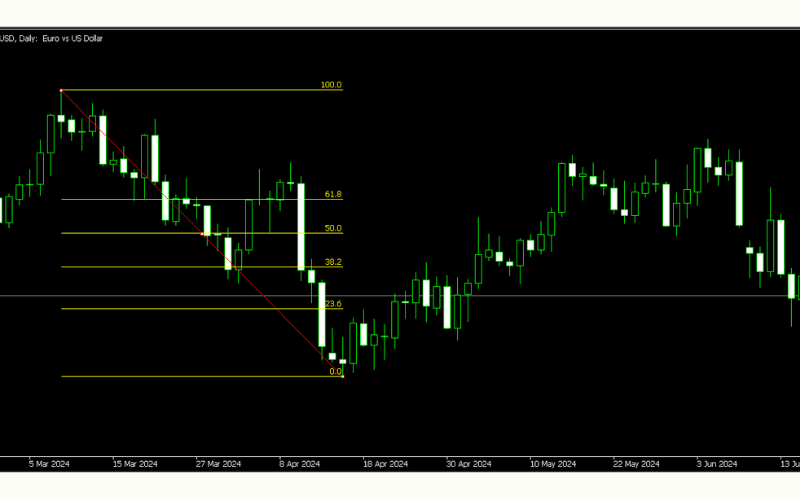
The system will automatically calculate and plot the Fibonacci Retracement levels, which typically include 23.6%, 38.2%, 50%, 61.8%, and 78.6%.
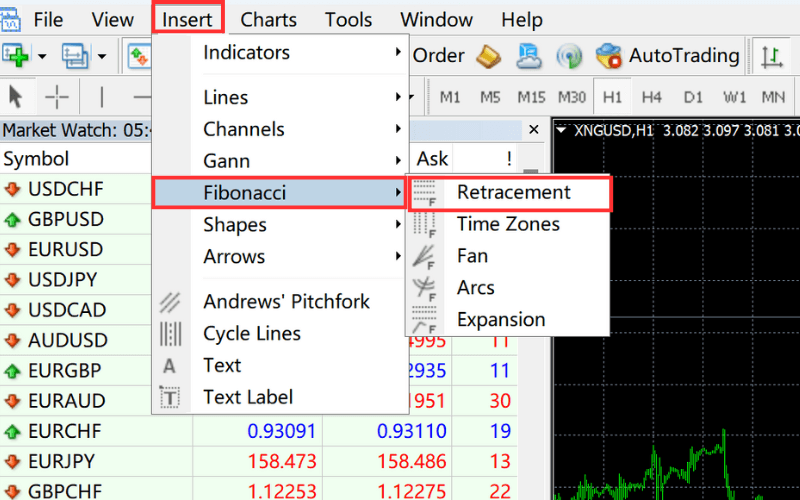
MT4 Drawing Method:
Go to the menu bar and click on "Insert - Fibonacci - Retracement."
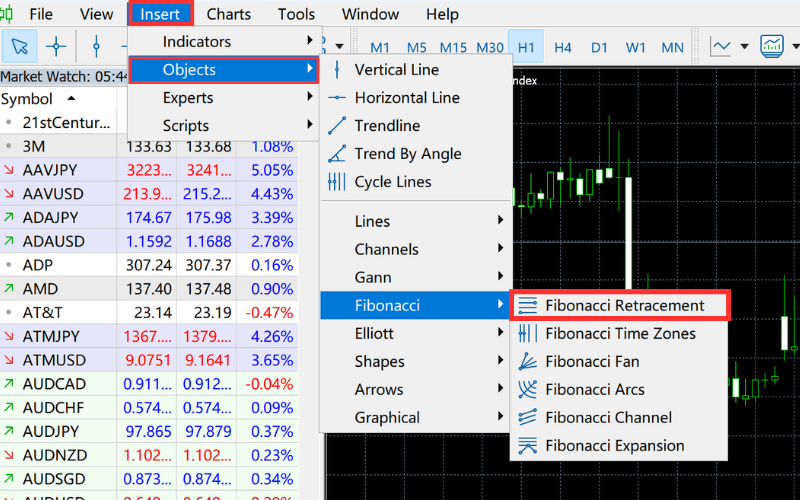
MT5 Drawing Method:
Go to the menu bar and click on "Insert - Objects - Fibonacci - Fibonacci Retracement."
Step 3: Identify Key Support and Resistance Levels
After drawing the Fibonacci Retracement lines, observe how the price behaves at the various retracement levels. Each retracement level could become a potential support or resistance level, applied as follows:
Support
In an uptrend, if the price retraces to a certain Fibonacci level (such as 38.2% or 61.8%) and holds, this level may act as a support.
Resistance
In a downtrend, if the price retraces to a certain Fibonacci level (such as 38.2% or 61.8%) and faces resistance, this level may act as a resistance.
7. Custom Indicators Provided by Titan FX (MT4/MT5)
Titan FX offers many free custom indicators for MT4/MT5 platforms. These indicators are designed to help traders optimize their strategies and improve the accuracy of their trading decisions. Whether you are a beginner or an experienced trader, these tools provide powerful support for your trading activities.
Auto Fibonacci Retracement (Titan_auto_fibonacci)
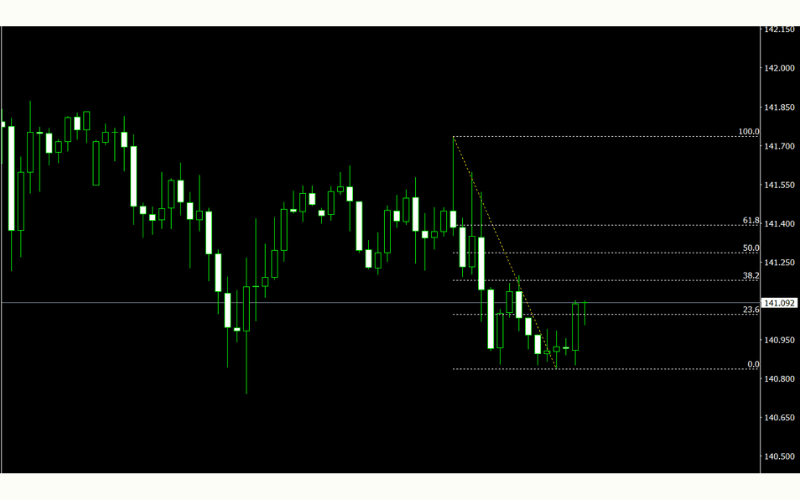
This indicator automatically draws Fibonacci retracement levels based on the most recent ZigZag wave. The most recent wave is set to 1, and as the number increases, Fibonacci retracement levels are automatically displayed relative to previous ZigZag movements.
Learn more and install the "Auto Fibonacci Retracement Tool"Multi-Timeframe Support and Resistance Levels (Titan_Support_Resistance)
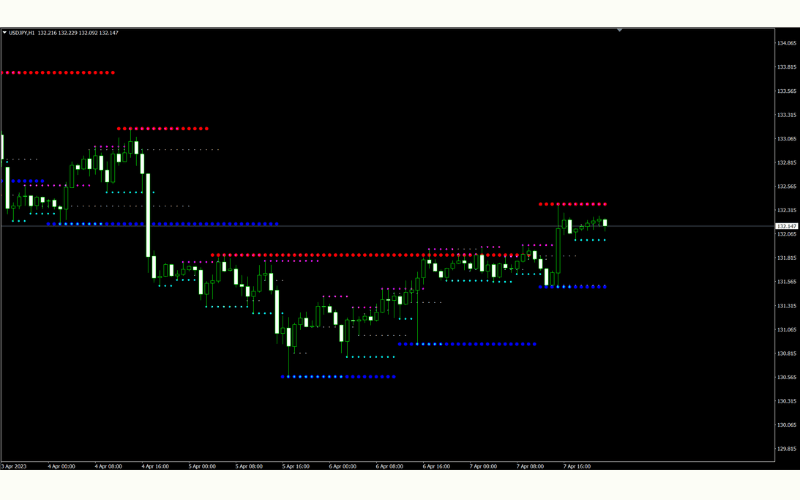
This indicator displays support and resistance levels based on short-term, medium-term, and long-term time frames, calculated using fractals. Levels from multiple timeframes that have previously acted as support or resistance are likely to become key turning points in the future.
Learn more and install the "Multi-Timeframe Support and Resistance IndicatorSupport and Resistance Line Indicator (Titan_SR_line)
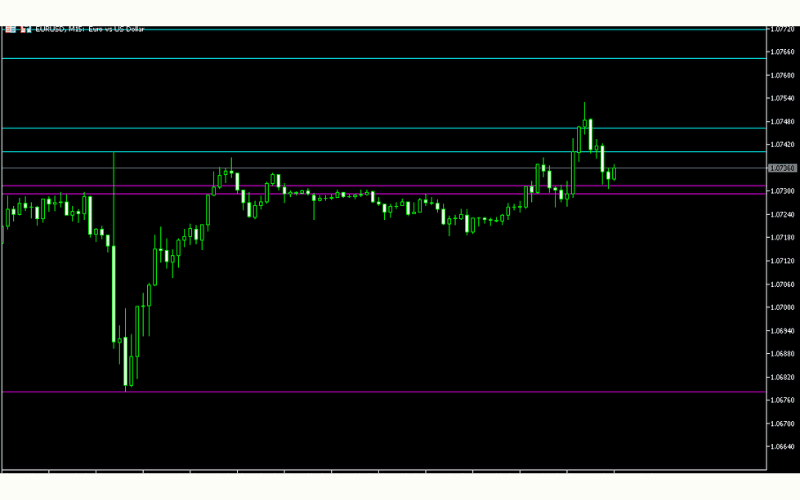
In financial markets, predicting price movements and identifying support and resistance levels is crucial. This indicator displays key support and resistance levels on the chart, including high/low prices, pivot points, moving averages, and the Relative Strength Index (RSI). These indicators help traders make more informed trading decisions.
Learn more and install the "Support and Resistance Line Indicator"8. Fibonacci Retracement FAQs
Q1. What are the common Fibonacci retracement levels?
The most-used levels are 23.6%, 38.2%, 50%, 61.8% and 78.6% — 61.8% is the "golden" retracement and 50% is a widely watched psychological level. See §4.
Q2. Is 50% really a Fibonacci level?
Strictly, 50% is not derived from the Fibonacci sequence, but because price often reacts at a half retracement it is commonly included alongside the true ratios.
Q3. How do I choose the start and end points?
Draw from a clear swing low to the high in an uptrend, and from the high to the low in a downtrend. The choice is subjective, so anchor it to an obvious swing. See §6.
Q4. Can I use Fibonacci retracement on its own?
It's not recommended — it can give false signals, so cross-check it with tools like moving averages, RSI, or price action. See §5.
Q5. Which markets does it work in?
Any trending market — stocks, FX, futures, and crypto — across both short- and long-term horizons.
9. Conclusion
Fibonacci retracement blends mathematical logic with market psychology into a practical way to anticipate where price may find support or resistance. Whether you trade stocks, futures, or FX, learning to apply it flexibly can sharpen both your entries and your risk management. For the best results, use it alongside other indicators or price action rather than on its own.
Further Reading
- Fibonacci types and drawing methods
- Moving Average (MA) explained
- What is RSI?
- What is technical analysis?
- Titan_auto_fibonacci indicator
Titan FX Trading Strategy Lab. We produce investor-education content covering forex, commodities (crude oil, precious metals, agricultural goods), stock indices, U.S. equities, and digital assets.
Primary Sources (by Category)
- Origin & math background: Fibonacci (Leonardo of Pisa), Liber Abaci (1202) — first record of the Fibonacci sequence
- Titan FX official: Fibonacci types & drawing methods, Technical analysis