What Is the Dow Jones Industrial Average (US30)? Components & Trading Guide
US30 (the Dow Jones Industrial Average) is a price-weighted index tracking 30 U.S. large-cap blue-chip companies across financials, technology, healthcare, consumer, and industrials — widely seen as a key barometer of the U.S. economy. Its steady volatility and deep liquidity make it one of the most representative instruments in global index CFD trading.
US30 is also one of the world's oldest stock indices, created by Charles Dow in 1896 — over a century ago. Unlike most market-cap-weighted indices, the Dow weights its members by share price, so higher-priced stocks move the index more — a quirk that strongly shapes its behavior and trading logic.
For CFD traders, whether tracking the market's reaction to a Fed rate decision or catching short-term swings in blue chips during earnings season, US30 offers diverse opportunities. This article systematically breaks down US30's trading logic, from index construction and price drivers to practical strategies.
- What US30 is and how a price-weighted index is calculated
- The latest 30 constituents and nine-sector distribution
- Recent moves (2019–2025) and the main price drivers
- US30's advantages, risks, and practical trading strategies
- Steps to trade US30 at Titan FX and tips for beginners
- 1. What Is the Dow Jones Industrial Average (US30)?
- 2. Major Constituents and Sector Allocation
- 3. Recent Price History (2019-2025)
- 4. Key Factors Influencing Prices
- 5. Advantages and Risks of Trading
- 6. Practical Trading Strategies
- 7. How to Trade US30 on Titan FX
- 8. Key Considerations for Beginners
- 9. Top Constituents by Index Impact
- 10. How the Price-Weighted Average is Calculated
- 11. Typical Price Action After Major Events
- 12. Real-Time Chart and Trading Conditions
- 13. Frequently Asked Questions
What Is the Dow Jones Industrial Average (US30)?
The Dow Jones Industrial Average (DJIA, commonly known as "the Dow") was established in 1896 and is a price-weighted stock index compiled by S&P Dow Jones Indices, tracking 30 of the most representative large-cap blue-chip companies in the United States. Unlike the Nasdaq 100 Index (NAS100), which excludes financial stocks, US30 encompasses financials, technology, healthcare, consumer goods, and industrials, making it widely regarded as a barometer for the overall U.S. economy.
| Item | Details |
|---|---|
| Official Name | Dow Jones Industrial Average (DJIA) |
| Trading Symbol | US30 (CFD) / DJIA (Index Code) |
| Year Established | 1896 |
| Number of Constituents | 30 (adjusted periodically) |
| Weighting Method | Price-weighted |
| Review Frequency | Ad hoc, by the Wall Street Journal editorial committee |
| Representative ETF | SPDR DIA (AUM exceeding $30 billion) |
| Base Currency | U.S. Dollar (USD) |
How US30 Is Calculated
US30 uses a price-weighted methodology, calculated by dividing the sum of all 30 constituent stock prices by the Dow Divisor:
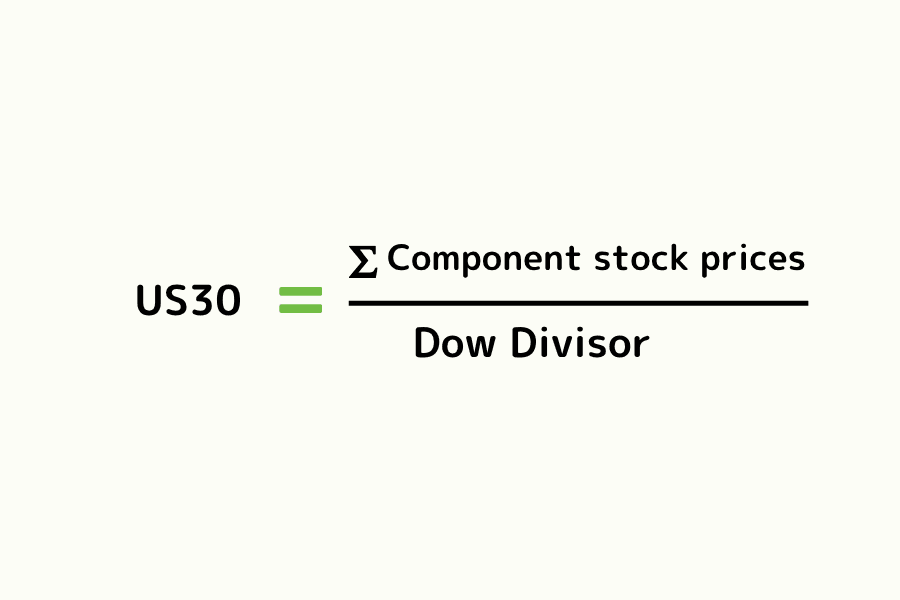
The Dow Divisor is adjusted whenever constituent changes, stock splits, or other corporate actions occur, ensuring the index's continuity. The price-weighted methodology means that higher-priced stocks have a greater impact on the index, which is fundamentally different from the market-cap weighting used by S&P 500 (US500) and NAS100.
This calculation method is similar to the Nikkei 225 (JPN225), where both indices determine weighting by stock price rather than market capitalization.
Major Constituents and Sector Allocation
US30 comprises 30 U.S. blue-chip companies spanning multiple sectors, with constituents adjusted periodically by the Wall Street Journal editorial committee. Below is the current constituent list (sorted alphabetically by ticker):
| No. | Ticker | Company Name | Sector |
|---|---|---|---|
| 1 | AAPL | Apple | Information Technology |
| 2 | AMGN | Amgen | Healthcare |
| 3 | AMZN | Amazon | Consumer Discretionary |
| 4 | AXP | American Express | Financials |
| 5 | BA | Boeing | Industrials |
| 6 | CAT | Caterpillar | Industrials |
| 7 | CRM | Salesforce | Information Technology |
| 8 | CSCO | Cisco Systems | Information Technology |
| 9 | CVX | Chevron | Energy |
| 10 | DIS | Walt Disney | Communication Services |
| 11 | GS | Goldman Sachs | Financials |
| 12 | HD | Home Depot | Consumer Discretionary |
| 13 | HON | Honeywell | Industrials |
| 14 | IBM | IBM | Information Technology |
| 15 | JNJ | Johnson & Johnson | Healthcare |
| 16 | JPM | JPMorgan Chase | Financials |
| 17 | KO | Coca-Cola | Consumer Staples |
| 18 | MCD | McDonald's | Consumer Discretionary |
| 19 | MMM | 3M Company | Industrials |
| 20 | MRK | Merck | Healthcare |
| 21 | MSFT | Microsoft | Information Technology |
| 22 | NKE | Nike | Consumer Discretionary |
| 23 | NVDA | NVIDIA | Information Technology |
| 24 | PG | Procter & Gamble | Consumer Staples |
| 25 | SHW | Sherwin-Williams | Materials |
| 26 | TRV | Travelers Companies | Financials |
| 27 | UNH | UnitedHealth Group | Healthcare |
| 28 | V | Visa | Financials |
| 29 | VZ | Verizon Communications | Communication Services |
| 30 | WMT | Walmart | Consumer Staples |
Constituents are compiled from S&P Dow Jones Indices public data and the SPDR DIA ETF report (in November 2024 NVIDIA replaced Intel and Sherwin-Williams replaced Dow Inc.); for reference only.
Sector Allocation
| Sector | Weight (approx.) | Representative Companies |
|---|---|---|
| Financials | ~21% | Goldman Sachs, JPMorgan Chase, Visa, American Express |
| Information Technology | ~19% | Microsoft, Apple, Salesforce, NVIDIA, IBM |
| Healthcare | ~18% | UnitedHealth, Amgen, Johnson & Johnson, Merck |
| Industrials | ~15% | Caterpillar, Honeywell, Boeing, 3M |
| Consumer Discretionary | ~13% | Home Depot, McDonald's, Amazon, Nike |
| Consumer Staples | ~7% | Procter & Gamble, Coca-Cola, Walmart |
| Materials | ~5% | Sherwin-Williams |
| Energy | ~3% | Chevron |
| Communication Services | ~2% | Verizon, Walt Disney |
Note: US30 is a price-weighted index, so these sector weights are based on constituent share prices, shift with price moves, and are approximate.
Compared with NAS100, where tech exceeds 50%, US30's sector distribution is more balanced. Financials and technology are the core drivers, while healthcare and consumer staples provide defensive support, keeping US30 relatively stable across different market environments.
Recent Price History (2019-2025)
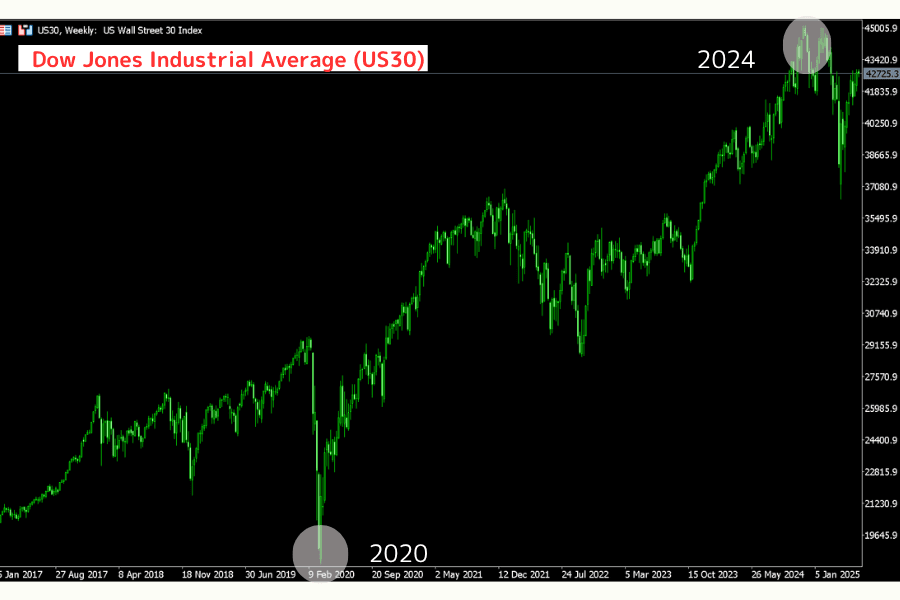
US30's price action reflects the combined effects of global economic cycles, Federal Reserve policy, market risk appetite, and sector rotation.
2019: Steady Expansion (+22%)
U.S. GDP growth remained robust while unemployment held at low levels. Financial and technology stocks drove the index to repeated all-time highs, finishing the year with gains exceeding 22%.
2020: Pandemic Shock and V-Shaped Recovery
The COVID-19 outbreak triggered the sharpest decline since the 2008 financial crisis in Q1. Subsequently, trillions of dollars in U.S. fiscal stimulus, combined with the Fed's emergency rate cuts to near-zero and unlimited quantitative easing, propelled a V-shaped recovery, with US30 finishing the year in positive territory.
2021: Post-Pandemic Recovery and Sector Rotation (+19%)
As vaccination rates increased and the labor market recovered, financials, industrials, and energy stocks led the advance. Corporate earnings reached record highs, pushing the index to new all-time highs repeatedly. However, inflation pressures emerged toward year-end, raising concerns about a Fed policy pivot.
2022: Correction Under Rate Hike Pressure (-9%)
The Fed launched an aggressive rate-hiking cycle, raising rates by 425 basis points over the year to 5.25-5.50%. Inflation pressures, rising energy prices, and supply chain bottlenecks continued to weigh on markets. Compared to NAS100's -33% decline, US30's losses were relatively contained thanks to its balanced sector composition.
2023: Defensive Rotation in a High-Rate Environment
As markets digested the "higher for longer" interest rate outlook, capital rotated toward stable cash-flow blue-chip stocks. Healthcare and consumer staples became safe havens, and US30 posted a modest gain for the year.
2024: Dovish Pivot and Strong Rebound (+13%)
The Fed's rate-hiking pace slowed, while AI and automation drove increased corporate capital expenditure. Technology and industrial stocks staged a powerful comeback, with US30 rallying throughout the year toward all-time highs.
2025 (Year-to-Date): Policy and Geopolitics Drive Volatility
Inflation eased but remained above target, with markets pricing in sustained high rates. Geopolitical uncertainty intensified around U.S.-China tariff negotiations and supply chain restructuring, elevating volatility. Consumer and healthcare stocks performed steadily, but the first half of the year saw mostly range-bound trading.
Key Factors Influencing Prices
Macroeconomic Environment
US30 is highly sensitive to U.S. economic fundamentals. The following indicators merit close attention:
- GDP Growth Rate: Economic expansion drives corporate earnings growth, directly benefiting blue-chip performance
- CPI (Consumer Price Index): Inflation data directly affects the Fed's interest rate decisions, which in turn impacts market valuations
- Non-Farm Payrolls (NFP): Labor market conditions reflect economic vitality, influencing financial and consumer stocks
- ISM Manufacturing Index: With significant industrial stock representation in US30, PMI expansion (>50) typically benefits the index
- Consumer Confidence: U.S. consumer spending accounts for roughly 70% of GDP, directly affecting constituents like Amazon, Walmart, and Disney
Industry and Company Factors
- Earnings Season Impact: During the concentrated earnings periods in January, April, July, and October, a single large constituent beating or missing expectations can move the index by hundreds of points
- Financial Sector Performance: Financial stocks like JPMorgan Chase, Goldman Sachs, and Visa tend to benefit in rising rate environments as wider spreads boost net interest income
- Industrial and Energy Cycles: Constituents like Boeing, Caterpillar, and Chevron are closely tied to global trade activity and commodity prices
- Corporate Actions: M&A deals, share buybacks, dividends, and restructurings can trigger short-term volatility
Geopolitical Factors
- Trade Policy: Import tariffs raise manufacturing costs and compress corporate margins. U.S.-China tariff negotiations in 2025 had a particularly notable impact on US30 volatility
- Supply Chain Risks: Geopolitical conflicts and logistics disruptions affect industrial and consumer constituent supply chains
- Geopolitical Uncertainty: Wars, sanctions, and policy shifts suppress corporate investment appetite and market confidence
Monetary Policy
The Federal Reserve's (FOMC) interest rate decisions represent one of the most important single factors affecting US30.
- Rate Cuts/Easing: Lower borrowing costs encourage capital expenditure and risk appetite, benefiting US30
- Rate Hikes/Tightening: Higher funding costs compress valuations and suppress consumption and investment
- Quantitative Easing (QE)/Quantitative Tightening (QT): Directly impacts market liquidity and risk appetite
The Fed's emergency rate cuts driving the V-shaped recovery in 2020, and the aggressive rate hikes leading to the 2022 correction, vividly demonstrate monetary policy's powerful influence on US30.
Use Titan FX's Economic Calendar to track the release timing and market expectations for all major economic data in real time.
Advantages and Risks of Trading
Advantages
-
Strong Market Representation: Covers 30 of the most prominent and influential U.S. companies, reflecting overall economic vitality and industry trends
-
Corporate Stability: Constituents are mature blue-chip companies with stable earnings and strong cash flows, offering lower volatility compared to growth-oriented indices and suiting traders seeking stable exposure
-
Long History: Established in 1896 with over a century of historical data, making it an ideal instrument for technical analysis and backtesting strategies
-
Global Recognition: The SPDR DIA ETF has over $30 billion in assets under management, widely traded across global capital markets
-
Balanced Sector Distribution: Unlike the tech-heavy NAS100, US30 covers financials, healthcare, consumer, and industrials, providing natural sector rotation characteristics across different economic cycles
-
Ample Liquidity: US30 futures and CFDs command substantial daily trading volumes with tight spreads, enabling smooth entry and exit
Risks
-
Constituent Concentration: With only 30 companies, sharp price movements in major constituents (such as UnitedHealth or Goldman Sachs) can have a disproportionate impact on the overall index
-
Price-Weighting Limitations: Higher-priced stocks have greater influence on the index regardless of market capitalization, meaning high-priced stock volatility may mask the actual performance of lower-priced constituents
-
Interest Rate Sensitivity: Rising rate environments compress valuations and increase borrowing costs, with particularly notable effects on financial and consumer stocks
-
Geopolitical Risk: Most constituents are multinational corporations whose overseas revenues and investment plans are affected by trade policies and geopolitical conflicts
-
Market Volatility: Highly susceptible to macroeconomic and policy factors, with potential for single-day swings of hundreds of points during major data releases or policy shifts
Practical Trading Strategies
Institutional Positioning (CFTC)
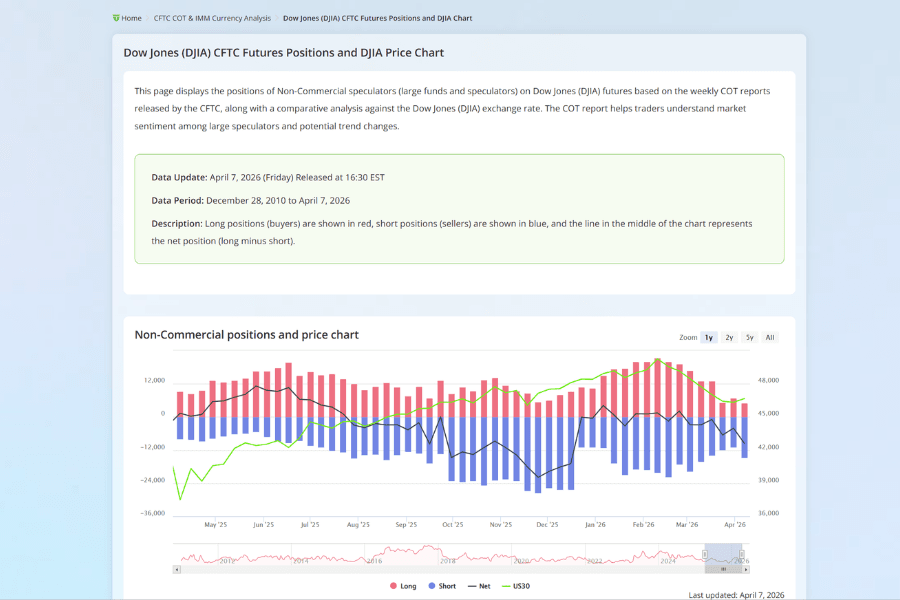
The CFTC (Commodity Futures Trading Commission) weekly COT report tracks changes in large speculative positions in Dow futures.
- When non-commercial net longs continue to increase, it suggests institutional bullishness on blue-chip stocks, with a higher probability of trend continuation
- When net longs begin to decline from extreme highs, it may signal an impending trend reversal or correction
- Combining COT data with technical signals can improve entry timing accuracy
COT data is published every Friday (reflecting positions as of Tuesday) and typically leads price movements by 1-4 weeks, making it suitable as a weekly timeframe directional reference rather than an intraday entry/exit tool.
Technical Analysis Tools (Titan FX Proprietary Tools)
Titan FX provides a variety of analytical tools to help traders assess US30's technical landscape:
- Support & Resistance: Identify key price levels for US30 and assess breakout or bounce potential
- Order Book (Position Info): Monitor other traders' pending order distribution and long/short ratios
- Trend Analysis: Determine whether US30 is in an uptrend, downtrend, or consolidation phase
- RSI Analysis: Identify overbought or oversold conditions to assist reversal timing
- Volatility Heatmap: Understand US30's volatility patterns across different trading sessions
- Percentage Change Ranking: Compare US30's real-time price changes against other indices
Specific Trading Approaches: Trend, Breakout, Event-Driven
Trend Trading
When the Fed's policy direction is clear (e.g., a sustained rate-cutting or rate-hiking cycle), US30 tends to form medium-term trends lasting weeks to months. Use daily or 4-hour moving averages to confirm the trend direction, enter on pullbacks to key support levels or moving averages, and hold with the trend. The steady advance in 2024 is a textbook example.
Breakout Trading
US30 often forms narrow consolidation ranges ahead of major data releases. When price breaks above or below the range on increased volume, it typically triggers a rapid directional move. Use Bollinger Bands to assess breakout direction after price compression, and confirm with volume to effectively filter false breakouts.
Event-Driven Trading
Fed rate decisions, Non-Farm Payrolls, ISM Manufacturing PMI, and similar events can trigger US30 swings of hundreds of points in a single day. Position sizing is particularly critical around these events. Consider reducing standard position sizes to half or less and setting wider stop-loss distances.
How to Trade US30 on Titan FX
On Titan FX, the Dow Jones Industrial Average is traded as US30 via CFD (Contract for Difference). You can also trade directly from your browser using WebTrader.
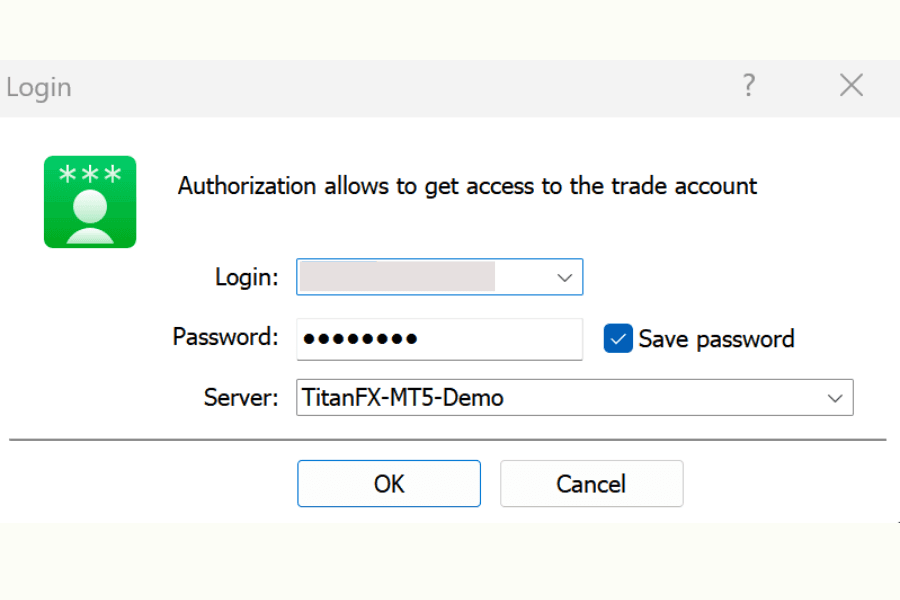
Step 1: Log In to Your Trading Account
Open a Titan FX trading account (Zero Standard or Zero Blade), complete your deposit, then download the MT4 or MT5 platform and log in with your credentials.
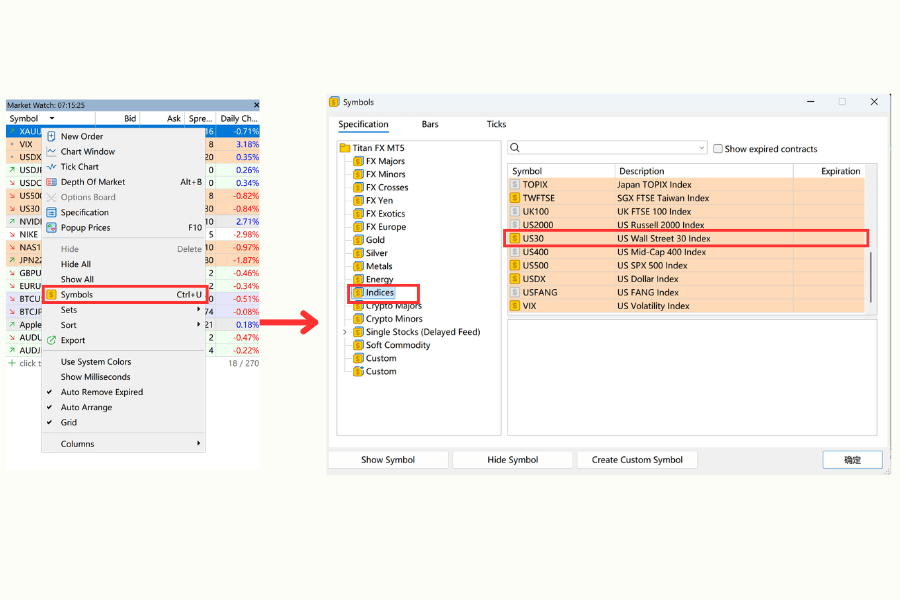
Step 2: Add US30 to Your Market Watch
Right-click in the Market Watch window, select "Symbols," expand the "Indices" category, and double-click US30 to add it to your quotes list.
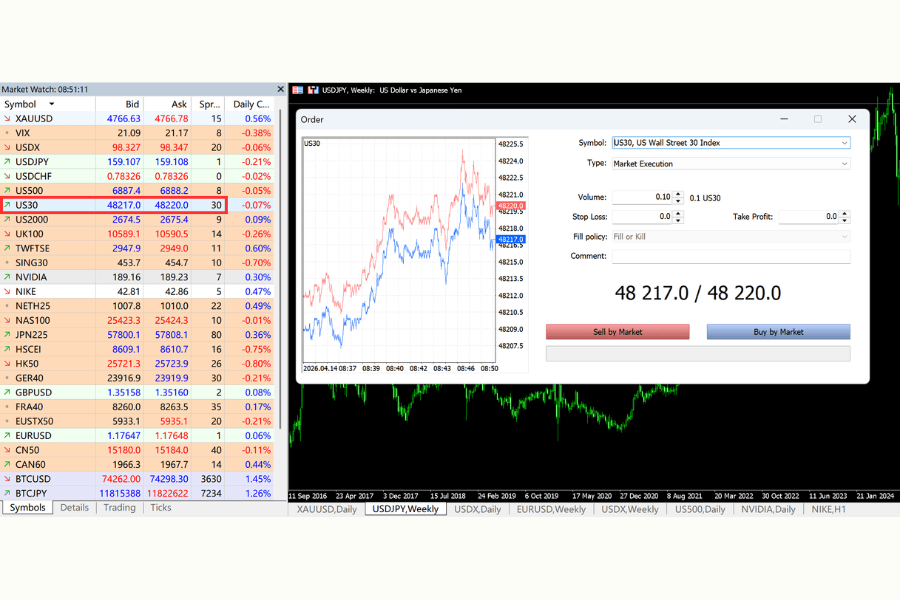
Step 3: Start Trading
Double-click the US30 quote or open its chart to access the order window. Enter your lot size (minimum 0.1 lots), select buy or sell direction, set your stop-loss and take-profit levels, and execute the trade.
Trading Hours (MT4/MT5 Server Time GMT+3):
| Session | Winter Time (GMT+2) | Summer Time (GMT+3) |
|---|---|---|
| MT4/MT5 Platform | 01:00 - 23:59 (Friday close at 23:55) | 01:00 - 23:15 & 23:30 - 23:59 (Friday close at 23:55) |
| UTC | 23:00 - 21:59 next day (Saturday 21:55) | 22:00 - 20:15 & 20:30 - 20:59 next day (Saturday 20:55) |
For the latest trading conditions and spreads, refer to the official page.
Start Trading the US30 Index Trade US30 CFDs with Titan FX. Enjoy up to 500x leverage, low spreads, and the flexibility to go long or short. Both Zero Standard and Zero Blade accounts support index CFD trading (Zero Micro accounts do not support index CFDs).
Key Considerations for Beginners
Leverage and Risk Management
Titan FX offers up to 500x leverage (Zero Standard / Zero Blade accounts). US30's daily range can reach hundreds of points, making risk management crucial when trading with high leverage:
- Limit risk per trade to 1-2% of account equity
- Given US30's volatility characteristics, avoid setting stop-losses too tight to prevent being stopped out within normal price fluctuations
- Use Titan FX's Margin Calculator to calculate required margin and appropriate position sizes
Price-Weighting Dynamics
Because US30 uses price-weighting rather than market-cap weighting, high-priced stocks (such as UnitedHealth and Goldman Sachs) have a far greater influence on the index than lower-priced stocks (such as Verizon and Intel). Traders should pay particular attention to high-priced constituent developments, as negative news from a single high-priced stock can drag down the entire index.
Earnings Season Volatility
The months of January, April, July, and October see concentrated quarterly earnings releases from U.S. companies. US30 constituent earnings are typically released in the latter half of these months, during which daily index volatility can expand to 1.5-2x normal levels. Avoid establishing large positions carelessly during earnings season.
Fed Rate Decision Impact
FOMC rate decisions occur eight times per year and represent the most important scheduled events for US30. Beyond the rate change itself, the Fed Chair's press conference language, dot plot (median rate projections), and economic outlook revisions can all trigger sharp moves. The 30 minutes surrounding the decision see the most concentrated volatility; less experienced traders should consider stepping aside during this window.
Top Constituents by Index Impact
US30 (the Dow Jones Industrial Average) uses the same price-weighted methodology as the Nikkei 225, so high-priced stocks have an outsized influence on the overall index. The following are the constituents with the largest impact on the index at recent price levels.
| Stock | Ticker | Price Range | Index Impact |
|---|---|---|---|
| UnitedHealth Group | UNH | Above USD 500 | 5 stars |
| Goldman Sachs | GS | Above USD 500 | 5 stars |
| Microsoft | MSFT | USD 400 range | 4 stars |
| Home Depot | HD | USD 400 range | 4 stars |
| Caterpillar | CAT | USD 300 range | 4 stars |
| McDonald's | MCD | USD 300 range | 4 stars |
| Visa | V | USD 300 range | 4 stars |
| Amgen | AMGN | USD 300 range | 3 stars |
| Honeywell | HON | USD 200 range | 3 stars |
| American Express | AXP | USD 300 range | 4 stars |
US30, like the Nikkei 225, is price-weighted, which means stocks such as UnitedHealth and Goldman Sachs trading at USD 500 or more drive the largest share of index moves. A stock such as Apple, one of the largest companies in the world by market capitalization (trading in the USD 150 range), actually has less influence on the Dow than UnitedHealth at USD 500. This is a defining characteristic of the Dow Jones Industrial Average.
How the Price-Weighted Average is Calculated
US30 uses the same price-weighted methodology (Price-Weighted) as the Nikkei 225. The calculation is intuitive and simple, but the results differ substantially from market-cap weighting.
Basic formula:
Index = Sum of 30 constituent prices ÷ Divisor
Consider a simplified example with 3 stocks:
- Company A: price of USD 100
- Company B: price of USD 500
- Company C: price of USD 5,000
Sum = USD 5,600. If the divisor is 1, the index equals 5,600.
If Company C drops 10% (5,000 → 4,500), the new sum is USD 5,100 and the index falls to 5,100 (−8.9%).
But if Company A surges 50% (100 → 150), the new sum is only USD 5,650 and the index rises to 5,650 (+0.9%).
The influence that a high-priced stock has on the index can exceed that of a low-priced stock by a factor of 50 or more.
For the actual US30, the so-called Dow Divisor is continually updated as stock splits and constituent changes occur. Recently it has been close to 0.15, though the exact value varies over time. This divisor is what preserves index continuity even as the underlying constituents change.
Typical Price Action After Major Events
US30 exhibits specific tendencies in response to major US economic events. The following is a summary of typical reactions drawn from historical data.
| Event | Release Time (ET) | Typical Reaction |
|---|---|---|
| FOMC Rate Decision | 14:00 ET | ±300–600 points within 30 minutes of the release |
| Fed Chair Press Conference | 14:30 ET | Additional ±200 points |
| US CPI | 08:30 ET | Directional move 30 minutes before the open |
| US Non-Farm Payrolls | 08:30 ET (first Friday) | Priced in before the open |
| ISM Manufacturing PMI | 10:00 ET | Moderate reaction |
The FOMC decision and the Fed Chair's press conference, released back-to-back on the same afternoon, are particularly likely to produce large two-way moves in a short time window. Changes in rate expectations, shifts in the inflation outlook, and signals about the next meeting are the primary drivers. Before trading, it is advisable to check the CME FedWatch tool to gauge the market's implied probabilities for rate hikes or cuts.
Real-Time Chart and Trading Conditions
The latest US30 CFD quote, real-time 5-minute, 1-hour and daily candle charts, recent spread history, margin requirements, and swap rates can all be checked on the Titan FX US30 product page.
See the latest quote and chart: US30 product page
Titan FX also provides the following analytical tools free of charge, useful for US30 trading decisions.
- Support & Resistance auto-detection
- Trend Analysis
- Volatility Heatmap (visualizes volatility by time of day)
- Swap Calendar
- Economic Calendar
Frequently Asked Questions
How Does US30 Differ from Other Major U.S. Indices?
| Index | Constituents | Weighting | Sector Characteristics | Volatility | Titan FX Symbol |
|---|---|---|---|---|---|
| US30 (Dow Industrials) | 30 | Price-weighted | Diversified blue chips: financials, tech, healthcare | Medium | US30 |
| US500 (S&P 500) | 500 | Market-cap weighted | Most balanced sector distribution, all-sector coverage | Medium | US500 |
| NAS100 (Nasdaq 100) | 100 | Market-cap weighted | Tech stocks >50%, excludes financials | High | NAS100 |
| Russell 2000 | 2,000 | Market-cap weighted | Primarily small-caps, reflects U.S. domestic economy | High | — |
US30 suits traders preferring stable blue-chip exposure, US500 offers broad market coverage, and NAS100 is suited for those looking to concentrate on technology growth stocks.
How Can the CFTC COT Report Assist US30 Trading?
The COT report publishes weekly data on large speculative (hedge fund) long and short positions in Dow futures. Expanding non-commercial net longs may signal a medium-term US30 rebound, while expanding net shorts indicate rising risk aversion. Position changes typically lead price movements by 1-4 weeks, making them best suited as medium-term references combined with technical and macro analysis. For detailed positioning data, refer to Titan FX's Dow Jones (DJIA) COT Report.
Which Economic Indicators Have the Strongest Correlation with US30?
US30 reacts most sensitively to the ISM Manufacturing Index and Non-Farm Payrolls (NFP). When PMI remains above 50 and employment growth is robust, industrials, financials, and consumer stocks generally benefit, supporting US30's advance. Track these key data points in real time through Titan FX's Economic Calendar.
Is There a Correlation Between US30 and the Dollar Index?
US30 and the Dollar Index (USDX) have a complex relationship. A stronger dollar may reflect solid economic fundamentals (positive for US30) or Fed tightening expectations (negative for US30). As a result, the correlation can be positive or negative depending on the prevailing macroeconomic context, requiring traders to assess the economic backdrop when evaluating the relationship.
What Are the Trading Hours for US30 CFDs?
US30 CFD trading is available nearly 24 hours a day (Monday through Friday), including U.S. pre-market and after-hours sessions. Primary price action concentrates during regular U.S. equity trading hours (14:30-21:00 UTC in summer), when liquidity and volatility are highest. For detailed session information, refer to the Titan FX Index CFD Trading Conditions page.
What Costs Should I Be Aware of When Trading US30?
The primary costs in CFD trading include spreads (bid-ask differential), swap (overnight financing), and potential commissions. US30's spread levels and specific trading conditions are available on the Titan FX website. Holding positions overnight incurs swap charges, which you can check via the Swap Calendar. Additionally, index CFDs may involve dividend adjustments, with account debits or credits applied when constituent stocks go ex-dividend.
Conclusion
The Dow Jones Industrial Average (US30) is a core indicator for measuring the U.S. blue-chip market, attracting global traders with its long history, corporate stability, and balanced sector composition. Its performance is shaped by the combined influence of economic growth, interest rate policy, market sentiment, and industry dynamics.
Tracking the Fed's policy direction, monitoring ISM Manufacturing PMI and Non-Farm Payrolls, using CFTC positioning reports to gauge medium-term direction, and applying technical analysis tools for entry and exit timing form the foundational framework for trading US30.
Leverage Titan FX's US30 Real-Time Quotes and Chart Page to stay informed on market dynamics and apply this article's analytical framework to your trading.
Further Reading
Titan FX's financial-market research team. We cover a broad set of instruments — foreign exchange, commodities (crude oil, precious metals, agricultural products), equity indices, US equities, and digital assets — producing educational content for investors.
Primary Sources (by Category)
- Index methodology and constituents: S&P Dow Jones Indices — DJIA, Wikipedia — DJIA
- ETF holdings: SPDR Dow Jones (DIA)
- Institutional positioning: CFTC — Commitments of Traders