What Is the Nasdaq-100 Index (NAS100)? Components & Trading Guide
NAS100 (the Nasdaq-100 Index) is a stock index of the 100 largest non-financial companies listed on the Nasdaq; dominated by technology stocks, it is known for strong growth potential and high volatility.
From Apple and NVIDIA to Amazon, NAS100 captures nearly all of today's most influential US tech and growth companies — making it a key gauge of global innovation trends and market risk appetite.
For CFD traders, NAS100 offers compelling opportunities thanks to its high volatility and deep liquidity. Whether you're riding the explosive growth of the AI industry or capturing short-term swings around Federal Reserve rate decisions, NAS100 is one of the most actively traded global indices. This article covers the index composition, price drivers, and practical trading strategies for NAS100.
- NAS100 is a market-cap-weighted index of the 100 largest non-financial Nasdaq stocks
- Tech makes up over 50%; it is volatile and excludes financial stocks
- Key drivers: U.S. rates, Fed policy, big-tech earnings, and the U.S. Dollar Index
- Pros are strong growth and liquidity; risks are high volatility and sector concentration
- Titan FX offers NAS100 as a CFD with near-24-hour trading and leverage
- 1. What Is the Nasdaq-100 Index (NAS100)?
- 2. Top Constituents and Sector Breakdown
- 3. Price History: 2020-2025 in Review
- 4. Key Factors That Move the Nasdaq-100
- 5. Advantages and Risks of Trading NAS100
- 6. NAS100 Trading Strategies
- 7. How to Trade NAS100 on Titan FX
- 8. Key Considerations for New Traders
- 9. Frequently Asked Questions
What Is the Nasdaq-100 Index (NAS100)?
The Nasdaq-100 Index was established in 1985 as a market-cap-weighted index compiled by the Nasdaq exchange. It tracks the 100 largest non-financial companies listed on the exchange, excluding banks, insurance firms, and securities companies. The index focuses on technology, consumer, communications, and healthcare sectors, making it widely regarded as the benchmark for U.S. tech stocks.
| Item | Details |
|---|---|
| Official Name | NASDAQ-100 Index |
| Trading Symbol | NAS100 (CFD) / NDX (Cash Index) |
| Year Established | 1985 |
| Number of Constituents | 100 companies (some have multiple share classes, so actual stock count is ~101-102) |
| Weighting Method | Modified Market-Cap Weighted |
| Excluded Sectors | Financials |
| Benchmark ETF | QQQ (Invesco QQQ Trust, AUM exceeding $250 billion) |
| Rebalancing | Annual reconstitution in December, with special rebalance mechanisms |
How NAS100 Is Calculated
The NAS100 is calculated by dividing the sum of all constituents' adjusted market capitalizations by an index divisor:
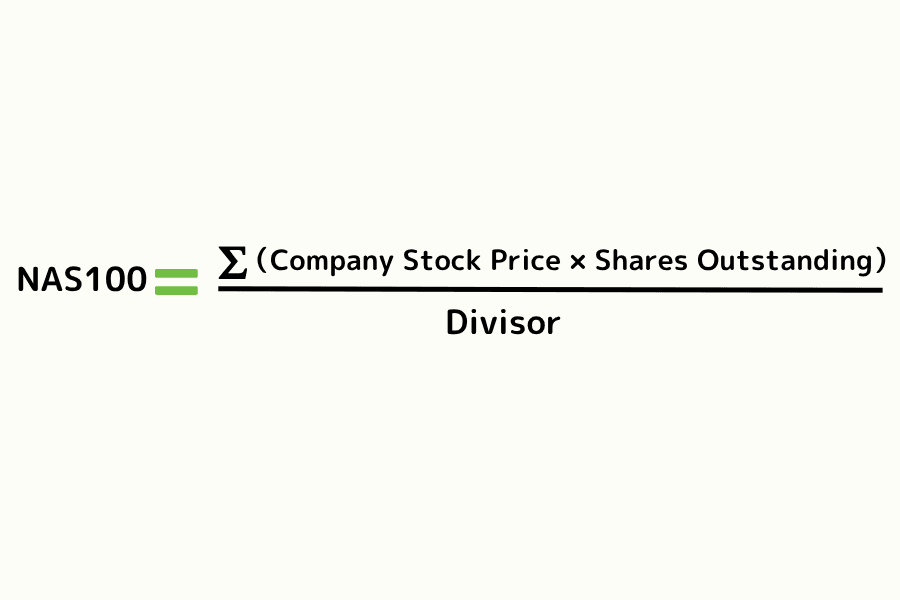
The index divisor is adjusted whenever constituent changes, stock splits, or other corporate actions occur to maintain index continuity. Unlike the Dow Jones Industrial Average (US30), which uses price weighting, NAS100's market-cap weighting gives larger companies like Apple and Microsoft a greater influence on index movements.
Compared to the S&P 500 (US500), NAS100 has a much higher sector concentration -- tech stocks account for over 50% of the index -- resulting in greater volatility.
Top Constituents and Sector Breakdown
The top ten NAS100 constituents account for over 50% of the index weight, giving them an outsized impact on price movements. Below are the major holdings as of mid-2025:
| Rank | Company | Ticker | Sector | Weight (approx.) |
|---|---|---|---|---|
| 1 | Apple | AAPL | Consumer Electronics / Software | ~9% |
| 2 | Microsoft | MSFT | Software / Cloud | ~8% |
| 3 | NVIDIA | NVDA | Semiconductors / AI | ~7% |
| 4 | Amazon | AMZN | E-commerce / Cloud | ~5% |
| 5 | Meta Platforms | META | Social Media / Advertising | ~5% |
| 6 | Alphabet Class A | GOOGL | Search / Advertising | ~4% |
| 7 | Alphabet Class C | GOOG | Search / Advertising | ~4% |
| 8 | Broadcom | AVGO | Semiconductors / Infrastructure | ~4% |
| 9 | Tesla | TSLA | Electric Vehicles / Energy | ~3% |
| 10 | ASML | ASML | Semiconductor Equipment | ~2% |
The performance of these top ten stocks typically drives intraday index movements. Earnings reports or product launches from Apple, NVIDIA, or Microsoft alone can move NAS100 by hundreds of points.
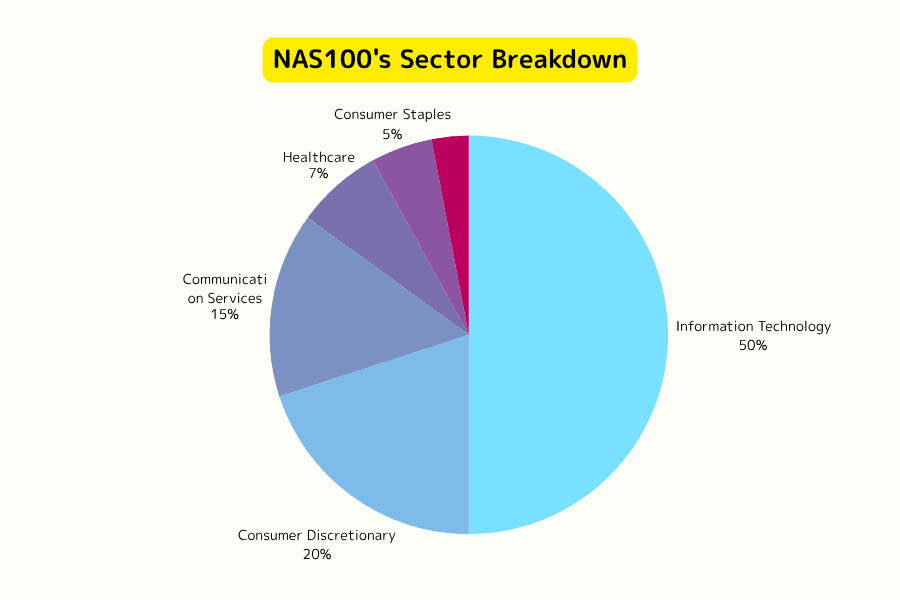
Sector Breakdown
| Sector | Weight (approx.) | Key Companies |
|---|---|---|
| Information Technology | ~50% | Apple, Microsoft, NVIDIA, Broadcom, ASML |
| Consumer Discretionary | ~20% | Amazon, Tesla, Booking Holdings |
| Communication Services | ~15% | Meta, Alphabet, Netflix |
| Healthcare | ~7% | Amgen, Gilead Sciences, Vertex |
| Consumer Staples | ~5% | Costco, PepsiCo, Mondelez |
| Industrials / Utilities | ~3% | Honeywell, American Electric Power |
With tech stocks making up over 50% of the index, NAS100 is tightly linked to semiconductor cycles, AI development, and cloud computing demand. This is its key differentiator from US500 and US30 -- and the fundamental reason for its higher volatility.
Price History: 2020-2025 in Review
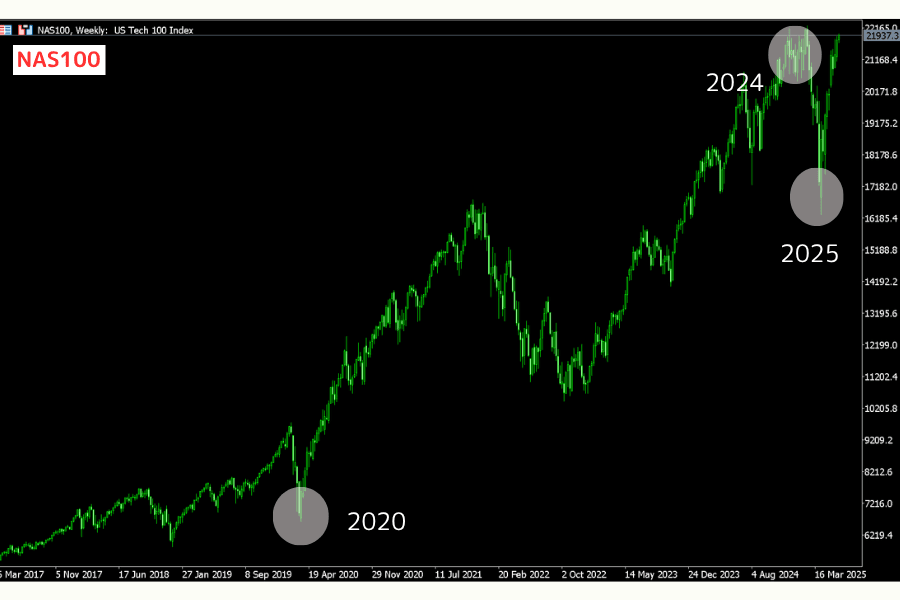
Over the past six years, NAS100 has experienced dramatic bull and bear cycles, reflecting the tech sector's cyclicality and the profound impact of the macroeconomic environment.
2020: V-Shaped Recovery After the Pandemic Shock (+48%)
COVID-19 sent NAS100 plunging nearly 30% in March 2020. However, the Federal Reserve's massive quantitative easing and zero-interest-rate policy fueled a surge in demand for remote work, e-commerce, and cloud services. The index closed the year up roughly 48% -- a remarkable annual gain.
2021: Tech Bull Market Continues (+27%)
The loose monetary environment persisted, and tech valuations expanded further. A global semiconductor shortage lifted chip stocks, while streaming and EV themes remained hot. By year-end, however, rising inflation sparked growing concerns about a Fed policy pivot.
2022: Rate Hikes Trigger a Deep Correction (-33%)
The Fed launched its most aggressive rate-hiking cycle since the 1980s, raising rates by 425 basis points over the year. High-growth tech stocks, extremely sensitive to interest rates, bore the brunt of the selloff. NAS100 fell about 33% for the year -- its worst annual performance since the 2008 financial crisis. Meta's stock was cut in half, and Netflix plunged over 50%, illustrating the brutal impact of valuation compression.
2023: AI-Driven Rally (+55%)
The generative AI boom sparked by ChatGPT became the dominant market theme. NVIDIA's stock surged over 200% for the year, lifting the entire semiconductor sector. The "Magnificent 7" -- Apple, Microsoft, Alphabet, Amazon, Meta, NVIDIA, and Tesla -- powered NAS100 to a roughly 55% rebound.
2024: AI Momentum Extends (+27.6%)
AI infrastructure investment continued to expand, with data center and AI chip demand driving NVIDIA, Broadcom, and other semiconductor stocks to new highs. The Fed began cutting rates in the second half of the year, further supporting tech valuations. NAS100 gained about 27.6% for the year.
2025 Year-to-Date: Tariff Shocks and Uncertainty
The rally extended into early 2025, but uncertainty over U.S. trade policy introduced significant volatility. Shifting tariff policies disrupted global supply chains, particularly impacting semiconductor export controls and tech companies' overseas revenue expectations. Continued breakthroughs in AI and quantum computing attracted capital, but the market oscillated between elevated valuations and policy risks.
Key Factors That Move the Nasdaq-100
Macroeconomic Environment
NAS100 is highly sensitive to U.S. economic growth expectations. Key indicators to watch include:
- GDP Growth Rate: Economic expansion supports corporate revenue growth expectations, benefiting tech stocks
- CPI (Consumer Price Index): Inflation data directly influences the Fed's rate-policy direction, which in turn affects growth-stock valuations
- Nonfarm Payrolls (NFP): An overheating labor market could delay rate cuts, putting pressure on tech stocks
- Consumer Confidence Index: Reflects consumer spending intentions, indirectly affecting consumer-facing constituents like Amazon and Tesla
Industry and Corporate Factors
- AI and Semiconductor Cycles: Semiconductor stocks such as NVIDIA, Broadcom, and ASML carry significant index weight; AI chip demand directly impacts index performance
- Cloud Computing and Digital Advertising: Revenue growth at Microsoft Azure, Amazon AWS, and Google Cloud is a key market focus
- Earnings Season Impact: Quarterly earnings from the top ten constituents -- typically released in January, April, July, and October -- can create sharp short-term volatility in NAS100
- Tech Regulation and Antitrust: Regulatory actions targeting major tech companies (antitrust lawsuits, data privacy legislation) can weigh on valuations
Geopolitical Factors
- U.S.-China Tech Competition: Semiconductor export controls and technology restrictions affect supply chain positioning and put pressure on overseas revenue for companies like NVIDIA and ASML
- Tariff Policy: Import tariffs increase electronics costs and squeeze tech company margins
- Global Supply Chains: Geopolitical conflicts and logistics bottlenecks can disrupt semiconductor and consumer electronics supply chains
Monetary Policy
The Federal Reserve's (FOMC) rate decisions are among the single most important factors driving NAS100. Tech stocks, as "long-duration" assets where future cash flows make up a large portion of their valuations, are exceptionally sensitive to interest rate changes.
- Rate Cuts / Easing: Lower borrowing costs push up growth-stock valuations, bullish for NAS100
- Rate Hikes / Tightening: Higher discount rates compress high-multiple tech stocks, bearish for NAS100
- Quantitative Easing (QE) / Tightening (QT): Directly affects market liquidity and risk appetite
The -33% decline in 2022 and the +55% rebound in 2023 vividly demonstrate the enormous influence of monetary policy on NAS100.
Use Titan FX's Economic Calendar to track release times and market expectations for all major economic data in real time.
Advantages and Risks of Trading NAS100
Advantages
-
Direct Exposure to Tech Innovation: NAS100 concentrates the world's most innovative tech companies, letting traders gain exposure to AI, cloud, semiconductor, and other frontier industries through a single instrument
-
High Growth Potential: Over the past decade (2015-2024), NAS100's annualized return has significantly outpaced most global indices, reflecting the tech sector's outsized growth
-
High Transparency: All constituents are U.S.-listed companies regulated by the SEC, with publicly available financial statements and comprehensive disclosure requirements
-
Global Reach: The QQQ ETF, which tracks NAS100, has over $250 billion in assets under management, making it one of the primary vehicles for global tech-stock allocation
-
Deep Liquidity: NAS100 futures and CFDs see massive daily trading volumes with tight bid-ask spreads, ensuring smooth entry and exit
Risks
-
High Volatility: NAS100 fell 33% in 2022, and single-day swings of 2-3% are not uncommon. High volatility means larger profit potential, but losses are equally amplified
-
Concentration Risk: The top ten constituents account for over 50% of the index weight -- negative news from just a few companies can drag down the entire index
-
Interest Rate Sensitivity: Growth-stock valuations are highly dependent on a low-rate environment; NAS100 tends to be among the first indices hit when the Fed shifts policy
-
Geopolitical Risk: U.S.-China tech competition, tariff policies, and export controls can cause sharp short-term volatility
-
Valuation Pressure: When market enthusiasm runs high, NAS100's P/E ratio can stretch well above its historical average, increasing the risk of a pullback
NAS100 Trading Strategies
Institutional Positioning (CFTC)
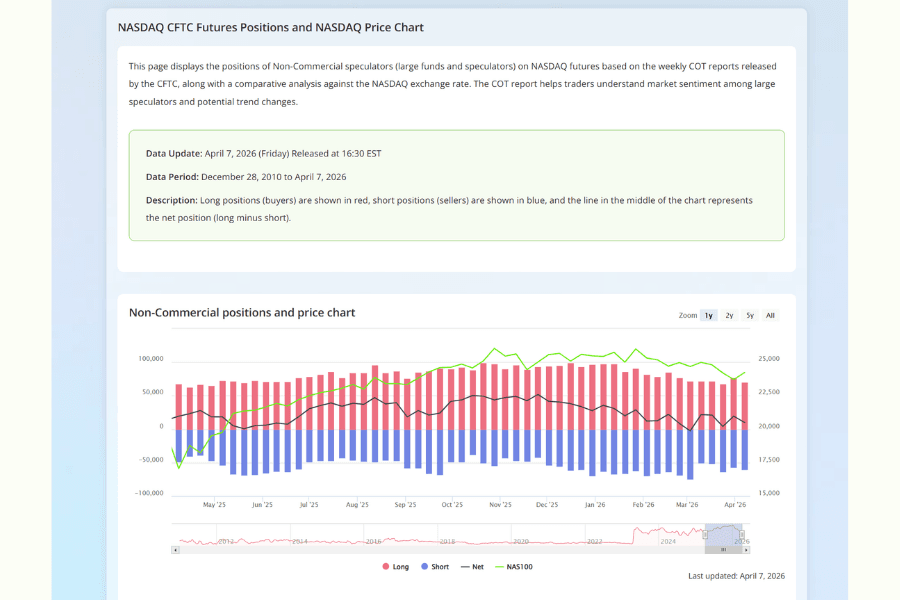
The CFTC's weekly Commitments of Traders (COT) report tracks changes in long and short positions held by large speculative institutions in Nasdaq-100 futures.
- When institutional net longs are steadily increasing, it signals a positive medium-term outlook for tech stocks, with a higher probability of trend continuation
- When net longs begin to decline from extreme highs, it may signal an upcoming trend reversal or correction
- Combining COT data with technical signals can improve entry timing
COT data is published on Fridays (reflecting positions as of Tuesday) and is best used as a weekly directional reference rather than an intraday trading signal.
Technical Analysis Tools (Titan FX Research)
Titan FX provides a range of analytical tools to help traders assess NAS100's technical condition:
- Support and Resistance: Identify key price levels to assess breakout or bounce potential
- Order Book (Positioning Data): View pending order distribution and long/short ratios from other traders
- Trend Analysis: Determine whether NAS100 is in an uptrend, downtrend, or consolidation phase
- RSI Analysis: Identify overbought or oversold conditions to help time reversals
- Volatility Heatmap: Understand NAS100's volatility patterns across different trading sessions
- Percentage Change Ranking: Compare NAS100's real-time performance against other indices
Trading Approaches: Trend, Breakout, and Event-Driven
Trend Trading
When the Fed's policy direction is clear -- such as during a sustained rate-cutting cycle -- NAS100 tends to form medium-term trends lasting weeks to months. Use daily or 4-hour chart moving averages to confirm the direction, and enter on pullbacks to key support levels or moving averages. The uptrend from H2 2023 through 2024 is a textbook example.
Breakout Trading
NAS100 often forms tight consolidation ranges ahead of major data releases. When price breaks out above or below the range on strong volume, it typically triggers a rapid directional move. Keep in mind that false breakouts are common in U.S. stock indices -- confirming with volume and RSI helps filter out fake signals.
Event-Driven Trading
Big tech earnings reports, Fed rate decisions, and U.S. CPI releases can all trigger 1-3% single-day moves in NAS100. When trading around these events, position sizing is critical -- consider reducing your standard position by half or more and setting wider stop-loss levels.
How to Trade NAS100 on Titan FX
On the Titan FX platform, the Nasdaq-100 is traded under the symbol NAS100 as a CFD (Contract for Difference). You can also trade via WebTrader directly in your browser.
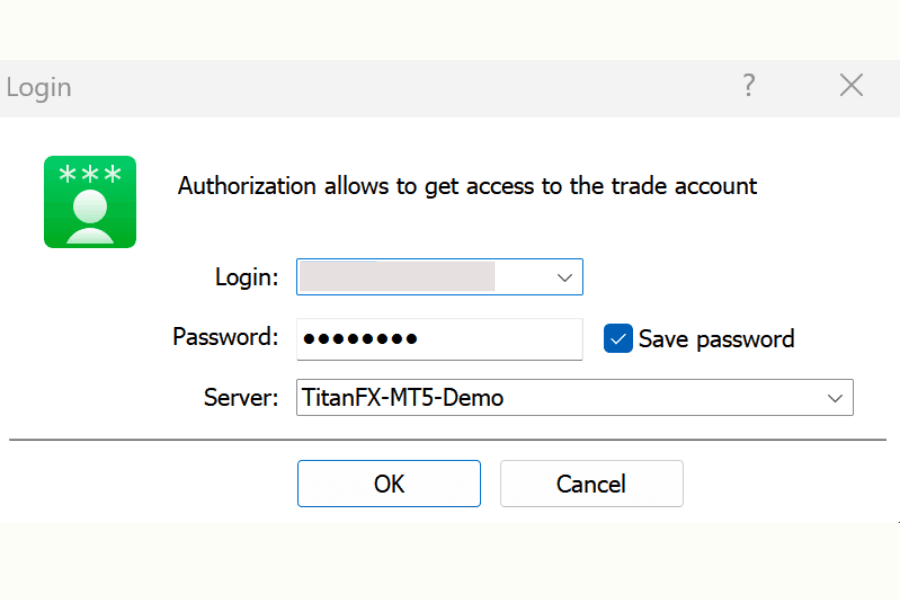
Step 1: Log In to Your Trading Account
Open a Titan FX trading account (Zero Standard or Zero Blade), complete your deposit, then download MT4 or MT5 and log in with your credentials.
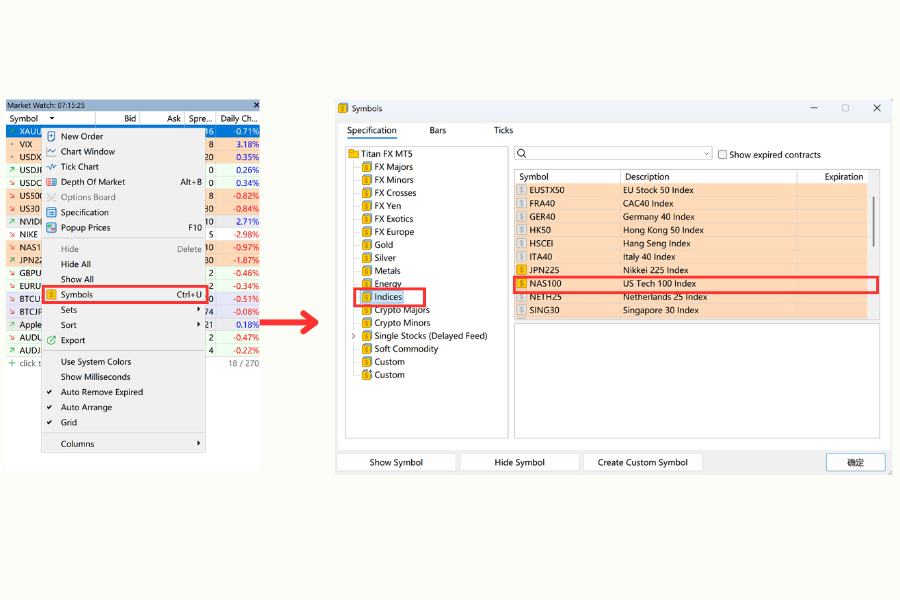
Step 2: Add the NAS100 Quote
In the Market Watch window, right-click and select "Symbols." Expand the "Indices" category, find NAS100, and double-click to add it to your watchlist.
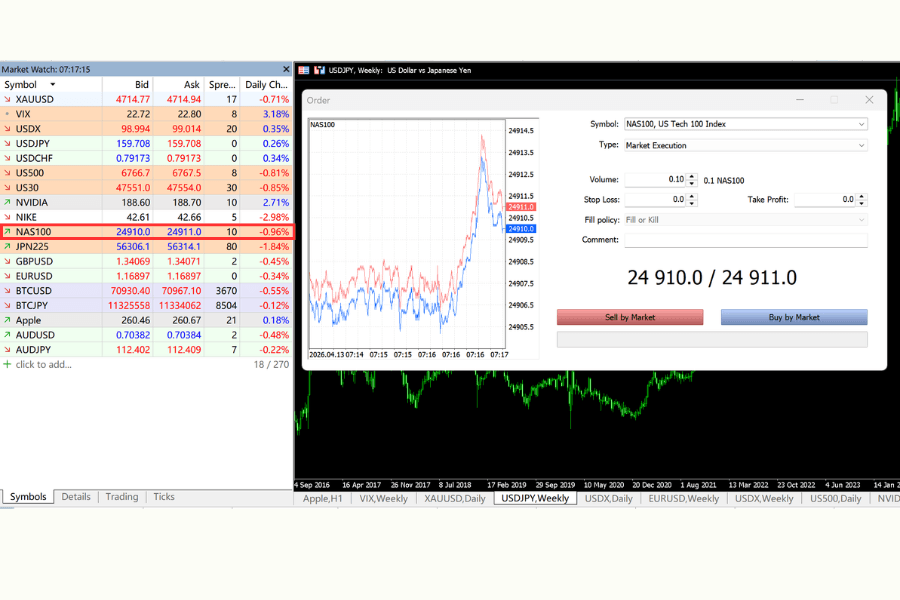
Step 3: Place Your Trade
Double-click the NAS100 quote or open a chart to access the order window. Enter your lot size (minimum 0.1 lots), choose your direction (buy or sell), set your stop-loss and take-profit levels, and execute the trade.
Trading Hours (Eastern Time):
| Session | Standard Time (EST, GMT-5) | Daylight Saving Time (EDT, GMT-4) |
|---|---|---|
| Main Trading Session | 18:00 - 16:59 (Sun-Fri) | 19:00 - 16:15 & 16:30 - 16:59 |
| Friday Close | 16:55 | 16:55 |
For the latest trading conditions and live prices, see the NAS100 instrument page.
Start Trading the NAS100 Index Trade NAS100 CFDs on Titan FX with up to 500:1 leverage, tight spreads, and the flexibility to go long or short. Index CFD trading is available on Zero Standard and Zero Blade accounts (not available on Zero Micro accounts).
Key Considerations for New Traders
Leverage and Risk Management
Titan FX offers up to 500:1 leverage on Zero Standard and Zero Blade accounts. Given NAS100's large average daily range, risk management is essential when trading with high leverage:
- Keep the risk on any single trade within 1-2% of your account equity
- Given NAS100's volatile nature, avoid setting stop-losses too tight -- normal price fluctuations can easily trigger prematurely tight stops
- Use Titan FX's Margin Calculator to determine the required margin and appropriate position size
Concentration Risk in Tech Stocks
The top ten constituents make up over 50% of the index. Even though NAS100 comprises 100 stocks, risk is effectively concentrated in a handful of companies. A single earnings report from NVIDIA can move the index by more than 2%. When trading NAS100, it pays to keep an eye on individual developments among the major constituents.
Earnings Season Volatility
January, April, July, and October are when U.S. companies report quarterly earnings. The top ten NAS100 constituents typically release results in the latter half of these months. During these periods, single-day volatility can run 1.5 to 2 times the normal level. Avoid building oversized positions around earnings season.
Impact of Fed Rate Decisions
FOMC rate decisions take place eight times per year and are among the most important scheduled events for NAS100. Beyond the rate change itself, the Fed Chair's press conference language, the dot plot (median rate projections), and updates to the economic outlook can all trigger sharp moves. The 30 minutes before and after the announcement tend to see the most concentrated volatility. Less experienced traders may want to consider stepping aside during this window.
Frequently Asked Questions
Q1. How does NAS100 differ from other major U.S. indices?
| Index | Constituents | Weighting | Sector Characteristics | Volatility | Titan FX Symbol |
|---|---|---|---|---|---|
| NAS100 (Nasdaq-100) | 100 | Market-Cap | Tech stocks >50%, no financials | High | NAS100 |
| US500 (S&P 500) | 500 | Market-Cap | Balanced sectors including financials, healthcare | Medium | US500 |
| US30 (Dow Jones) | 30 | Price | Skewed toward industrial and financial blue chips | Medium-Low | US30 |
| Russell 2000 | 2,000 | Market-Cap | Small caps, reflects U.S. domestic economy | High | -- |
NAS100 is suited for traders who want concentrated tech-sector exposure. US500 offers a more balanced allocation, while US30 attracts investors focused on traditional blue chips due to its smaller constituent count and price-weighted structure.
Q2. How can the CFTC COT report help with NAS100 trading?
The COT report shows the long and short positions of large speculative institutions (such as hedge funds) in Nasdaq-100 futures. When positioning aligns with the price trend, the trend is more likely to continue. When positioning reaches extreme levels and starts to reverse, it can signal a potential trend change. Note that COT data has a lag (Friday publication reflects Tuesday positions), making it better suited as a medium- to longer-term reference.
Q3. Is there a correlation between NAS100 and the U.S. Dollar Index?
NAS100 and the U.S. Dollar Index (USDX) tend to show an inverse relationship. A stronger dollar typically signals a hawkish Fed, which pressures tech valuations; a weaker dollar reflects easing expectations, which benefits growth stocks. However, this correlation is not absolute -- during certain periods, such as when risk-off sentiment dominates, both can decline simultaneously.
Q4. What are the trading hours for NAS100 CFDs?
NAS100 CFDs are available for trading nearly around the clock (Monday through Friday), including U.S. pre-market and after-hours sessions. The bulk of the action occurs during the regular U.S. trading session (9:30 AM - 4:00 PM ET), when liquidity and volatility are highest. For detailed session information, see the Titan FX Index CFD Trading Conditions page.
Q5. What technical indicators are useful for trading NAS100?
Commonly used indicators include: Moving Averages (for trend direction), RSI (for identifying overbought/oversold conditions), Bollinger Bands (for measuring volatility ranges), and MACD (for confirming momentum shifts). Titan FX's Trend Analysis and RSI Analysis tools provide real-time technical analysis for NAS100.
Q6. What costs are involved in trading NAS100?
The main costs in CFD trading include the spread (bid-ask difference), overnight financing (swap), and potentially commissions. NAS100 spread levels and detailed trading conditions can be found on the Titan FX website. Holding positions overnight incurs swap charges, which you can check via the Swap Calendar. Additionally, index CFDs may involve dividend adjustments -- when constituents go ex-dividend, your account will receive a corresponding credit or debit.
Conclusion
NAS100 is the global barometer for the technology sector, bringing together the leaders in AI, semiconductors, cloud computing, and e-commerce. Its high volatility provides ample trading opportunities, but it also demands disciplined risk management.
Understanding the Fed's policy direction, tracking big tech earnings and industry trends, using CFTC positioning data to gauge the medium-term outlook, and applying technical analysis tools to time entries and exits -- these form the core framework for trading NAS100.
Use Titan FX's NAS100 live quote and chart page to stay on top of market developments, and put this analytical framework into practice in your trading.
Further Reading
Titan FX Trading Strategy Lab. We produce educational content for investors across forex, precious metals, energy, indices, US stocks, and crypto, covering technical analysis and how markets work.
Primary Sources (by Category)
- Index & official: Nasdaq, Investopedia
- Market & data: Bloomberg, Reuters, and TradingView market commentary and chart analysis