What Is the S&P 500 Index (US500)? Components & Trading Guide
US500 (the S&P 500) is a market-cap-weighted index compiled by S&P Dow Jones Indices, covering the 500 largest U.S. listed companies — about 80% of total market value — across 11 sectors from information technology to financials and healthcare. It is the primary gauge of U.S. large-cap performance and one of the most liquid instruments in global index CFD trading.
Unlike the Dow Jones Industrial Average — just 30 members and price-weighted — US500 is market-cap-weighted with 500 constituents and far broader coverage, which is why institutions and funds widely adopt it as the benchmark for U.S. equities; the world's largest ETFs (SPY, IVV) track it.
For CFD traders, US500 is the most representative way to access the U.S. large-cap market, with moves driven by Fed rate policy, macro data, corporate earnings, and geopolitical events. This article breaks down US500's trading logic, from index definition and constituent structure to price drivers and practical trading methods.
- What US500 is and how a market-cap-weighted index is calculated
- The top 10 constituents and 11-sector distribution
- Recent moves (2020–2025) and the main price drivers
- US500's advantages, risks, and how to trade it
- How US500 differs from the Dow and NASDAQ-100
What Is the S&P 500 (US500)?
The S&P 500 (Standard & Poor's 500 Index), commonly displayed as US500 or SPX on trading platforms, is a market-capitalization-weighted index compiled by S&P Dow Jones Indices. It tracks the stock performance of 500 of the largest publicly traded companies in the United States, covering approximately 80% of the total U.S. equity market capitalization. Spanning 11 sectors including information technology, financials, healthcare, and consumer industries, the S&P 500 is widely regarded as the primary benchmark for U.S. large-cap stock market performance.
Established in 1957, the S&P 500 uses a free-float market capitalization weighting methodology, with an index committee reviewing constituents on a quarterly basis to maintain relevance and representativeness. Related derivative products such as the CME E-mini S&P 500 futures are among the most liquid instruments in global financial markets, attracting participation from both institutional and retail investors worldwide.
How the S&P 500 (US500) Is Calculated
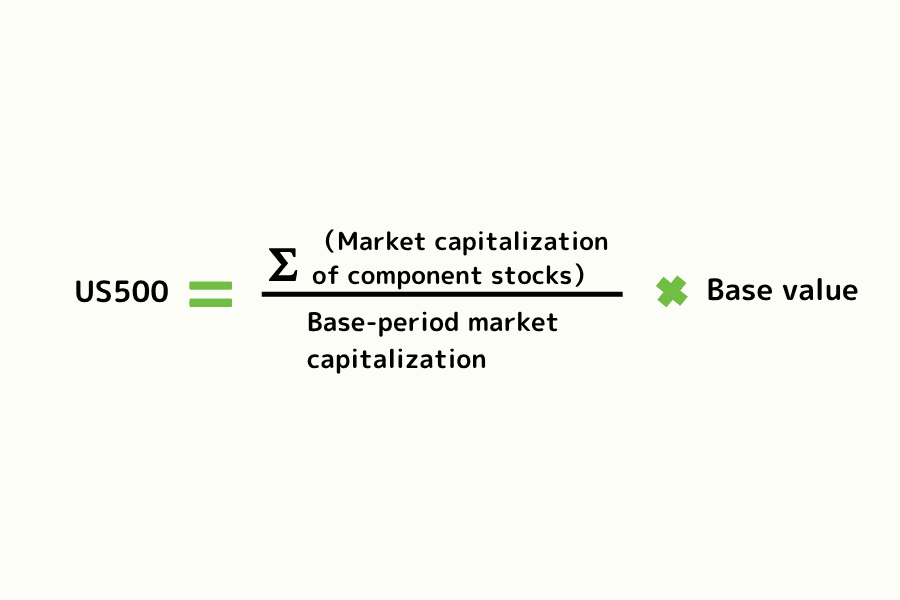
The S&P 500 is calculated by summing the free-float market capitalization of all constituent stocks and dividing by a base figure known as the Divisor. This Divisor is periodically adjusted for stock splits, share issuances, and constituent changes to ensure continuity of the index value over time.
S&P 500 (US500) Key Facts
| Item | Details |
|---|---|
| Full Name | Standard & Poor's 500 Index |
| Common Codes | US500 (CFD/futures code), SPX (index code) |
| Established | 1957 |
| Methodology | Free-float market capitalization weighted |
| Constituents | Approximately 500 (adjusted quarterly) |
| Review Frequency | Quarterly, based on market cap, liquidity, and sector balance |
| Currency | USD |
| Related Products | ETFs (SPY, IVV), CFDs, Futures (CME E-mini) |
Constituents and Sector Breakdown
The S&P 500 comprises the 500 largest and most liquid U.S. publicly traded companies across 11 GICS sectors, representing the core drivers of the American economy. The index committee adjusts constituents quarterly based on market capitalization, liquidity, and sector representation.
Top 10 Constituents of US500
| Rank | Ticker | Company | Est. Weight |
|---|---|---|---|
| 1 | MSFT | Microsoft Corp. | 6.88% |
| 2 | NVDA | NVIDIA Corp. | 6.86% |
| 3 | AAPL | Apple Inc. | 5.94% |
| 4 | AMZN | Amazon.com, Inc. | 4.05% |
| 5 | GOOG | Alphabet Inc. Class C | 3.79% |
| 6 | GOOGL | Alphabet Inc. Class A | 3.76% |
| 7 | META | Meta Platforms Inc. | 3.13% |
| 8 | AVGO | Broadcom Inc. | 2.07% |
| 9 | BRK.B | Berkshire Hathaway B | 1.90% |
| 10 | TSLA | Tesla Inc. | 1.84% |
US500 Sector Allocation
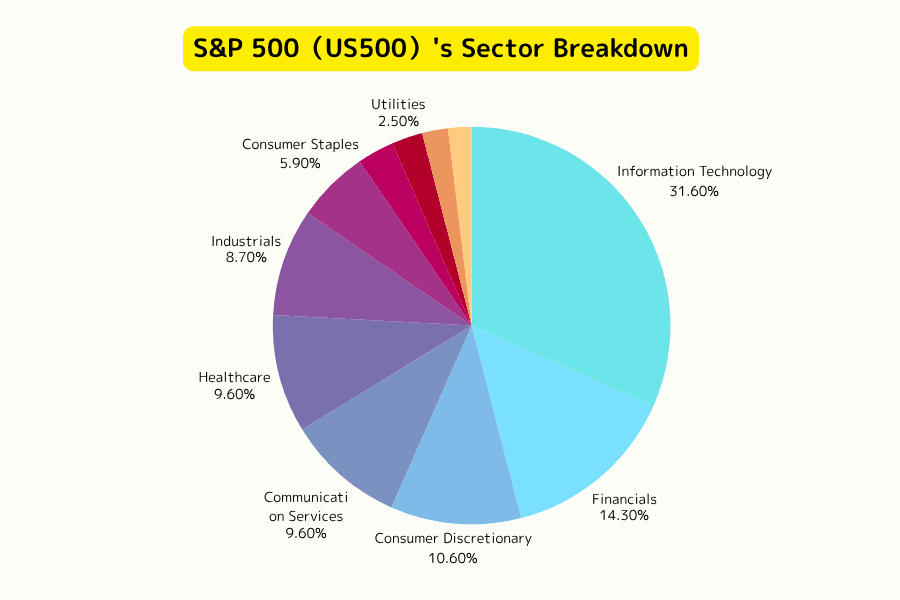
| Sector | Est. Weight | Representative Companies |
|---|---|---|
| Information Technology | 31.6% | Microsoft, Apple, NVIDIA |
| Financials | 14.3% | JPMorgan Chase, Visa, Berkshire Hathaway |
| Consumer Discretionary | 10.6% | Amazon, Tesla, Home Depot |
| Communication Services | 9.6% | Alphabet, Meta Platforms |
| Health Care | 9.6% | Eli Lilly, UnitedHealth Group |
| Industrials | 8.7% | Caterpillar, Boeing |
| Consumer Staples | 5.9% | Procter & Gamble, PepsiCo |
| Energy | 3.0% | ExxonMobil, Chevron |
| Utilities | 2.5% | NextEra Energy |
| Real Estate | 2.1% | American Tower |
| Materials | 1.9% | Freeport-McMoRan |
Notably, the top 10 constituents alone account for more than one-third of the index's total weight, meaning the performance of a handful of large technology stocks can significantly influence the overall index trajectory.
Recent Price History (2020–2025)
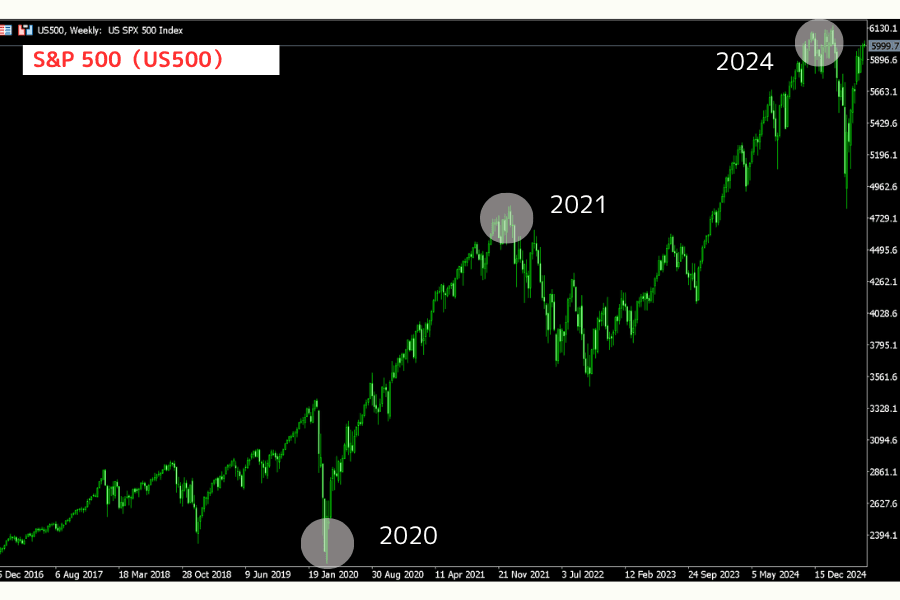
As the flagship benchmark for U.S. large-cap equities, the S&P 500 has been shaped in recent years by the macroeconomic environment, Federal Reserve interest rate policy, corporate earnings, and market sentiment.
2020: V-Shaped Recovery After Pandemic Shock
The COVID-19 pandemic triggered a sharp sell-off in March, with the index dropping over 30% from its February highs to March lows. The Federal Reserve's unlimited quantitative easing and fiscal stimulus fueled a rapid V-shaped recovery. Technology stocks, benefiting from the shift to remote work, drove a full-year gain of over 16%.
2021: Post-Pandemic Recovery Pushes New Highs
Vaccine rollouts, economic reopening, and strong corporate earnings lifted investor confidence. Energy, financials, and industrials led gains, and the S&P 500 rose approximately 27% for the year, reaching new all-time highs.
2022: Inflation and Rate Hikes Weigh on Valuations
U.S. inflation surged to 40-year highs, prompting aggressive rate hikes by the Federal Reserve. The S&P 500 declined approximately 18% for the year, with technology stocks bearing the brunt while energy stocks provided rare support.
2023: AI Boom Drives Rebound
Despite sustained high interest rates, the explosion of generative AI applications led a technology sector rally, pushing the S&P 500 to a full-year gain exceeding 28.7%.
2024: Technology and Semiconductors Lead
With the Federal Reserve signaling the end of its tightening cycle, investor risk appetite increased. NVIDIA, Microsoft, and other semiconductor and AI leaders reached record highs, and the index gained 25.0% for the year, marking a second consecutive year of 20%-plus returns.
2025 (Mid-Year): Range-Bound Trading
The index entered a consolidation phase from elevated levels, with markets focused on the Federal Reserve's interest rate decisions, tariff policies, and U.S.-China trade negotiations. Continued AI growth supported technology stocks, while persistent high rates and policy uncertainty capped the upside.
Key Factors Influencing the Index
Macroeconomic Factors
Economic growth and corporate earnings: The S&P 500's blue-chip constituents are highly sensitive to the overall economy. U.S. GDP data, earnings season, and the ISM Manufacturing Index are key reference points. Many constituents generate significant international revenue, so global economic trends also affect performance.
Inflation and interest rate expectations: Federal Reserve monetary policy is among the most critical drivers of S&P 500 valuations. CPI, nonfarm payrolls, and other data directly shape market expectations for the rate path.
Consumer spending and capital expenditure: U.S. personal consumption accounts for roughly 70% of GDP. Retail sales data impacts consumer discretionary and technology sectors. Corporate investment is influenced by interest rates and consumer confidence.
Sector and Company Factors
Sector rotation: The S&P 500 experiences notable rotation among technology, healthcare, financials, and consumer sectors. AI chip breakthroughs, healthcare innovation, energy price swings, and financial sector revaluations can trigger significant capital flows between sectors.
Mega-cap concentration: A handful of technology giants (Apple, Microsoft, NVIDIA) collectively account for roughly one-third of the index. A single company's earnings report or guidance can materially move the entire index.
Dividends and buybacks: Many S&P 500 companies maintain stable dividend policies and share buyback programs, providing price support and market capitalization stability.
Geopolitics and Capital Flows
Geopolitical risk: U.S.-China technology tensions, global supply chain restructuring, and tariff policies can erode corporate confidence and investment outlooks, particularly for export-dependent technology and industrial stocks.
Global capital rotation and the U.S. dollar: The S&P 500 is a cornerstone of global asset allocation. Capital flows between U.S. Treasuries, the dollar, and equities have a profound impact on the index.
Market sentiment and volatility: Investor risk appetite is reflected in the VIX volatility index and S&P 500 performance. In risk-off environments, capital may flow from equities into gold and other safe-haven assets, suppressing index performance.
Advantages and Risks
Advantages
Broad representation: Covering the 500 largest U.S. companies across 11 sectors and approximately 80% of total market capitalization, the S&P 500 is the primary benchmark for U.S. economic health and large-cap performance.
Constituent quality: Most constituents are financially robust, mature companies with stable earnings and counter-cyclical resilience, making the index suitable for medium- to long-term investors seeking steady returns.
High transparency: S&P Dow Jones Indices publicly discloses constituent changes, calculation methodology, and weighting information, providing investors with reliable data for strategy development.
Mature rebalancing mechanism: The S&P index committee conducts quarterly reviews based on market capitalization, liquidity, and sector balance to reflect current market trends.
Deep global participation: The S&P 500 is one of the most popular indices globally for ETF and futures products, with massive assets under management and high institutional participation.
Excellent product liquidity: US500 CFDs, ETFs, and futures enjoy active trading volumes, high liquidity, and low spreads, enabling flexible entry and exit.
Risks
Overall market volatility: The S&P 500 is highly sensitive to macroeconomic conditions and sentiment. Events such as inflation surges or tariff actions can trigger short-term sell-offs.
Sector concentration: Technology and financials together account for over 40% of the index. A correction in a single sector can significantly impact overall performance.
Interest rate sensitivity: High-rate environments compress growth stock valuations, while low-rate environments may increase speculative risk.
Geopolitical and policy uncertainty: Many constituents are multinational corporations exposed to trade conflicts, industrial subsidies, and regulatory changes.
Technology valuation adjustment risk: Recent AI- and cloud-driven valuation expansions among mega-cap technology stocks may be vulnerable to correction if growth expectations moderate.
How to Trade US500 with Titan FX
On trading platforms, the S&P 500 index CFD is traded under the symbol "US500." After opening a Titan FX trading account and completing a deposit, you can trade US500 CFDs on MT4 or MT5 platforms. This product supports leverage of up to 500:1 and allows both long and short positions to capture US500 price movements.
Note: US500 CFDs are available on Standard accounts only and are not supported on Micro accounts.
US500 CFD Trading Hours
| Time Zone | Winter Time (GMT+2) | Summer Time (GMT+3) |
|---|---|---|
| MT4/MT5 Platform | 01:00 - 23:59 (Fri 23:55 close) | 01:00 - 23:15 & 23:30 - 23:59 (Fri 23:55 close) |
| GMT (London) | 23:00 - 21:59 (Fri 21:55 close) | 22:00 - 20:15 & 20:30 - 20:59 (Fri 20:55 close) |
| EST (New York) | 18:00 - 16:59 (Fri 16:55 close) | 18:00 - 16:15 & 16:30 - 16:59 (Fri 16:55 close) |
Step 1: Log In to Your Trading Account
Download the MT4 or MT5 platform and log in with your Titan FX account credentials.
Step 2: Add US500 to Market Watch
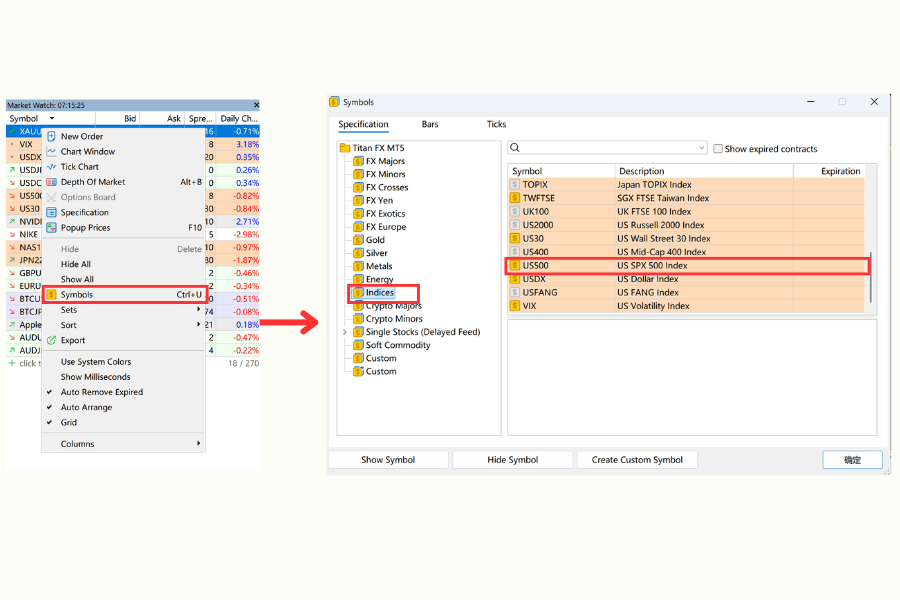
Right-click in the Market Watch window, select "Symbols," expand the "Indices" category, and double-click "US500" to add it to your watchlist.
Step 3: Place Your Trade
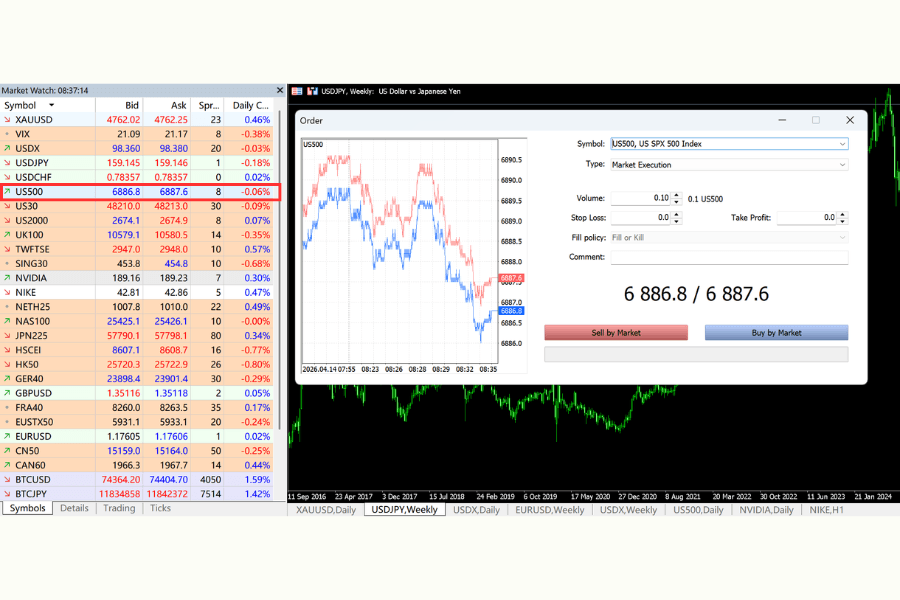
Double-click the US500 quote or open a chart, enter your lot size, select buy or sell, and execute your S&P 500 index CFD trade.
Titan FX provides an economic calendar and country-specific economic indicator pages to help you track key data affecting US500.
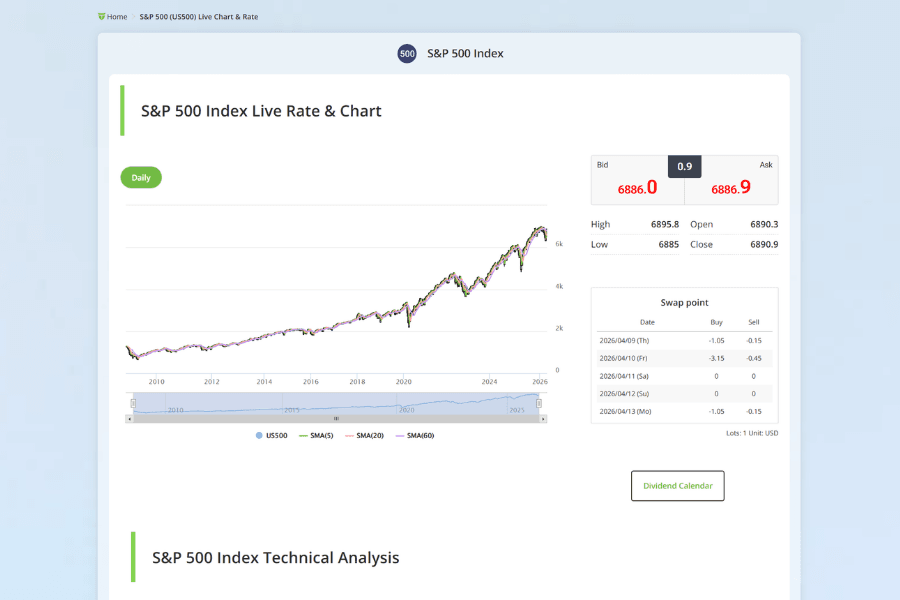
For the latest trading conditions and live prices, see the US500 product page.
Start Trading the S&P 500 Trade US500 CFDs with Titan FX and access leverage of up to 500:1, competitive spreads, and the flexibility to trade rising or falling markets. Index CFD trading is available on Zero Standard and Zero Blade accounts (not available on Zero Micro accounts).
Frequently Asked Questions
Q1: How does the S&P 500 differ from the Dow Jones and Nasdaq 100?
The S&P 500 (US500) is the most broadly representative U.S. equity benchmark. Compared to the Dow Jones Industrial Average (US30) and the Nasdaq 100 (NAS100), the three indices differ in constituent count, sector composition, and market coverage:
| Index | Constituents | Coverage | Sector Focus | Weighting |
|---|---|---|---|---|
| S&P 500 (US500) | 500 | ~80% of U.S. market cap | Balanced across sectors | Market-cap weighted |
| Nasdaq 100 (NAS100) | 100 | Large non-financial tech | Technology, AI, semiconductors | Modified market-cap weighted |
| Dow Jones (US30) | 30 | Blue-chip mega-caps | Industrials, financials, consumer | Price-weighted |
The S&P 500 combines diversification with large-cap stability, making it the preferred benchmark for passive funds, pension funds, and ETF investors. The Nasdaq 100 offers higher volatility and growth potential, while the Dow Jones emphasizes stability and defensiveness.
Q2: Can CFTC positioning data help predict S&P 500 movements?
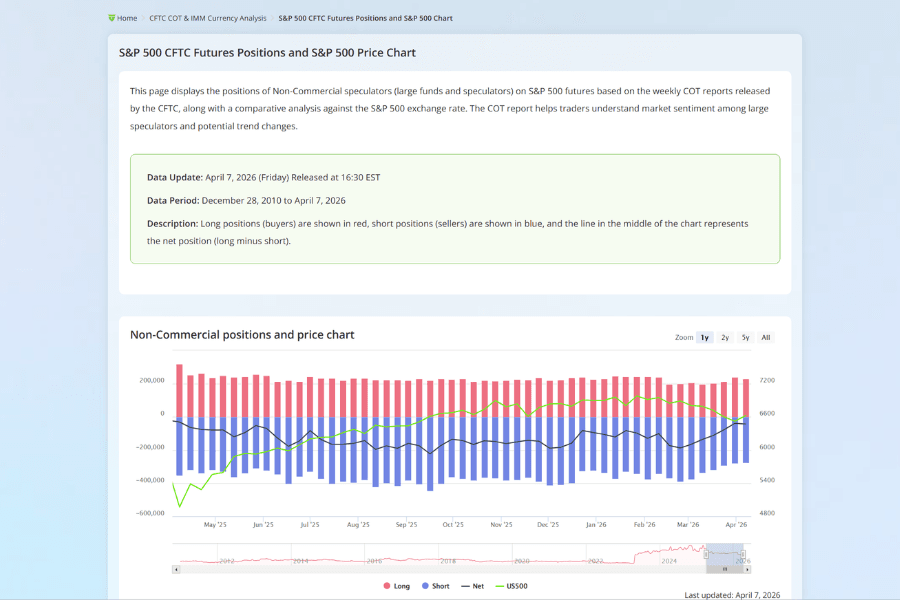
The CFTC (Commodity Futures Trading Commission) publishes a weekly Commitments of Traders (COT) report that provides insight into market sentiment for S&P 500 futures. Changes in non-commercial positions reflect the expectations of large institutional participants:
- Increasing non-commercial net longs: Institutional bias is bullish, suggesting further upside potential
- Expanding non-commercial net shorts: Institutions are positioning for a pullback or increased volatility
These positioning shifts often lead price changes by several weeks to months, providing useful signals for identifying medium-term trend reversals. Detailed data is available on the S&P 500 COT Report page.
Q3: Does the S&P 500 rebalancing affect price action?
The S&P 500 undergoes quarterly constituent rebalancing by the S&P index committee, based on market capitalization, liquidity, and sector representation criteria. The addition of fast-growing companies may attract capital inflows, while the removal of underperformers helps maintain index quality. ETFs and index funds must adjust their holdings in sync, creating short-term trading volume spikes and price fluctuations. Traders can monitor rebalancing announcements for potential trading opportunities.
Conclusion
The S&P 500 (US500) stands as the cornerstone benchmark of U.S. large-cap equities, offering broad sector representation, a stable growth track record, and exceptional liquidity that has attracted global investors for decades. Performance is driven by economic growth, interest rate policy, market sentiment, and sector dynamics.
Whether participating through ETFs, futures, or CFDs, investors should first develop a thorough understanding of the S&P 500's composition, influencing factors, and inherent risks. Combining technical analysis with fundamental research is essential for building a sound trading strategy. Remain vigilant about sector concentration risk, interest rate impacts, and geopolitical uncertainty, and practice disciplined stop-loss management as you build experience.
Further Reading
- Dow Jones Industrial Average (US30) Explained
- NASDAQ-100 (NAS100) Explained
- What Is a Stock Index?
- Economic Calendar
Titan FX's financial-market research team. We cover a broad set of instruments — foreign exchange, commodities (crude oil, precious metals, agricultural products), equity indices, US equities, and digital assets — producing educational content for investors.
Primary Sources (by Category)
- Index methodology and constituents: S&P Dow Jones Indices — S&P 500, Wikipedia — S&P 500
- ETF holdings: SPDR S&P 500 (SPY)
- Institutional positioning: CFTC — Commitments of Traders