Volatility
Volatility measures how much an asset's price fluctuates; higher volatility means larger swings and both greater risk and potential return, making it a key input for options pricing and investment decisions.
For traders, volatility is the market's pulse — without it there is no room to profit, yet too much of it sends risk soaring. That is precisely why its level shapes market sentiment and how investors weigh risk tolerance against potential returns.
This article explores volatility’s definition, types, its relationship with volume and liquidity, its benefits and risks, and introduces practical analysis tools to help investors navigate market dynamics and optimize trading strategies.
1. What is Volatility
Definition
Volatility measures the degree of price fluctuations for a financial asset over a specific period, typically expressed as a percentage or in points. It indicates market activity:
High volatility signals sharp price swings, while low volatility suggests relative stability.In markets like forex, stocks, or cryptocurrencies, volatility is a key factor for assessing trading conditions and strategy risks. For example:
- USD/TRY (US Dollar/Turkish Lira) often exhibits high volatility, appealing to short-term traders seeking high returns.
- EUR/USD (Euro/US Dollar) has smaller fluctuations, suiting conservative investors.
Types of Volatility
Volatility is categorized into three types, each with distinct characteristics and applications:
| English Name | Description | Features | Common Uses |
|---|---|---|---|
| Historical Volatility (HV) | Calculated from past price data | Retrospective, reflects historical fluctuations | Backtesting and trend analysis |
| Implied Volatility (IV) | Derived from option prices, estimating future volatility expectations | Forward-looking, captures market sentiment | Risk assessment, option strategy design |
| Realized Volatility (RV) | Based on recent actual price movements | Real-time, reflects current market conditions | Tracking real-time risk, comparing with IV |
Complementary Roles:
- HV analyzes past price behavior.
- IV gauges market expectations for future volatility.
- RV measures current price fluctuations.
2. Volatility, Volume, and Liquidity
Volatility is closely tied to market volume and liquidity. Below are three key relationships:
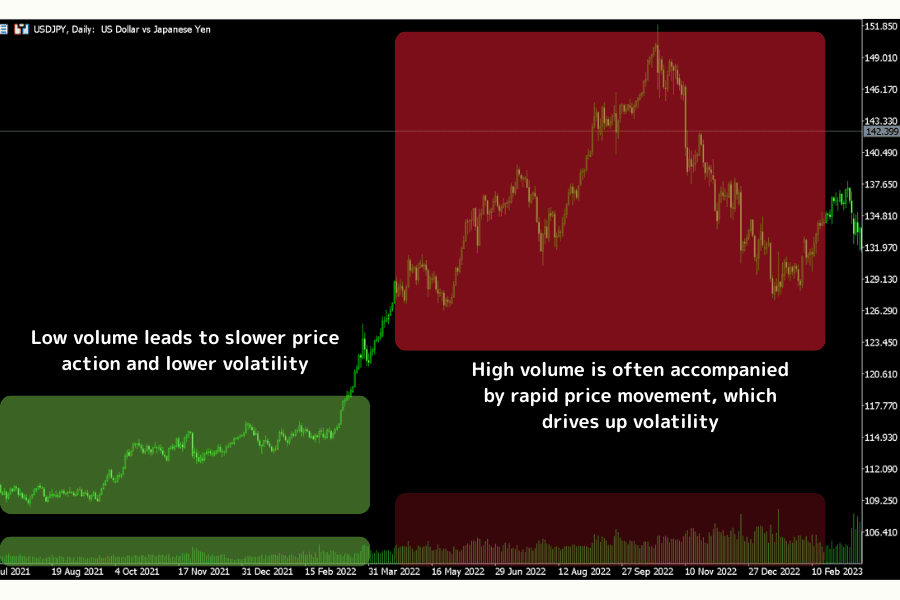
Volume
Volume reflects trading activity and is typically positively correlated with volatility.
- High volume, driven by active buying and selling, amplifies price swings, increasing volatility.
- Low volume, often seen during holidays or off-peak hours, results in smaller price movements and lower volatility.
Liquidity
Liquidity, the ease of buying or selling an asset, is inversely correlated with volatility.
- High-liquidity assets (e.g., EUR/USD) have tight bid-ask spreads and stable prices, leading to lower volatility.
- Low-liquidity assets (e.g., EUR/TRY) have wider spreads and sparse quotes, causing higher volatility.
Time and Seasonal Factors
Volatility varies by trading session and season:
- Major market opening hours (e.g. London and New York markets) or their overlapping hours (9pm to 1am UTC+8) are the most active times of the market and volatility is usually higher.
- In contrast, during the Asian trading session (UTC+8 early morning to noon) or holiday periods, there are fewer market participants and volatility is usually lower.
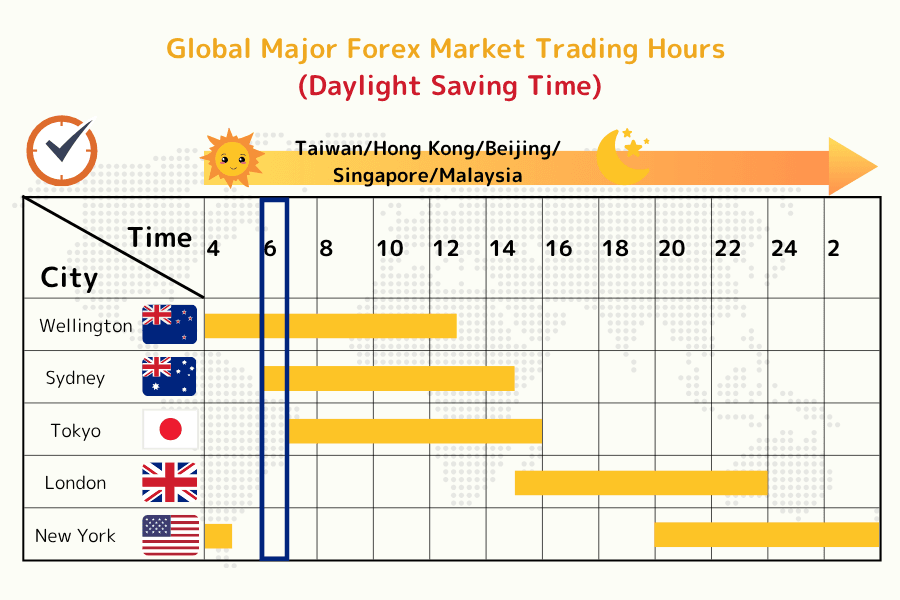
Global markets may close during holidays (e.g., Christmas, Easter), reducing liquidity and volatility. Investors should monitor holiday schedules to plan trades effectively.
3. Benefits and Risks of Volatility
Volatility is a double-edged sword, offering opportunities and risks. Below, we analyze its benefits, risks, and practical strategies.
Benefits of Volatility
Benefit 1: High Return Potential
High volatility creates larger price movements, ideal for short-term traders. Assets like GBP/JPY or Bitcoin, with daily swings of hundreds of pips, offer significant profit potential for swing trading or breakout strategies.
Benefit 2: Flexible Entry and Exit Timing
Volatile markets provide frequent entry and exit opportunities. During low volatility, range-bound markets suit range trading. Adapting strategies to volatility levels improves win rates and capital efficiency.
Common automated order types for managing entries and exits:
| Order Type | Description |
|---|---|
| Stop Order | Triggers a buy or sell when the price hits a preset level. |
| IFD Order | Executes a second order (e.g., take-profit/stop-loss) after the first trade is filled. |
| OCO Order | Sets take-profit and stop-loss simultaneously; one executes, the other cancels. |
| IFO Order | Combines IFD and OCO, setting entry conditions and exit strategies. |
| Trailing Stop | Adjusts stop-loss dynamically with favorable price moves to lock in profits. |
Benefit 3: Aligning with Risk Preferences
Volatility helps investors choose assets matching their risk tolerance. Conservative traders prefer low-volatility pairs like EUR/CHF to minimize whipsaws, while aggressive traders target high-volatility assets for higher returns.
Risks of Volatility
Risk 1: Amplified Losses
High volatility increases the risk of significant losses, especially without proper stop-losses. For example, Bitcoin’s volatility exceeded 60% in 2022, with sharp reversals causing heavy losses for unprepared investors.
Risk 2: Slippage
During major news events or market shocks, rapid price jumps can cause slippage, where orders execute at unintended prices. For instance, USD/JPY may gap 50–100 pips after Non-Farm Payrolls, deviating from planned entry/exit points.
Risk 3: Stop-Loss Execution Issues
In volatile markets, stop-loss orders may execute at worse-than-expected prices or miss entirely, especially during gap openings or news-driven spikes, leading to larger-than-anticipated losses.
4. Volatility Analysis Tools and Indicators
Below are four widely used tools and indicators for analyzing volatility and refining strategies:
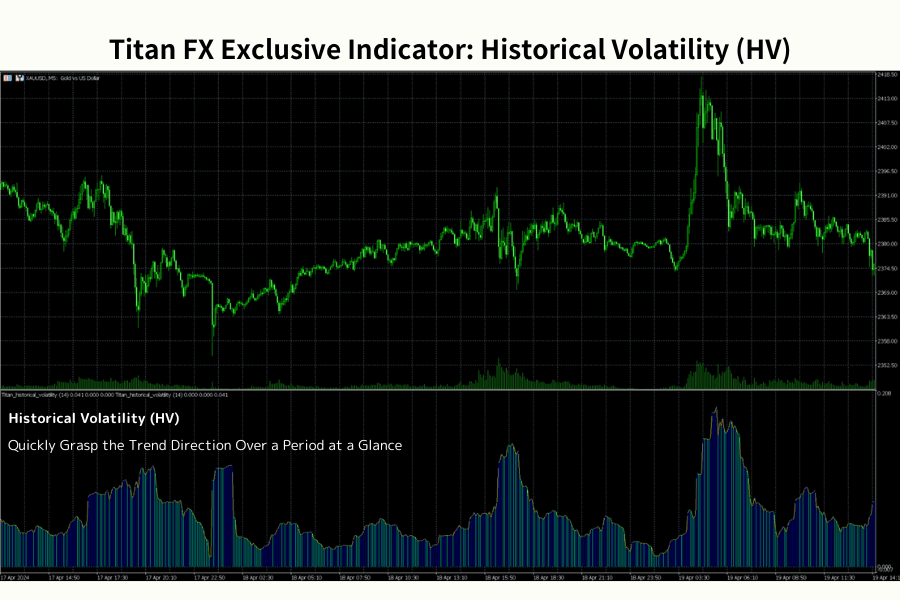
Historical Volatility (HV) Indicator
HV calculates past price fluctuations, displayed as a curve.
- Rising HV signals increasing volatility, often preceding trends.
- Falling HV indicates consolidation, suggesting caution for reversals.
When HV rises from a low and prices break above a moving average, consider buying; a drop from a high warns of potential reversals.
Titan provides a unique Historical Volatility (HV) indicator, which is free for users who hold a Titan trading account. MT4 and MT5 versions are also available.
Bollinger Bands
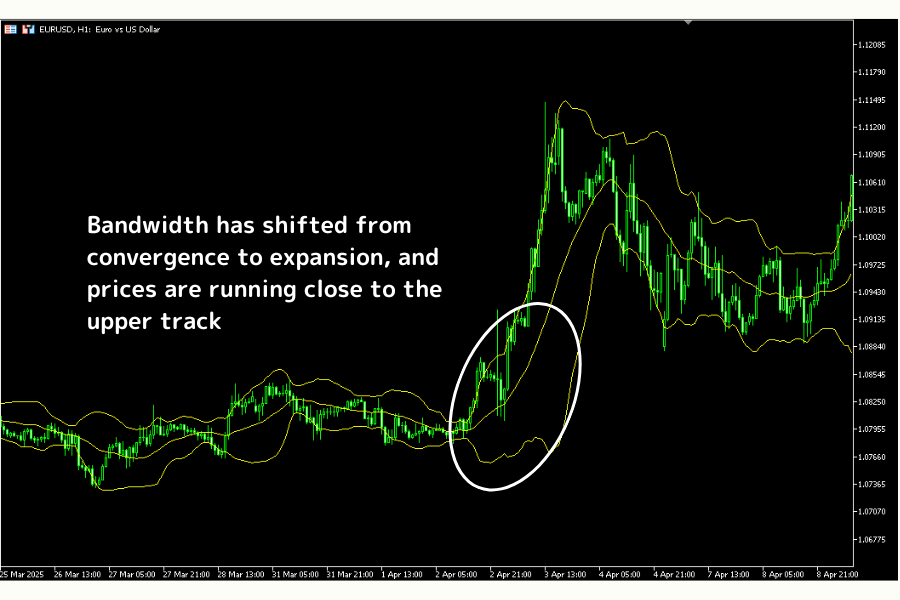
Bollinger Bands plot a moving average with upper and lower bands based on standard deviations, reflecting price ranges.
- Expanding bands signal high volatility; contracting bands indicate low volatility.
- A price breakout above the upper band with rising volume suggests a buy; a drop below the lower band signals a sell.
Average True Range (ATR)
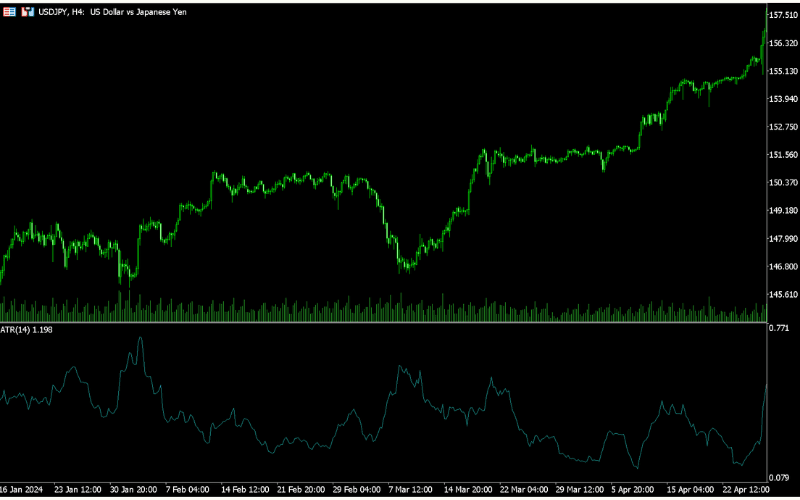
ATR measures average price fluctuations, aiding in stop-loss and target setting.
- Rising ATR indicates higher volatility, requiring wider stops (e.g., 2x ATR).
- Falling ATR suggests stability, allowing tighter stops.
For example, if GBP/USD’s daily ATR is 100 pips, set wider stops to accommodate volatility.
Volatility Index (VIX)
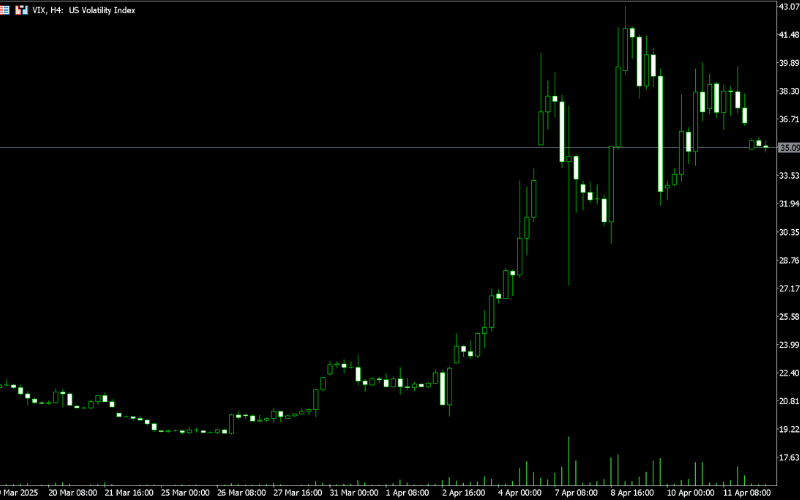
VIX, based on S&P 500 option prices, measures market fear. VIX above 30 indicates high volatility; below 20 suggests calm.
- A spiking VIX prompts a shift to safe-haven assets (e.g., gold).
- A declining VIX favors risk assets (e.g., equities).
5. Frequently Asked Questions (FAQ)
Q1: Is high volatility always ideal for trading?
Not necessarily. High volatility offers larger price swings and potential profits but also increases risks. Match assets to your risk tolerance and use robust risk management, such as stop-losses and position sizing.
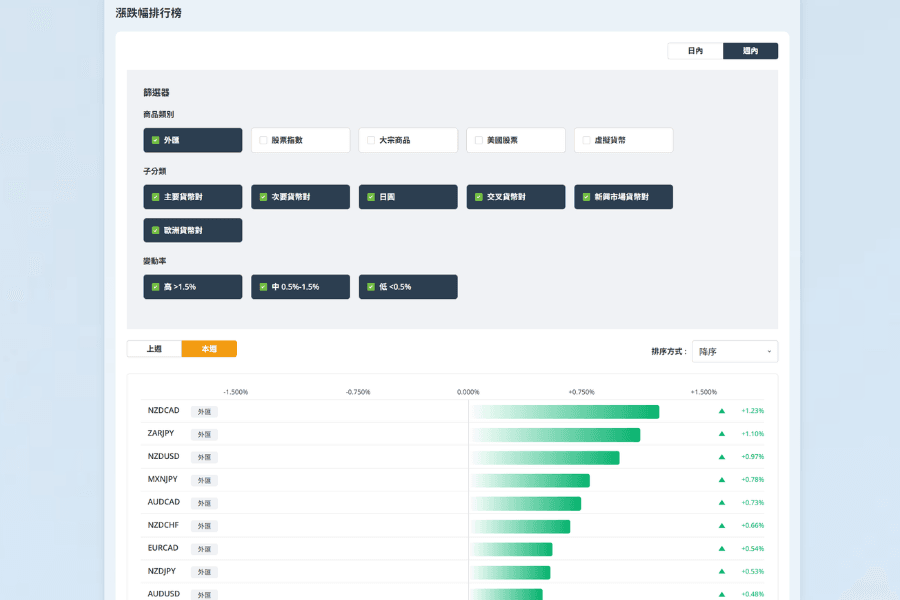
Q2: Which assets typically have high volatility?
Emerging market currencies (e.g., ZAR, TRY), cryptocurrencies (e.g., Bitcoin), and small-cap stocks often exhibit high volatility. Major currency pairs (e.g., EUR/USD) and large-cap stocks (e.g., Apple, Microsoft) are more stable.
Q3: How can I predict if volatility will persist?
Use technical indicators like ATR or Bollinger Bands to assess volatility trends, and monitor economic events (e.g., Fed rate decisions) to gauge whether high volatility will continue.
Q4: How do implied and historical volatility differ?
Implied volatility, derived from option prices, reflects market expectations for future volatility. Historical volatility, based on past price data, analyzes previous price behavior.
6. Conclusion
Volatility is a cornerstone of financial markets, shaping trading strategies and risk management. By understanding historical, implied, and realized volatility, investors can better interpret market sentiment and price dynamics. Tools like Bollinger Bands, ATR, and VIX enhance volatility analysis and strategy execution.
However, volatility brings risks like slippage and stop-loss issues alongside opportunities. Combining volatility insights, disciplined capital management, and adaptability to market conditions enables investors to thrive in dynamic trading environments.
Further Reading
- Forex Trading Basics
- What is Forex Leverage?
- What is Stop Loss?
- What is Black Swan Event?
- The 2% Risk Rule
Titan FX Trading Strategy Lab. We produce investor-education content covering forex, commodities (crude oil, precious metals, agricultural goods), stock indices, U.S. equities, and digital assets.
Primary Sources (by Category)
- Volatility theory: Black, F. & Scholes, M. (1973) "The Pricing of Options and Corporate Liabilities" — implied volatility foundations; Mandelbrot, B. (1963) "The Variation of Certain Speculative Prices" on price-distribution fat tails
- Indicators: CBOE — VIX index methodology; J. Welles Wilder Jr. (1978) New Concepts in Technical Trading Systems — ATR introduction
- Market data: FRED (Federal Reserve Bank of St. Louis) — VIX historical time series