What Is the VIX Volatility Index? How to Read & Trade the Fear Index
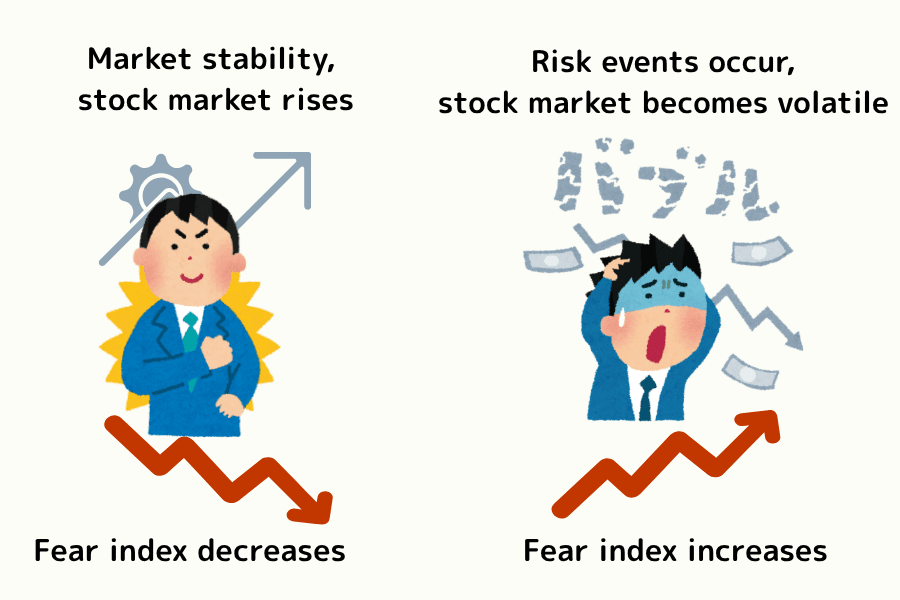
VIX is not a traditional index that tracks stock prices. Instead, it measures the market's expectation of volatility over the next 30 days. Compiled by the Chicago Board Options Exchange (CBOE), VIX is derived from the implied volatility of S&P 500 index options, earning it the nickname "Fear Index" -- when market uncertainty rises, VIX surges.
For CFD traders, VIX offers unique value: it is both a directly tradeable instrument and a core gauge of global risk sentiment. Whether in equities, forex, gold, or cryptocurrencies, VIX movements provide cross-market trading signals. This article covers VIX from its mechanics and historic spikes to practical trading strategies, offering a comprehensive guide to this "market thermometer."
- The VIX (CBOE Volatility Index) measures expected 30-day implied volatility on the S&P 500 — the market's "fear gauge".
- It's derived from SPX options as a weighted average — a forward-looking volatility expectation.
- Rough thresholds: < 12 calm, 12–20 normal, 20–30 elevated, > 30 panic, > 40 systemic stress.
- Strong inverse correlation with the S&P 500 (about −0.7 to −0.8) — a natural equity hedge.
- VIX itself cannot be bought directly — trade via VIX futures, ETF/ETN, or USVIX CFD on Titan FX (long or short).
What Is the VIX Volatility Index?
The VIX (CBOE Volatility Index) is a volatility index introduced by the Chicago Board Options Exchange (CBOE) in 1993. It measures the market's expectation of S&P 500 (US500) volatility over the next 30 days. Unlike conventional stock indices that track share prices, VIX tracks the "level of market fear," which is why it is also known as the "Fear Index."
| Item | Details |
|---|---|
| Official Name | CBOE Volatility Index |
| Trading Symbol | VIX (CFD) |
| Year Launched | 1993 (calculation method revised in 2003) |
| Compiled By | Chicago Board Options Exchange (CBOE) |
| Calculation Basis | Implied volatility of S&P 500 (SPX) options |
| Option Expiry Range | SPX options with 23-37 days to expiry |
| Unit | Annualized percentage (e.g., VIX = 20 means expected annualized volatility of 20%) |
| Update Frequency | Real-time updates every 15 seconds |
How VIX Is Calculated
VIX is not calculated from a single option. Instead, it aggregates the prices of multiple S&P 500 index call and put options with expiry dates between 23 and 37 days. By computing a weighted average of these options' implied volatilities, VIX produces a "consensus expectation" of how much the market expects to move over the next 30 days. The full calculation methodology is published in the official CBOE Volatility Index Methodology white paper.
In simple terms: when investors anticipate sharp market moves, they purchase protective options in large quantities, driving up option prices and pushing VIX higher. Conversely, when the market is calm, option demand falls and VIX moves lower.
Unlike stock price indices such as the Dow Jones Industrial Average (US30) or the Nasdaq 100 (NAS100), VIX exhibits a pronounced "mean reversion" characteristic -- extreme highs do not persist for long and eventually revert to normal ranges. This property gives traders a unique strategic edge.
How to Read the Fear Index
VIX values directly reflect the degree of fear and greed in the market. Below is a general guide to interpreting each range:
| VIX Range | Market Sentiment | Typical Scenario |
|---|---|---|
| 10-15 | Extremely calm | Market is optimistic with volatility at lows, common during the middle of prolonged bull markets |
| 15-20 | Normal levels | Market is running steadily with buyers and sellers in relative balance |
| 20-30 | Rising anxiety | Uncertainty is increasing, investors begin adding hedging positions |
| 30-40 | Spreading fear | Significant selling in the market, institutions buying protective options in large volumes |
| Above 40 | Extreme fear | Financial-crisis-level fear, violent market swings, liquidity may dry up |
Key Interpretation Principles
VIX and the stock market typically exhibit a negative correlation: when the S&P 500 falls, VIX tends to rise; when equities rally steadily, VIX tends to stay low. However, this relationship is not absolute -- during rapid market rallies, VIX can sometimes spike briefly, reflecting investor unease about the pace of gains.
Another important characteristic of VIX is its "asymmetry": the magnitude of VIX increases during market declines is typically far greater than the magnitude of VIX decreases during market advances. This is because fear spreads faster than optimism -- markets can spend months gradually climbing but can crash within days.
Historic Spike Events
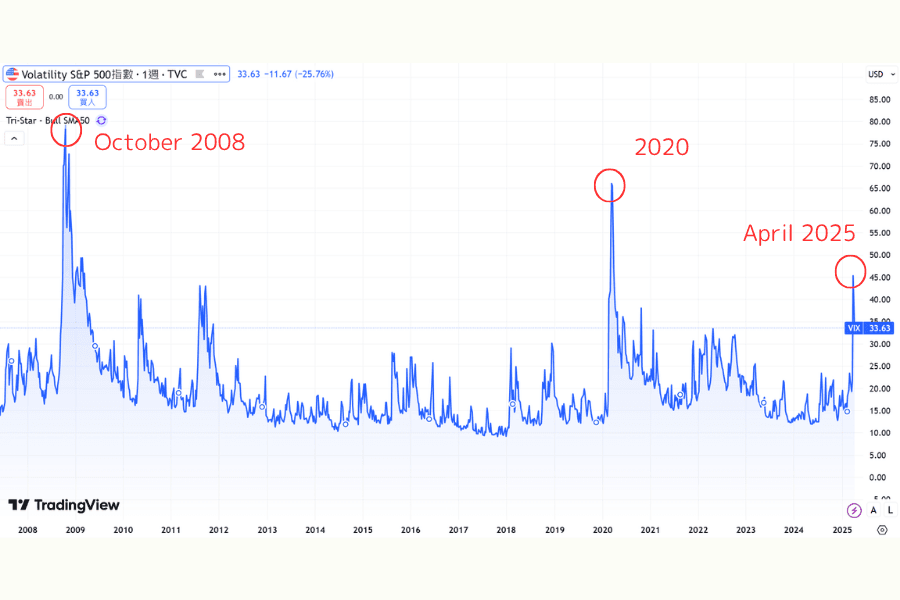
VIX's historical peaks record every instance of extreme market panic. Daily historical readings are available in the St. Louis Fed FRED database (VIXCLS series). Below are the major VIX surges over the past 30 years:
| Date | Event | VIX Peak | Context |
|---|---|---|---|
| October 1998 | Russian Debt Crisis / LTCM Collapse | 49.53 | Hedge fund LTCM neared collapse, sparking systemic risk fears |
| October 2008 | Post-Lehman GFC Peak (Lehman filed 9/15 → VIX 89.53 intraday on 10/24) | 89.53 (intraday) / 79.13 (close) | Peak of the Global Financial Crisis, VIX hit an all-time intraday record |
| August 2011 | European Debt Crisis (Greece) | ~40 | Greek sovereign default risk spread across the eurozone |
| August 2015 | China Economic Slowdown | 53.29 | Sudden yuan devaluation and A-share crash triggered global sell-off |
| February 2018 | Volatility Storm (Volmageddon) | 50.30 | Mass collapse of VIX short strategies, inverse VIX ETFs liquidated |
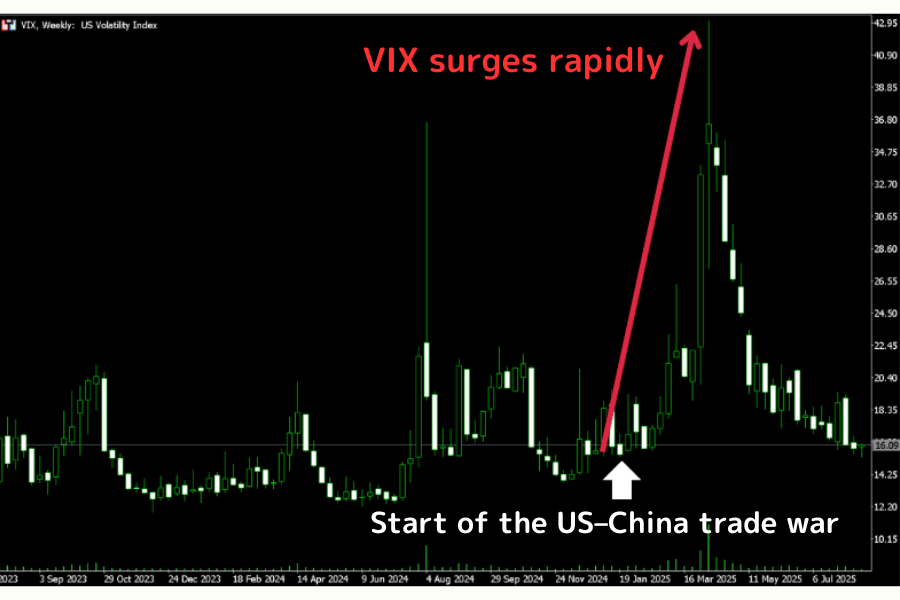
| 2019 | U.S.-China Trade War | ~21-23 | Tariff threats repeatedly escalated but did not trigger extreme fear |
| March 2020 | COVID-19 Pandemic | 85.47 | Global lockdowns and economic shutdown, VIX surged to second-highest ever |
| March 2022 | Russia-Ukraine War | ~30-32 | Geopolitical conflict combined with rate hike expectations, markets in turmoil |
| April 2025 | Trump Tariff Policy | 60.13 | Sharp escalation of U.S.-China tariffs, global trade order uncertainty surged |
Patterns from Historical Peaks
Several important patterns emerge from these events: extreme VIX surges typically peak within days to weeks and then gradually decline. Even the 89.53 during the 2008 financial crisis and 85.47 during the COVID-19 pandemic saw VIX return below 30 within months of peaking. This mean reversion characteristic is the cornerstone of VIX trading strategies.
Additionally, the 2025 tariff shock (60.13) reminds traders that policy risk can also trigger extreme volatility, and such events are often difficult to predict in advance.
Cross-Market Applications
The value of VIX extends well beyond stock market analysis -- it serves as a barometer of risk sentiment across global financial markets, with significant implications for forex, commodities, and cryptocurrency markets.
| Asset Class | Typical Reaction When VIX Rises | Typical Reaction When VIX Falls | Explanation |
|---|---|---|---|
| U.S. Equities (US500, NAS100) | Decline | Rally | VIX and stocks are highly negatively correlated |
| Safe-Haven Currencies (JPY, CHF) | Strengthen | Weaken | Fear drives capital into safe-haven currencies |
| Gold (XAUUSD) | Rise | Weaken or consolidate | Risk-off demand pushes gold higher |
| Crude Oil (WTI) | Decline (in most cases) | Rise | Recession fears compress demand expectations |
| Cryptocurrencies (BTC) | Decline | Rise | Risk assets are hit first during panic |
Forex Market Applications
When VIX surges, capital tends to flow out of risk assets, and safe-haven currencies such as the Japanese yen (JPY) and Swiss franc (CHF) typically strengthen. Traders can use VIX as an auxiliary indicator for forex -- for example, when VIX breaks above 25 and continues climbing, long USD/JPY strategies may face headwinds. The U.S. Dollar Index (USDX) is also worth monitoring simultaneously, as risk-off sentiment tends to drive the dollar higher.
Titan FX's Economic Calendar and Volatility Heatmap allow you to track key economic data affecting VIX and the volatility status of various markets in real time.
Commodity Market Applications
VIX and gold typically show a positive correlation -- fear drives risk-off capital into gold. However, crude oil's response is more nuanced: if the VIX surge is driven by recession fears, oil tends to weaken on lower demand expectations; but if the panic stems from geopolitical conflict (such as Middle East tensions), oil may actually rise.
Cryptocurrency Market Applications
Although cryptocurrencies are sometimes considered "digital gold," during periods of extreme VIX spikes (such as March 2020), Bitcoin and other crypto assets tend to decline alongside traditional risk assets. VIX can serve as a leading indicator for assessing the risk environment of the crypto market.
Major Global Volatility Indices
VIX is the world's best-known fear index, but major markets each have their own volatility gauges:
| Index | Underlying | Market | Description |
|---|---|---|---|
| VIX | S&P 500 (SPX) Options | U.S. | The world's most representative fear index, tradeable as a CFD |
| VXN | Nasdaq 100 Options | U.S. | Reflects tech stock volatility expectations, typically higher than VIX |
| MOVE | U.S. Treasury Options | U.S. | The bond market's fear index, particularly watched during rate hike cycles |
| VSTOXX | Euro Stoxx 50 Options | Europe | The European equivalent of VIX, surged sharply during the European debt crisis |
| Nikkei VI | Nikkei 225 Options | Japan | Japan's market volatility gauge |
Correlations Between Indices
Global volatility indices are highly interconnected. When VIX surges significantly, VSTOXX and Nikkei VI typically rise in tandem, reflecting the contagion of global risk sentiment. However, during regional events (such as the European debt crisis), regional indices may diverge markedly from VIX.
VXN, which tracks the tech-heavy Nasdaq, typically runs 5-10 points above VIX, reflecting the inherently higher volatility of technology stocks.
The MOVE index attracted particular attention during the 2022-2023 rate hike cycle, when bond market volatility temporarily exceeded that of equities and MOVE surged to its highest levels since 2008.
Trading Strategies
Technical Analysis Tools (Titan FX Tools)
Titan FX provides a range of analytical tools to help traders assess VIX's technical profile and the broader market risk environment:
- Support & Resistance: Identify key VIX levels to gauge fear sentiment floors and ceilings
- Order Book (Position Info): View the long/short ratio distribution of other traders
- Trend Analysis: Determine whether VIX is in a rising volatility phase or reverting to stability
- RSI Analysis: Identify whether VIX is overbought (fear peaking) or oversold (excessive optimism)
- Volatility Heatmap: Compare VIX's volatility status with other assets
- Percentage Change Ranking: Compare real-time gains and losses across indices and commodities
- Swap Calendar: Check overnight interest rates for VIX CFDs
- Dividend Calendar: Confirm dividend adjustment timing for index CFDs
Specific Trading Approaches
Mean Reversion Strategy
VIX's most notable characteristic is mean reversion. When VIX spikes above 40, historical data suggests it typically declines within weeks. Traders can look to short VIX once it hits extreme highs and shows signs of pulling back. However, VIX can remain elevated longer than expected during panic periods, so setting a stop-loss is essential.
Event-Driven Strategy
Ahead of major economic events such as FOMC Rate Decisions, Nonfarm Payrolls (NFP), and CPI releases, VIX typically rises in advance as the market prices in uncertainty. After the event is announced -- regardless of whether the outcome is positive or negative -- VIX tends to drop quickly (the so-called "volatility crush"). This presents short-term traders with an opportunity to short VIX following the event.
Cross-Market Hedging Strategy
VIX's negative correlation with equities can be used for hedging. Traders holding long positions in U.S. stocks can simultaneously go long VIX as insurance -- when the market suddenly drops, VIX gains can partially offset losses on equity positions.
How to Trade VIX on Titan FX
On the Titan FX platform, VIX is available as a CFD (Contract for Difference) with up to 500:1 leverage. You can also trade directly in your browser using WebTrader.
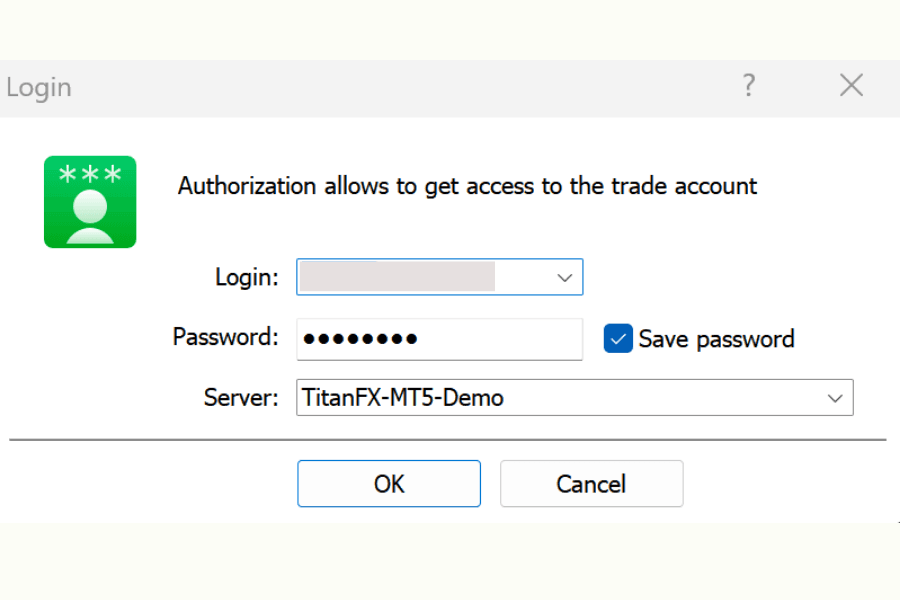
Step 1: Log In to Your Trading Account
Open a Titan FX trading account (Zero Standard or Zero Blade), complete your deposit, download the MT4 or MT5 platform, and log in with your credentials.
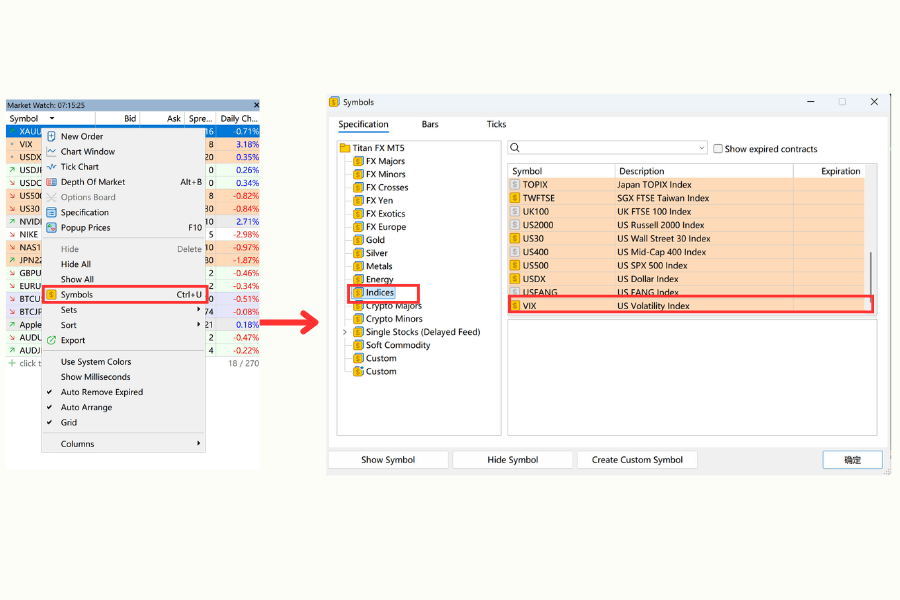
Step 2: Add VIX to Your Watchlist
In the Market Watch window, right-click and select "Symbols." Expand the "Indices" category, find VIX, and double-click to add it to your watchlist.
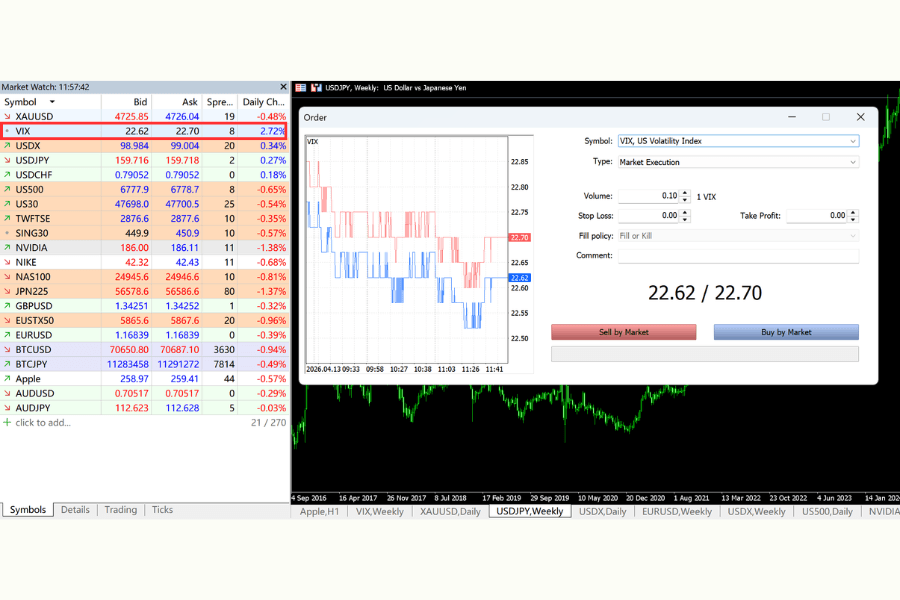
Step 3: Place Your Trade
Double-click the VIX quote or open a chart to access the order window. Enter your lot size (minimum 0.1 lots), choose your direction (buy or sell), set your stop-loss and take-profit levels, and execute the trade.
Trading Hours (Eastern Time):
| Session | Server Time (GMT+3) | Eastern Time (Summer) |
|---|---|---|
| Main Trading Session | 01:00 - 23:59 | 18:00 - 17:59 next day |
| Friday Close | 23:55 | 16:55 |
For the latest trading conditions and spreads, see the official page.
For the latest trading conditions and live prices, see the instrument page.
Start Trading the VIX Volatility Index Trade VIX CFDs on Titan FX with up to 500:1 leverage, tight spreads, and the flexibility to go long or short. Index CFD trading is available on Zero Standard and Zero Blade accounts (not available on Zero Micro accounts).
Key Considerations for New Traders
VIX Alone Is Not a Trading Signal
VIX reflects market sentiment, not market direction. A rising VIX means increasing uncertainty, but it does not necessarily mean the stock market will fall -- markets sometimes bottom and rebound amid fear. Combining VIX with price action, technical indicators, and fundamental analysis is essential for improving the accuracy of your judgment.
Focus on Medium-to-Long-Term Trends, Not Intraday Swings
VIX can exhibit dramatic intraday swings, but short-term spikes and drops often lack follow-through. For traders who are not full-time scalpers, observing VIX's weekly trend and historical ranges is more valuable than chasing intraday movements.
Data Sources and Real-Time Tracking
VIX data can be viewed in real time on the CBOE official website, and Titan FX's platform also provides live VIX quotes and charts. Using the Economic Calendar to track upcoming major events can help anticipate potential VIX movements.
Leverage and Risk Management
Titan FX offers up to 500:1 leverage on Zero Standard and Zero Blade accounts. VIX itself is a measure of volatility, so its price swings are inherently sharp. When trading VIX with high leverage:
- Keep the risk on any single trade within 1-2% of your account equity
- VIX can rise 30-50% in a single day during panic periods, so leave sufficient room for your stop-loss
- Use Titan FX's Margin Calculator to determine the required margin and appropriate position size
The Mean Reversion Trap
While VIX exhibits mean reversion, during periods of extreme fear (such as 2008 and 2020) it can remain elevated for weeks or even months. Shorting VIX too early is a common beginner mistake -- waiting for clear signs of a pullback before entering is a more robust approach than trying to call the exact top.
Frequently Asked Questions
Does a rising VIX always mean the stock market will fall?
Not necessarily. VIX measures expected volatility, not market direction. A rising VIX indicates increasing uncertainty, and the probability of a stock market decline is indeed higher, but there are exceptions -- for example, VIX can spike briefly during rapid market rallies, reflecting investor unease about the pace of gains. Combining VIX with price trends and technical indicators provides a more accurate picture of market direction.
Under what circumstances does VIX typically surge sharply?
VIX typically surges during sudden crisis events, such as the collapse of financial institutions (Lehman Brothers in 2008), global pandemics (COVID-19 in 2020), major policy shocks (tariff escalation in 2025), or geopolitical conflicts. The common thread is that these events are "unexpected by the market" and "difficult to assess in terms of consequences," prompting investors to buy protective options in large volumes and driving VIX higher.
What is the difference between VIX and other volatility indices (VXN, MOVE)?
VIX is calculated from S&P 500 options and reflects the overall fear level of the U.S. stock market. VXN is based on Nasdaq 100 options and reflects tech stock volatility expectations, typically running 5-10 points above VIX. MOVE tracks U.S. Treasury option volatility and serves as the bond market's fear gauge. MOVE is particularly valuable during rate hike cycles. The three indices show some positive correlation but can diverge under specific market conditions.
Summary
The VIX Volatility Index is a one-of-a-kind indicator in global financial markets -- rather than tracking stock prices, it quantifies market fear. Understanding VIX's mechanics, historical patterns, and cross-market influence helps traders gain a more comprehensive view of the market risk environment.
VIX's mean reversion characteristic, negative correlation with equities, and event-driven volatility patterns provide traders with multiple strategic options. At the same time, VIX is inherently volatile, and disciplined risk management is a prerequisite for trading success.
Make full use of Titan FX's VIX live price and chart page to stay on top of market developments, and pair it with the Economic Calendar to track major events as you apply the analytical framework in this article to your trading.
Further Reading
- Monetary Policy — Fed decisions are among the main catalysts for VIX spikes.
- Raise Interest Rates — How tightening cycles structurally lift implied volatility.
- Cut Interest Rates — How easing cycles let VIX drift structurally lower.
- Inflation — CPI surprises are a frequent trigger for VIX jumps.
- US Treasury Yields — Sharp yield moves often coincide with VIX expansions.
- Asset Allocation — Using VIX as a hedge in portfolio construction.
The Titan FX Research team covers global macroeconomic indicators, foreign exchange (FX), commodities (oil, precious metals, agriculture), equity indices, US stocks, and crypto assets, producing educational content for investors and traders.
Primary Sources by Category
- Official data and regulators: CBOE Global Markets — VIX White Paper / VIX methodology; Federal Reserve Economic Data (FRED) — VIXCLS series; U.S. Securities and Exchange Commission (SEC) — volatility-related disclosures; Federal Reserve — FOMC Statements / Financial Stability Reports.
- Exchanges and market data: CBOE — VIX futures / VIX options; CME Group — S&P 500 VIX Futures volume / open interest; Bloomberg, Reuters — real-time and historical VIX data.
- Media and historical references: Bloomberg, Reuters, WSJ, Financial Times; 1987 Black Monday (VIX precursor), 1998 LTCM, the 2008 GFC (VIX into the 80s), the 2010 Flash Crash, 2018 Volmageddon (XIV blow-up), 2020 COVID (VIX 82.69), the 2022 Fed tightening regime, and 2025 SVB systemic stress.