

What Is the US Dollar Index (USDX/DXY)? Component Currencies, What Drives It, and How to Trade It
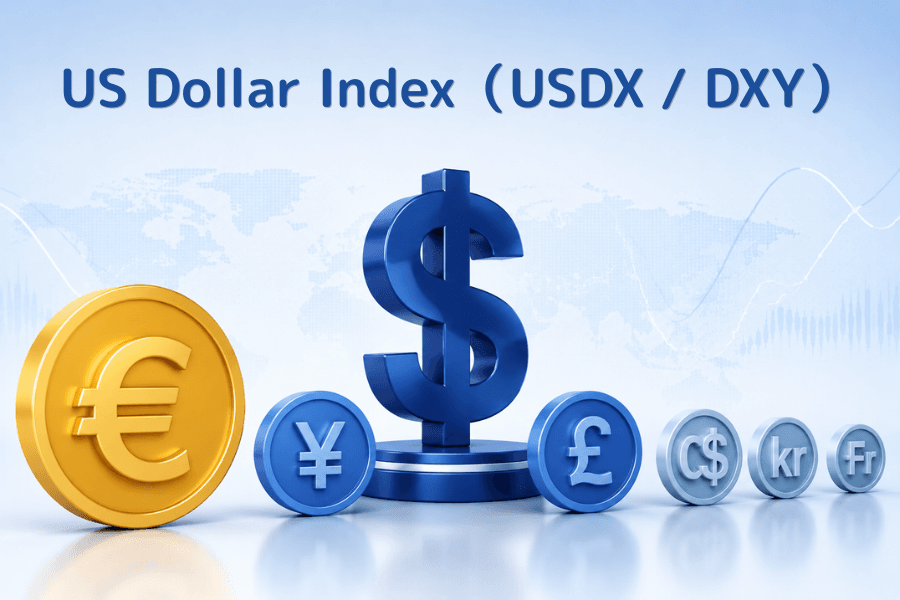
It is the single most quoted number in the currency market: when the index rises, the dollar has strengthened against those six as a group, and when it falls the opposite is true. To tell whether today's move belongs to the dollar or to one particular currency, the index answers faster than any single pair.
One property of that number gets overlooked, though. Roughly 77% of the basket is European currencies, and the Chinese yuan, Mexican peso and Korean won are not in it at all. This guide covers what the index actually measures and what it does not, how to read its level and its cycles, and how to trade it with Titan FX.
- The dollar index is a geometric weighted average of the dollar against six currencies, based at 100 in March 1973 and published in real time by ICE
- The euro carries 57.6%; adding sterling, the Swedish krona and the Swiss franc brings European currencies to roughly 77%, which makes it closer to "the dollar against Europe" than "the dollar against the world"
- 100 is not a dividing line between a strong and weak dollar. It only means the same level as March 1973; the historical range runs from about 70 in 2008 to 164 in 1985
- The main drivers are the policy gap between the Fed and other central banks, US economic data, and safe-haven flows
- COT positioning and the US-German yield spread suit medium-term direction; intraday entries still come back to price
- USDX moves almost exactly inversely to EUR/USD, so holding both sides at once quietly doubles your dollar exposure
- 1. What is the US Dollar Index (USDX/DXY)?
- 2. The six component currencies and their weights: Europe is 77.3%
- 3. Reading the level: what does 100 actually mean?
- 4. Four forces that move the dollar index
- 5. How do you read the dollar index? COT, spreads, and direction
- 6. Trading US Dollar Index CFDs with Titan FX
- 7. FAQ: Common questions about the US Dollar Index
- 8. Conclusion: Read the dollar first, then the pair
1. What is the US Dollar Index (USDX/DXY)?
The dollar index is a currency basket index that tracks a weighted average exchange rate for the US dollar against six major currencies. CFD and spot venues generally use the ticker USDX; futures markets call it DXY.
It was created in March 1973, just after the Bretton Woods system collapsed and exchange rates moved from fixed to floating. Once every rate started moving daily, the market needed one standardized number to answer whether the dollar overall was strong or weak.
| Item | Detail |
|---|---|
| Full name | US Dollar Index |
| Tickers | USDX (CFD) / DXY (futures) |
| Start | March 1973 |
| Base value | 100.000 |
| Component currencies | 6 |
| Weighting | Fixed weights set from 1970s trade patterns, geometric average |
| Calculated by | Intercontinental Exchange (ICE) |
| Update frequency | Real time during currency market hours |
How the dollar index is calculated
Put simply: the six exchange rates are each raised to their weight and multiplied together, and because the euro carries the largest weight, EUR/USD has the largest effect on the index. The full formula:
USDX = 50.14348112 × EUR/USD^(-0.576) × USD/JPY^(0.136) × GBP/USD^(-0.119) × USD/CAD^(0.091) × USD/SEK^(0.042) × USD/CHF^(0.036)
The signs on the exponents come from how each pair is quoted. EUR/USD and GBP/USD say how many dollars one unit of the foreign currency buys, so they fall when the dollar strengthens and the exponent is negative; USD/JPY and the rest work the other way. The constant 50.14348112 does one job: it scales the result for March 1973 to exactly 100.
The membership of the basket has not changed since the euro replaced the German mark, French franc and three other European currencies in 1999, and neither have the weights. The next section covers what follows from that. For the live level, see the US Dollar Index quote and chart page.
2. The six component currencies and their weights: Europe is 77.3%
| Currency | Code | Weight | Pair | Notes |
|---|---|---|---|---|
| Euro | EUR | 57.6% | EUR/USD | Largest weight since replacing five European currencies in 1999 |
| Japanese yen | JPY | 13.6% | USD/JPY | Traditional safe-haven currency, driven by Bank of Japan policy |
| Sterling | GBP | 11.9% | GBP/USD | Moves on Bank of England policy and fiscal headlines |
| Canadian dollar | CAD | 9.1% | USD/CAD | A commodity currency, closely tied to crude oil |
| Swedish krona | SEK | 4.2% | USD/SEK | A small, export-driven open economy |
| Swiss franc | CHF | 3.6% | USD/CHF | Safe-haven currency, sensitive to SNB intervention |
Regroup those weights by region and the picture gets much clearer.
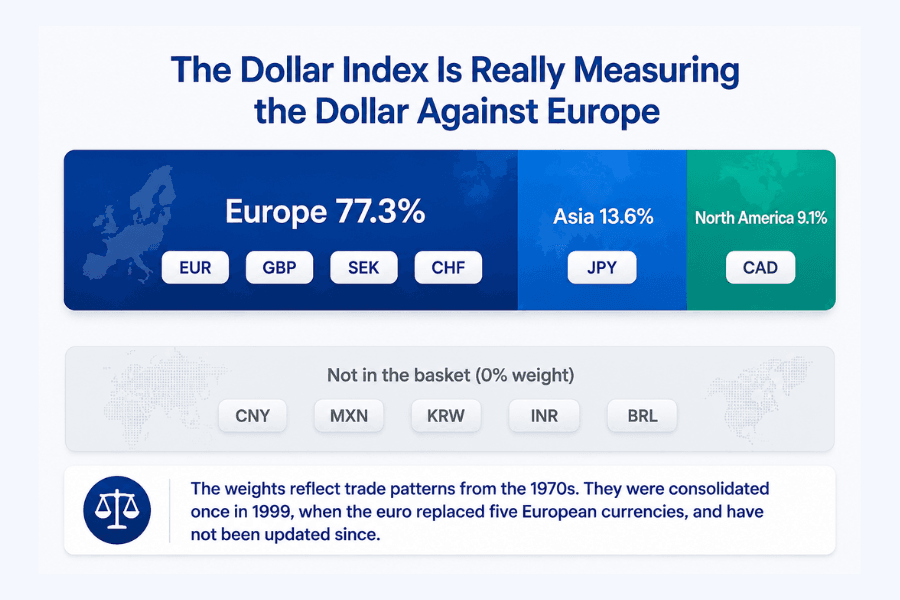
The euro, sterling, the krona and the franc add up to about 77%, the yen contributes 13.6% and the Canadian dollar 9.1%. In other words, what the dollar index mostly measures is the dollar against European currencies, with Japan and Canada in supporting roles.
The absentees matter more. China, Mexico, South Korea, India and Brazil all rank highly in US trade today, and not one of their currencies is in the basket. The reason is straightforward: the weights reflect the trade patterns of the 1970s, and the only change since then was a technical consolidation when the euro was born.
That has two practical consequences:
-
It is close to an inverse of EUR/USD. With the euro at nearly six-tenths of the basket, news out of the eurozone — an ECB rate decision, for instance — moves the dollar index noticeably even when nothing has happened in the US.
-
It says nothing about the dollar against emerging markets. The yuan or the peso can move sharply while the dollar index barely reacts. For a broader read, the Federal Reserve publishes a broad dollar index covering more than twenty currencies; our note on the effective exchange rate goes into that.
3. Reading the level: what does 100 actually mean?
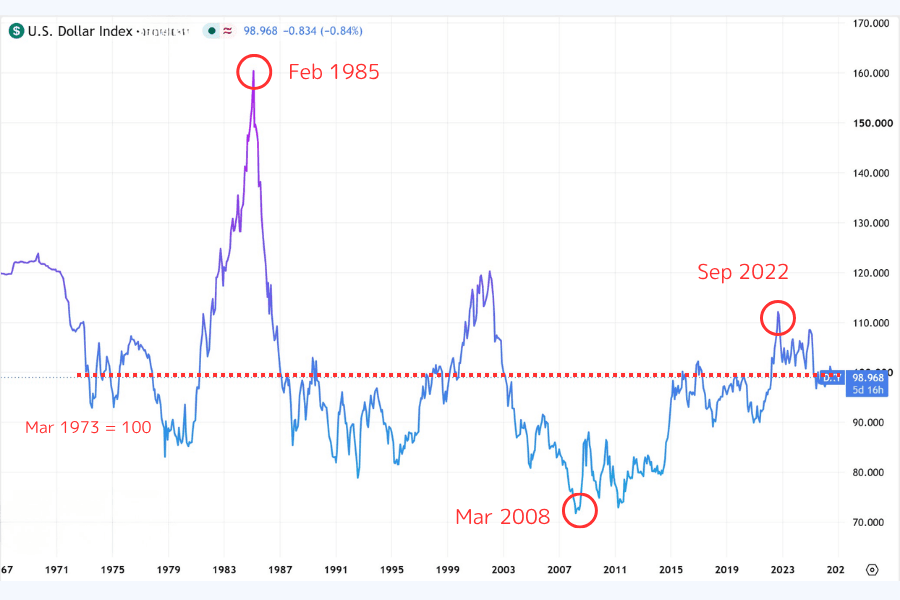
Here is the most common misreading: that 100 divides a strong dollar from a weak one, and anything above it counts as strength.
In fact 100 means one thing only — the same level as March 1973. It is a starting point, not an equilibrium or a fair value of any kind. Judging the dollar means looking at where the index sits inside its own historical range, and which way it is heading.
A few coordinates worth remembering:
-
February 1985: 164.72, the all-time high. The Fed had pushed rates to extraordinary levels to break inflation, and the dollar strengthened far enough to damage US exports. That September, five countries agreed the Plaza Accord and jointly guided the dollar lower; the index roughly halved over the following years.
-
March 2008: about 70.7, the all-time low. Ample dollar liquidity ahead of the financial crisis and concerns about the twin deficits weighed on the currency together.
-
September 2022: 114.78, the highest in about two decades. The Fed ran its steepest hiking cycle since the 1980s while Europe faced an energy crisis and Japan held policy ultra-loose, stretching the policy gap to an extreme.
Step back far enough and one feature stands out: the dollar index runs on long cycles. Moving from a high to a low and back again often takes years, sometimes more than a decade, with sizable counter-moves along the way. That makes it a framework for medium- and long-term direction rather than an intraday signal.
For most of the past decade the index has traded between 90 and 115. Reading today's number against that range tells you far more than measuring it against the 100 line.
4. Four forces that move the dollar index
Fed policy and rate differentials
This is the single biggest factor. When the Federal Reserve raises rates or shrinks its balance sheet, dollar assets offer a better relative return and international capital flows in; cuts and easing do the reverse.
The word that matters is relative. What drives an exchange rate is the rate gap between the US and other economies, plus what the market expects that gap to do next. The absolute level of US rates has already been priced. The 2022 surge was so violent precisely because the Fed hiked fast while the ECB started late and the Bank of Japan did not move at all.
What other central banks do
Because of the weights, an ECB decision moves the dollar index almost as much as a Fed decision does. A hawkish turn in Frankfurt lifts the euro and pulls the index down, even with no fresh news from the US. When the Bank of Japan adjusts yield curve control and the yen jumps, the index falls directly as well.
US economic data
Nonfarm payrolls, CPI, GDP and the ISM manufacturing index cause most of the immediate volatility. What they all really move is the same thing: the market's expectation of the Fed's next step. The significance is therefore never the absolute reading but the gap against what was expected. Release times and consensus figures can be checked in advance on the economic calendar, and nonfarm payrolls is usually the biggest single-day mover.
Safe-haven flows
The dollar is the world's primary safe-haven asset, so war, financial stress and liquidity squeezes tend to push money into it and lift the index.
This force sometimes fights the other three. When the risk event originates in the US — a fiscal standoff, or abrupt shifts in trade policy — safe-haven buying and doubts about the US outlook offset each other, and the index becomes hard to predict. In that situation, cutting position size and waiting for a clearer signal beats guessing the direction.
5. How do you read the dollar index? COT, spreads, and direction
Reading COT positioning for the medium term
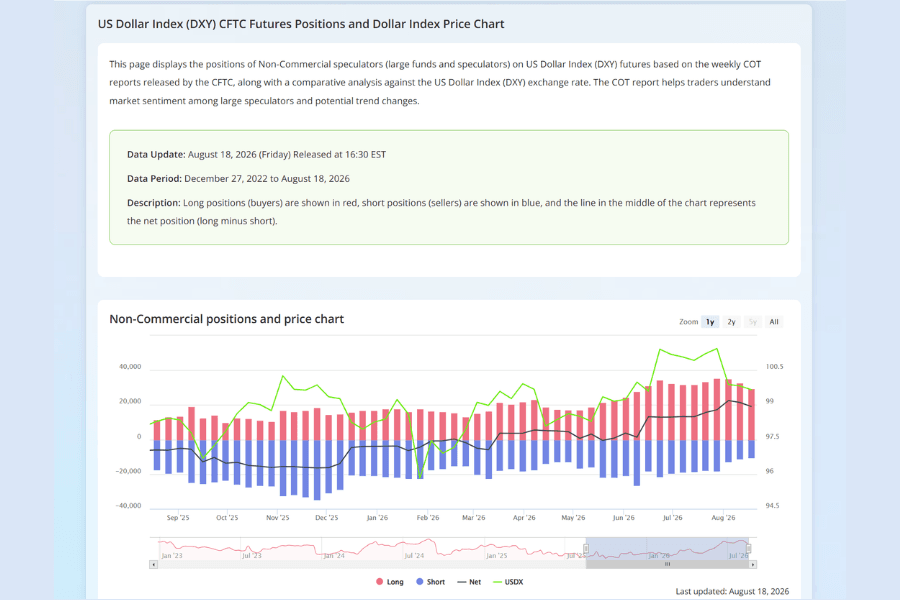
The US Commodity Futures Trading Commission publishes weekly positioning data showing how large speculative institutions are positioned in dollar index futures. The US Dollar Index COT report overlays those positioning changes on the price, so you can see directly whether the two are moving together.
Three things to look for in practice. Net longs rising while the price rises means the trend has money behind it. Net positioning reaching a historical extreme and then rolling over is often an early clue that the trend is turning. And when positioning and price diverge, something other than speculative flow is driving the move, which is a cue to go back and check the fundamentals.
Mind the lag: the report comes out on Friday and reflects Tuesday's positioning. It works as a weekly-timeframe reference, not as a basis for intraday entries.
Using rate spreads to check whether a trend has legs
Since the rate gap is the main driver, tracking the gap itself is the most direct way to verify a move. In practice that usually means the yield spread between ten-year US and German government bonds — a widening spread tends to support the index, a narrowing one to weigh on it.
When price and spread move together, the trend rests on something solid. When the dollar index rallies while the spread narrows, the move is more likely driven by risk sentiment or a specific event, and it tends to be less durable than a rate-driven trend.
Using it to confirm direction on FX positions
Plenty of currency traders never trade the index itself and use it as a filter instead: establish the dollar's own direction first, then decide which pair to take. When the index is trending up, look for opportunities long the dollar; when it stalls, shift attention to crosses between non-dollar currencies.
There is one trap to avoid. The dollar index is very nearly the mirror of EUR/USD, so going long USDX while shorting EUR/USD is putting on the same position twice. It looks like two diversified trades, but the exposure is doubled. When you hold several dollar-related positions, add them up as one.
6. Trading US Dollar Index CFDs with Titan FX
On the Titan FX platform the dollar index trades under the ticker USDX as a contract for difference, long or short, with no physical delivery involved.
After logging in to MT4 or MT5, right-click in the Market Watch window, choose Symbols, expand the Indices category, find USDX and double-click to add it to your quote list. From there you can open a chart and place an order.
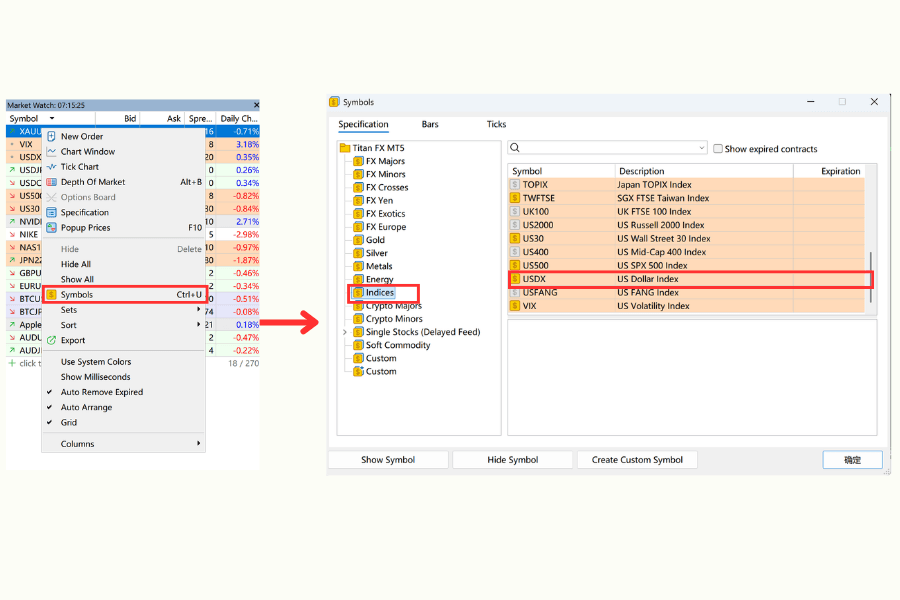
A few things to settle before you trade:
-
Session: USDX CFDs cover the main currency market sessions, Monday to Friday. Liquidity peaks while the European and US sessions overlap, which falls in the evening and small hours in UTC+8. Server time shifts with daylight saving, so check the official trading conditions page for the current schedule.
-
Range: the index typically moves less in a day than a single currency pair, because the six components partly cancel each other out. On rate decision days or major data releases, though, daily moves above 1% are not unusual, so leave room in your stop distance.
-
Leverage and size: the smaller daily range tempts traders to raise leverage, and that is exactly where the risk sits. Keep the risk on any single trade to 1–2% of account equity and work back to position size from there, rather than picking a lot size first and checking the damage afterwards.
-
Holding cost: positions held overnight incur a swap charge, which accumulates on medium- and long-term holds. Build it into the plan before you enter.
Start Trading US Dollar Index CFDs
Trade USDX contracts for difference with Titan FX — long or short, with flexible leverage and competitive spreads, to take a view on the dollar as a whole.
7. FAQ: Common questions about the US Dollar Index
Q1. What counts as a high dollar index? Is anything above 100 a strong dollar?
100 only means the same level as March 1973; it is not a dividing line. Judging high or low means placing the index in its own historical range: the all-time high was 164.72 in 1985, the all-time low about 70.7 in 2008, and most of the past decade has fallen between 90 and 115. Direction and speed of change usually tell you more than the absolute number.
Q2. Are USDX and DXY the same thing?
They refer to the same index and differ only by context. DXY is the contract code for ICE dollar index futures and the form you see most often on charting software; USDX is the ticker many CFD and spot platforms use, including Titan FX. Both track the same currencies and weights, and the price action is identical.
Q3. Why does the dollar index not include the Chinese yuan?
Because the weights reflect the structure of US trade in the 1970s, and the membership of the basket has not been adjusted since the euro replaced five European currencies in 1999. China was not a major trading partner at the time. To see the dollar against emerging market currencies as a group, you need a broader effective exchange rate index.
Q4. How is the dollar index related to EUR/USD?
Very nearly inversely. The euro carries 57.6%, close to six-tenths of the basket, so when the euro rises the index usually falls. That has two implications: eurozone news moves the dollar index directly, and holding a long USDX position alongside a short EUR/USD position doubles up on the same bet while looking like two separate trades.
Q5. How do you use the COT report on the dollar index?
It shows how large speculative institutions are positioned in dollar index futures. When positioning moves with price, the trend usually has support; when net positioning reaches an extreme and turns, that is often an early signal of a reversal. Since the report is published on Friday and reflects Tuesday's positioning, it suits weekly-timeframe reference rather than intraday work.
Q6. What costs should I watch when trading dollar index CFDs?
Mainly the spread, the overnight swap, and commission on some account types. Spreads widen in thin sessions, and swap is settled daily, so on a medium- or long-term hold the financing cost accumulates. Actual figures are the ones published on the official trading conditions page.
Q7. What kind of trader does the dollar index suit?
Traders who follow the macro picture and want to take a view on the dollar as a whole. The fundamentals are clear — the policy gap between central banks plus economic data — and the index moves more gently than a single pair, which suits medium- and long-term trend work. The other common use is not trading it at all, but treating it as a filter for choosing pairs.
Q8. How is the dollar index related to gold?
Inversely, most of the time. Gold is priced in dollars, so a stronger dollar makes it more expensive for buyers holding other currencies and demand comes under pressure; a weaker dollar does the reverse. It is the most frequently cited cross-market relationship there is.
But it is a tendency, not a rule. In an extreme risk-off environment money can flow into the dollar and gold at once and both rise; central bank buying and shifts in real yields can also outweigh the dollar's influence. Treating the dollar index as one variable among several in the gold picture is the sounder approach, and eight key factors influencing gold prices breaks the rest down.
8. Conclusion: Read the dollar first, then the pair
The value of the dollar index is that it compresses information scattered across six currency pairs into one number. A glance tells you whether what you are looking at is a dollar move or a problem specific to one currency — and that judgment changes every decision that follows.
Two things to keep in mind while using it. First, it measures the dollar against six developed-market currencies, roughly 77% of which are European, so it cannot stand in for the dollar against the world. Second, 100 is the 1973 starting point rather than an equilibrium, so any read on high or low has to go back to the historical range.
In practice: build a medium-term view from the policy gap between the Fed and other central banks, check that view against COT positioning and rate spreads, then come back to price for entries and exits. Handling direction and timing separately holds up better than asking one indicator to answer both.
Further Reading
- What Are Stock Indices? Definitions, Types, Calculation & CFD Trading Guide
- What Is the MSCI Index? Index Family, Review Schedule, and Market Impact
- What Is the Dow Jones Industrial Average (US30)? Components & Trading Guide
- What Is the S&P 500 Index (US500)? Components & Trading Guide
- What Is the Nasdaq-100 Index (NAS100)? Components & Trading Guide
Titan FX Trading Strategy Lab. We produce investor-education content covering forex, commodities (crude oil, precious metals, agricultural goods), stock indices, US equities, and digital assets.
Primary Sources (by Category)
- Index provider: General descriptions from Intercontinental Exchange (ICE) of the dollar index component currencies, weights and calculation method
- Official statistics: General descriptions of the Federal Reserve's published dollar exchange rate indexes and broad dollar index
- Positioning data: Publication schedule and category definitions of the CFTC weekly Commitments of Traders report
- Investor education: Regulator materials on CFD leverage, overnight costs and risk management