What Is the Russell 2000 Index (US2000)? Trading Guide
US2000 tracks the performance of America's small-cap stock market, covering approximately 2,000 companies ranked 1,001st to 3,000th by market capitalization within the Russell 3000 Index. These domestically-focused companies span healthcare, financials, industrials, and other diverse sectors, making the index a key barometer for U.S. economic fundamentals and small-business vitality.
For CFD traders, US2000's high volatility and sensitivity to domestic economic cycles offer unique trading opportunities distinct from large-cap indices. From swing trading around Federal Reserve rate decisions to capturing small-cap rotation during economic recoveries, US2000 deserves a place on every index trader's watchlist. This article covers index composition, historical price action, key drivers, and practical trading strategies for US2000.
- 1. What Is the Russell 2000 Index (US2000)?
- 2. Constituent Structure and Sector Breakdown
- 3. Price History: 2020-2025 in Review
- 4. Key Factors That Move the Price
- 5. Advantages and Risks
- 6. Trading Strategies
- 7. How to Trade US2000 on Titan FX
- 8. Key Considerations for New Traders
- 9. Frequently Asked Questions
What Is the Russell 2000 Index (US2000)?
The Russell 2000 Index was established in 1984 by the Frank Russell Company (now FTSE Russell) as a market-cap-weighted index measuring the overall performance of U.S. small-cap stocks. It selects companies ranked 1,001st to 3,000th by market capitalization within the Russell 3000 Index, specifically tracking the small-cap segment of the market.
| Item | Details |
|---|---|
| Official Name | Russell 2000 Index |
| Trading Symbol | US2000 (CFD) / RUT (Cash Index) |
| Year Established | 1984 |
| Number of Constituents | Approximately 2,000 (adjusted annually) |
| Weighting Method | Free-Float Market-Cap Weighted |
| Rebalancing | Annual reconstitution in June |
| Base Currency | USD |
| Benchmark ETF | IWM (iShares Russell 2000 ETF, AUM exceeding $60 billion) |
How US2000 Is Calculated
US2000 is calculated by dividing the total free-float market capitalization of all constituent stocks by an index divisor.
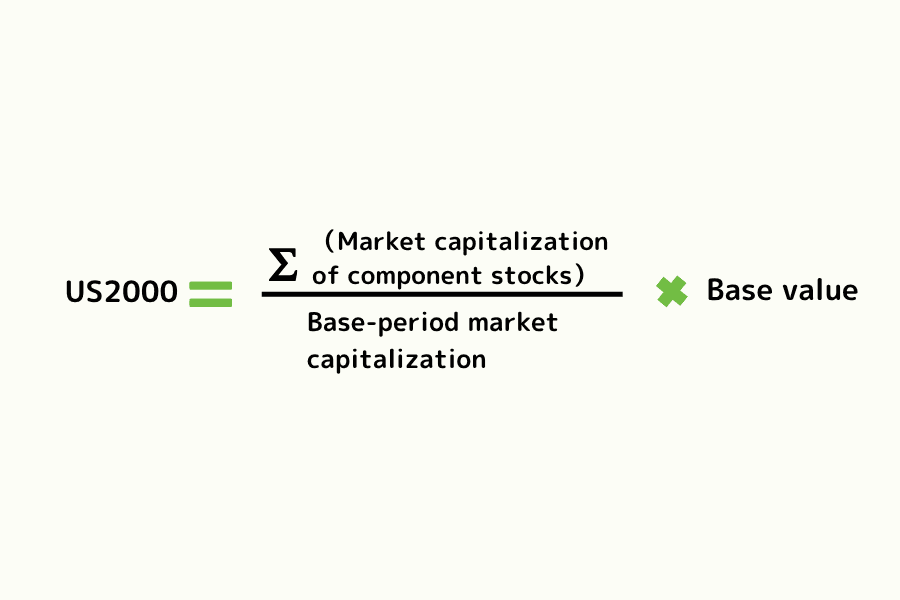
The index divisor is adjusted whenever constituent changes, stock splits, or other corporate actions occur to maintain index continuity. Unlike the Dow Jones Industrial Average (US30), which uses price weighting, US2000's market-cap weighting gives larger small-cap companies a greater influence on index movements.
Comparison with Other Russell Indices
The Russell index family collectively provides a comprehensive picture of the U.S. stock market:
| Index Name | Constituents | Market Cap Range | Representation |
|---|---|---|---|
| Russell 3000 | ~3,000 | Full market | Covers approximately 98% of U.S. stock market capitalization |
| Russell 1000 | ~1,000 | Large-cap | Top 1,000 companies by market cap |
| Russell 2000 | ~2,000 | Small-cap | Companies ranked 1,001-3,000 by market cap |
Compared to the S&P 500 (US500) and Nasdaq-100 (NAS100), US2000 constituents derive a larger share of revenue domestically, resulting in higher sensitivity to the U.S. domestic economy and greater volatility.
Constituent Structure and Sector Breakdown
As of Q1 2025, US2000 comprises approximately 1,983 small-cap companies with an average market capitalization of roughly $4.82 billion and a median market cap of approximately $960 million. These companies span a wide range of sectors including healthcare, financials, and industrials.
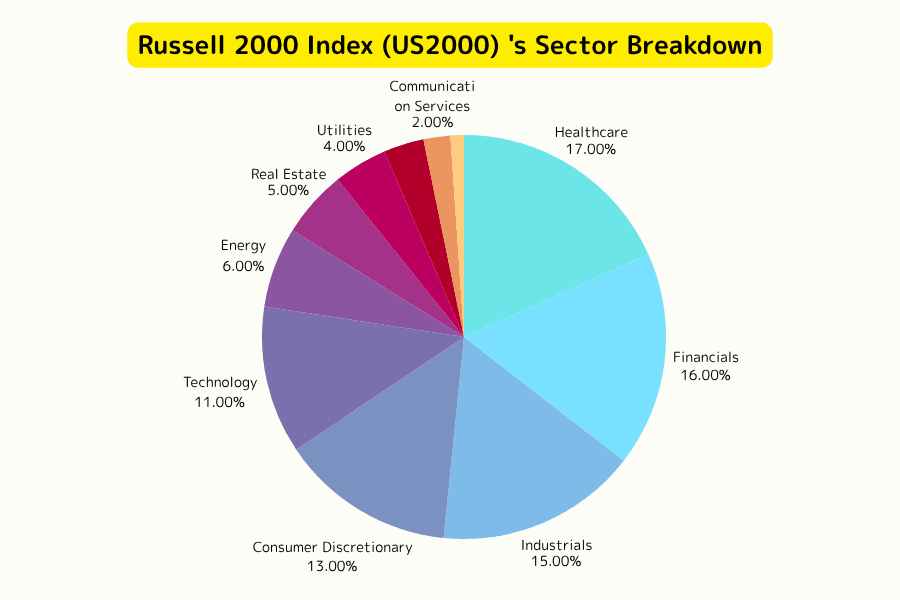
Sector Distribution
| Sector | Weight (approx.) | Representative Companies |
|---|---|---|
| Healthcare | ~17% | Insmed (INSM), Summit Therapeutics (SMMT) |
| Financials | ~16% | Piper Sandler, Prosperity Bancshares |
| Industrials | ~15% | Comfort Systems USA (FIX), Granite Construction |
| Consumer Discretionary | ~13% | Crocs, Winmark |
| Information Technology | ~11% | Super Micro Computer (SMCI), MicroStrategy (MSTR) |
| Energy | ~6% | CNX Resources, Magnolia Oil & Gas |
| Real Estate | ~5% | Innovative Industrial Properties, Equity Commonwealth |
| Utilities | ~4% | Avista, South Jersey Industries |
| Consumer Staples | ~3% | Sprouts Farmers Market (SFM), Weis Markets |
| Communication Services | ~2% | Shenandoah Telecommunications, Iridium Communications |
| Materials | ~1% | Carpenter Technology, Materion Corporation |
Weight data synthesized from iShares IWM ETF portfolio reports and FTSE Russell public data (Q1 2025). Representative companies are selected from each sector's top-weighted holdings for illustration purposes.
Sector Characteristics
Unlike NAS100, where technology stocks account for over 50% of the index, US2000 features a more balanced sector distribution. Healthcare and industrials dominate, while technology and financials provide diversification. This structure reflects two key characteristics of small-cap stocks: growth potential (medical innovation, technology applications) and domestic orientation (industrials, consumer, financial services).
The annual June rebalancing is a significant event for US2000, involving substantial constituent additions and deletions that can trigger short-term abnormal volatility.
Price History: 2020-2025 in Review
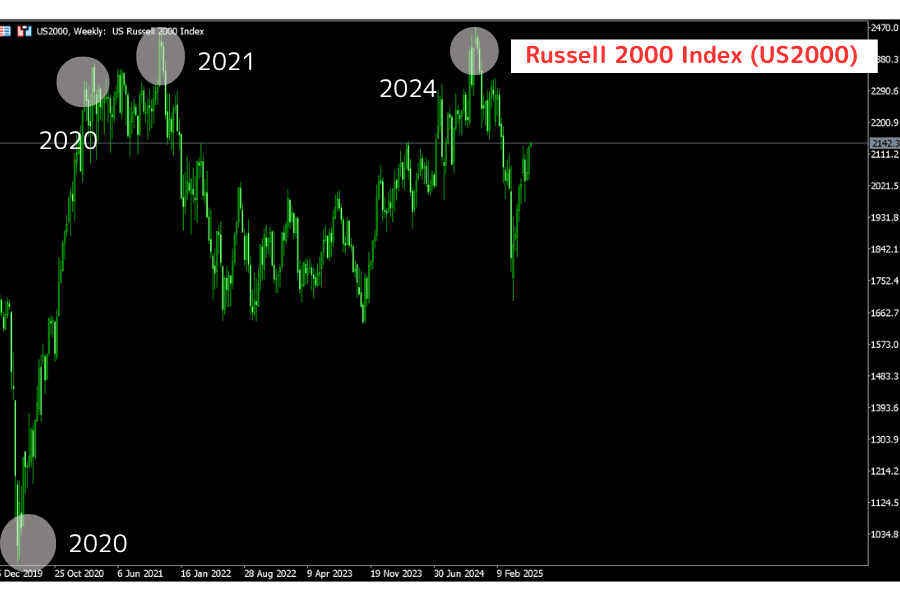
US2000's price action over the past six years vividly demonstrates the high-volatility characteristics of small-cap stocks and their strong reaction to macroeconomic conditions.
2020: Pandemic Crash and Epic Rebound
During the initial COVID-19 outbreak, US2000 plunged over 40% in March 2020, with declines far exceeding those of large-cap indices. However, massive fiscal stimulus measures including the CARES Act, combined with the Federal Reserve's zero interest rate policy and quantitative easing, fueled a strong small-cap recovery in the second half. US2000 surged over 30% in Q4 alone, showcasing the explosive power of small-caps during early recovery phases.
2021: The Biggest Beneficiary of Economic Reopening
Vaccine rollout and full economic reopening provided major tailwinds for domestically-focused small-caps. Recovery in retail, dining, and travel services drove standout performance in consumer-oriented small-caps, with US2000 reaching multiple all-time highs during the year. Innovative small-caps in the healthcare and technology sectors also performed strongly.
2022: The Heavy Toll of Rate Hikes (-21%)
The Fed launched an aggressive rate-hiking cycle, raising rates by 425 basis points over the year. Small businesses, highly sensitive to financing costs, saw borrowing costs surge, directly squeezing profit margins and expansion plans. US2000 fell approximately 21% for the year, with particularly intense mid-year volatility. Regional banks and retail-sector small-caps faced heavy selling pressure.
2023: Resilience Amid Headwinds
The sustained high-rate environment continued to test small businesses, but breakthroughs in healthcare drug development and consumer product innovation provided structural support. US2000 maintained relative stability through the volatility, underperforming the large-cap tech-driven NAS100 rally but avoiding further significant declines.
2024: Rate Cut Expectations and Small-Cap Rotation
The Fed's rate-hiking cycle peaked and domestic market conditions improved, injecting recovery momentum into small-caps. Strong performance in technology and industrial sectors drove US2000 to near all-time highs by year-end. A brief but notable institutional rotation from large-caps to small-caps during summer 2024 temporarily amplified index gains.
2025 Year-to-Date: Tariffs and Policy Uncertainty
In the first half of 2025, U.S. economic data and geopolitical factors, including U.S.-China trade negotiations and repeated tariff policy adjustments, brought significant volatility. Domestically-oriented small-caps held steady, supported by retail and service sector recovery, but elevated rate expectations and tariff policy uncertainty created near-term headwinds.
Key Factors That Move the Price
Macroeconomic Environment
US2000 is highly sensitive to the U.S. domestic economy, showing the strongest correlation with domestic economic conditions among the four major U.S. stock indices:
- GDP Growth: Economic expansion directly boosts small-business revenues, pushing the index higher
- CPI (Consumer Price Index): Inflation data influences Fed rate policy direction, which in turn affects small-cap financing costs
- Nonfarm Payrolls (NFP): A strong labor market benefits consumer and service-sector small-caps, though overheating may delay rate cuts
- Unemployment Rate: Reflects labor market health, directly impacting consumer spending power and small-business operations
Monetary Policy
Federal Reserve (FOMC) rate decisions have an outsized impact on US2000. Small businesses rely more heavily on bank loans and floating-rate financing than large corporations:
- Rate cuts / easing: Lower financing costs stimulate small-business investment and expansion, strongly bullish for US2000
- Rate hikes / tightening: Higher borrowing costs squeeze margins, with small-caps bearing the brunt
- Quantitative easing (QE) / tightening (QT): Directly affects market liquidity and risk appetite
The -21% decline in 2022 and the rebound driven by rate-cut expectations in 2024 clearly demonstrate the outsized influence of monetary policy on US2000.
Sector and Company-Level Factors
- Healthcare innovation: Drug development breakthroughs at biotech companies (e.g., Insmed's new drug approvals) can drive related sector gains
- Technology adoption: AI and automation technology applications in smaller enterprises (e.g., Super Micro Computer benefiting from AI server demand) drive tech-sector performance
- M&A activity: Small-caps are prime acquisition targets, and active M&A markets push individual stock premiums higher, indirectly boosting the index
- Earnings volatility: Small companies tend to show higher quarterly earnings volatility, with larger beats and misses compared to large-caps
Geopolitics and Market Sentiment
- Tariff policy: The 2025 tariff discussions weighed on investor sentiment, particularly affecting export-oriented small-caps in industrial and materials sectors
- Risk appetite: Rising risk appetite (e.g., the 2024 recovery phase) attracts capital flows into small-caps, lifting the index; risk-off sentiment triggers selling
- Large-to-small-cap rotation: Institutional capital rotation between large-caps and small-caps is a significant driver of US2000's short-term price action
Use Titan FX's Economic Calendar to track all major economic data releases and market expectations in real time.
Advantages and Risks
Advantages
-
Direct exposure to U.S. domestic demand: US2000 constituents derive the majority of their revenue domestically, making the index less affected by currency fluctuations and overseas market changes. It's an ideal instrument for investing in U.S. domestic economic growth.
-
High growth potential: Small-caps are in the earlier stages of the corporate lifecycle, with greater revenue growth potential. During economic recoveries, US2000 tends to outperform large-cap indices.
-
Sector diversification: Unlike the tech-heavy NAS100, US2000's sector distribution is more balanced, resulting in relatively lower systemic risk from any single sector.
-
M&A premium opportunities: Small-caps are primary M&A targets, and constituent acquisitions typically come with significant stock price premiums.
-
Lower correlation with large-caps: US2000 has relatively lower short-term correlation with US500 and NAS100, providing portfolio diversification benefits.
Risks
-
High volatility: US2000's daily price swings exceed US500 and US30, with 2-3% single-day moves not uncommon.
-
Extreme interest rate sensitivity: Small businesses are highly dependent on bank financing. Fed rate-hiking cycles impact US2000 far more severely than large-cap indices.
-
Liquidity risk: Compared to large-cap indices, individual US2000 constituents have lower liquidity, and bid-ask spreads may widen during market panic.
-
Earnings uncertainty: Small companies have lower financial transparency and less analyst coverage than large-caps, creating higher information asymmetry risk.
-
Recession vulnerability: During economic downturns, small businesses have weaker risk resilience, with higher rates of bankruptcy and delisting compared to large enterprises.
Trading Strategies
Technical Analysis Tools (Titan FX Suite)
Titan FX provides a range of analytical tools to help traders assess US2000's technical landscape:
- Support & Resistance: Identify key US2000 price levels and assess breakout or bounce probabilities
- Order Book (Position Info): Monitor other traders' pending order distribution and long/short ratios
- Trend Analysis: Determine whether US2000 is in an uptrend, downtrend, or range-bound phase
- RSI Analysis: Identify overbought or oversold conditions to help time potential reversals
- Volatility Heatmap: Understand US2000's volatility patterns across different trading sessions
- % Change Ranking: Compare US2000's real-time performance against other indices
Trading Approaches: Trend, Rotation, Event-Driven
Trend Following
When the Fed's policy direction is clear (e.g., a sustained rate-cutting cycle), US2000 tends to form multi-week to multi-month trends. Use daily or 4-hour moving averages to confirm direction, entering on pullbacks to key support levels or moving averages. The small-cap rotation driven by rate-cut expectations in the second half of 2024 is a textbook example.
Large-to-Small-Cap Rotation
When market outlook turns optimistic and institutional capital begins shifting from large-cap tech to value/small-cap sectors, US2000 typically outperforms NAS100 and US500 significantly in the short term. Monitoring the US2000/US500 ratio chart can help capture the onset of rotation moves.
Event-Driven Trading
Fed rate decisions, nonfarm payrolls, and CPI releases can all trigger 2-4% single-day moves in US2000. Since small-caps are more sensitive to these data points than large-caps, position sizing during events should be more conservative -- consider reducing standard positions by half or more, with wider stop-loss distances.
How to Trade US2000 on Titan FX
On the Titan FX platform, the Russell 2000 Index trades under the symbol US2000 as a CFD (Contract for Difference). You can also trade directly in your browser using WebTrader.
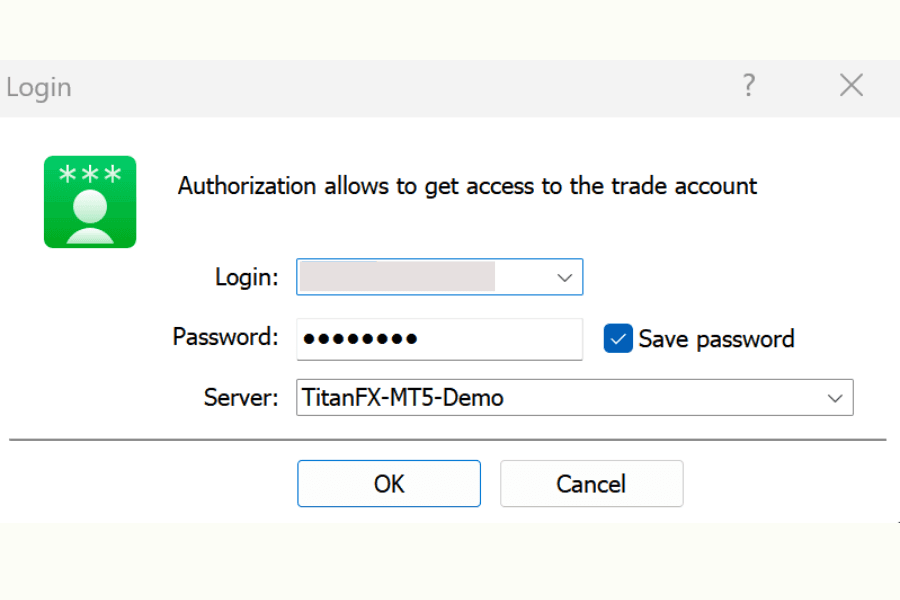
Step 1: Log into Your Trading Account
Open a Titan FX trading account (Zero Standard or Zero Blade), complete your deposit, then download the MT4 or MT5 platform and log in with your credentials.
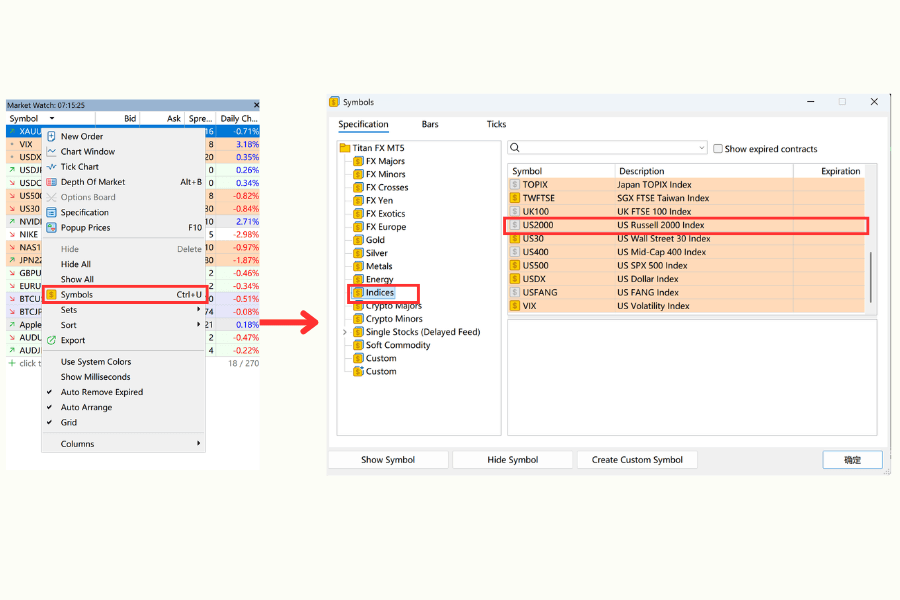
Step 2: Add US2000 to Your Watchlist
Right-click in the Market Watch window, select "Symbols," expand the "Indices" category, and double-click US2000 to add it to your quote list.
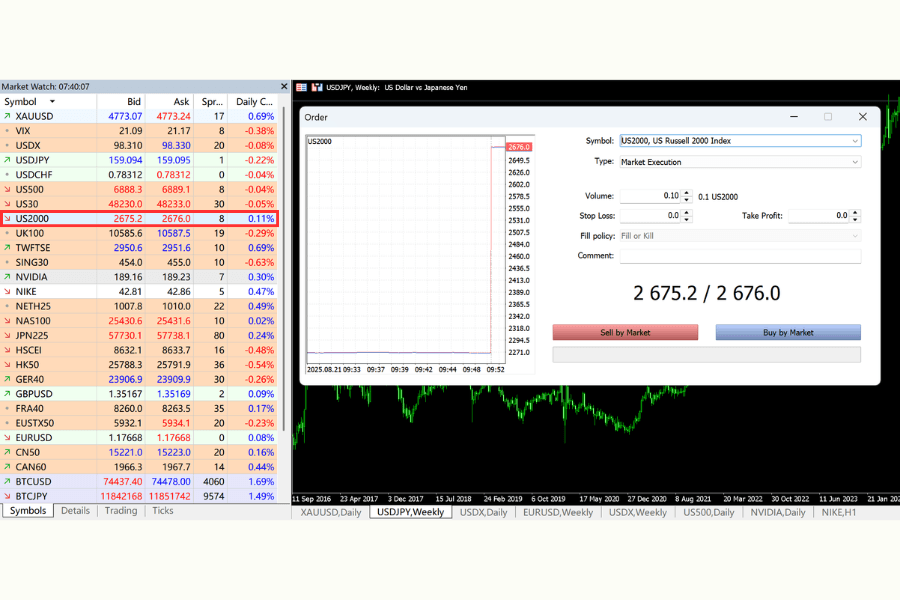
Step 3: Start Trading
Double-click the US2000 quote or open a chart to access the order window. Enter your lot size, choose buy or sell, set your stop-loss and take-profit levels, then execute.
Trading Hours (MT4/MT5 Server Time GMT+3):
| Session | Winter Time (GMT+2) | Summer Time (GMT+3) |
|---|---|---|
| Main Trading Session | 01:00 - 23:59 | 01:00 - 23:15 & 23:30 - 23:59 |
| Friday Close | 23:55 | 23:55 |
For the latest trading conditions and live prices, see the US2000 product page.
Start Trading US2000 Trade US2000 CFDs on Titan FX with up to 500x leverage, tight spreads, and the flexibility to go long or short. Index CFD trading is available on Zero Standard and Zero Blade accounts (not available on Zero Micro accounts).
Key Considerations for New Traders
Leverage and Risk Management
Titan FX offers up to 500x leverage (Zero Standard / Zero Blade accounts). Given US2000's higher daily volatility compared to large-cap indices, risk management is critical when trading with high leverage:
- Keep risk per trade within 1-2% of account equity
- Given US2000's elevated volatility, avoid setting stop-losses too tight to prevent being stopped out during normal price fluctuations
- Use Titan FX's Margin Calculator to determine required margin and appropriate position sizing
Small-Cap Liquidity Characteristics
US2000's overall liquidity is lower than US500 and NAS100. Exercise extra caution in these scenarios:
- Bid-ask spreads may temporarily widen around major economic data releases
- Liquidity drops noticeably during pre-market and after-hours trading sessions
- Some constituents may experience abnormal volatility during the annual June Russell Index rebalancing
Understanding the Differences from Large-Cap Indices
US2000 is not simply a smaller version of US500. Its sector composition, price drivers, and trading rhythm are distinctly different:
- Large-cap tech earnings have limited direct impact on US2000; consumer, industrial, and regional banking data matter more
- In "Risk-On" environments, US2000 tends to outperform large-cap indices
- In "Risk-Off" environments, US2000 typically declines more steeply
Impact of Fed Rate Decisions
The FOMC rate decision takes place 8 times per year and is the single most important scheduled event for US2000. Since small-caps are more sensitive to rate changes than large-caps, the 30 minutes surrounding the announcement represent the period of highest volatility concentration. Less experienced traders may want to consider stepping aside during this window.
Frequently Asked Questions
How does the Russell 2000 differ from other major U.S. indices?
| Index | Constituents | Weighting | Sector Profile | Volatility | Titan FX Symbol |
|---|---|---|---|---|---|
| US2000 (Russell 2000) | ~2,000 | Market-cap weighted | Small-cap focus, domestic orientation, balanced sectors | High | US2000 |
| NAS100 (Nasdaq-100) | 100 | Market-cap weighted | Tech stocks >50%, excludes financials | High | NAS100 |
| US500 (S&P 500) | 500 | Market-cap weighted | Balanced sectors including financials, healthcare | Medium | US500 |
| US30 (Dow Jones) | 30 | Price weighted | Industrials and financial blue-chips | Medium-Low | US30 |
US2000 focuses on the small-cap segment, suitable for traders with a bullish view on U.S. domestic demand. NAS100 concentrates on tech growth stocks, US500 offers balanced allocation, and US30 emphasizes traditional blue-chip names.
Does the US2000 CFD have an expiration date?
No. Titan FX's US2000 CFD is a spot contract with no expiration, allowing indefinite holding or short-term trading without rollover concerns. Overnight positions incur Swap charges. Check the latest rates on the Swap Calendar.
When is the best time to trade US2000?
The following scenarios typically favor directional trades on US2000:
- Early economic recovery: Small-caps tend to outperform large-caps during the recovery phase
- Start of a rate-cutting cycle: Lower financing costs directly benefit small businesses
- Large-to-small-cap rotation: When institutional capital shifts from large-cap tech to value/small-cap sectors
- Rising risk appetite: Optimistic market sentiment drives capital toward higher-beta small-caps
Conversely, during rate-hiking cycles, heightened recession concerns, or escalating geopolitical risks, careful position management or short strategies may be warranted.
Is there a correlation between US2000 and the U.S. Dollar Index?
The relationship between US2000 and the U.S. Dollar Index (USDX) is nuanced. Since US2000 constituents derive most revenue domestically, dollar strength has less direct negative impact on their earnings compared to large multinationals with significant overseas revenue. However, a stronger dollar typically signals Fed tightening, and tight monetary policy hits small-cap financing costs particularly hard. Overall, US2000 and USDX show a moderate negative correlation.
What costs are involved in trading US2000?
The main costs in CFD trading include the spread (bid-ask difference), overnight interest (Swap), and potentially commissions. US2000 spread levels and detailed trading conditions are available on the Titan FX website. Overnight positions incur Swap charges, with the latest rates available on the Swap Calendar. Additionally, index CFDs may involve dividend adjustments -- when constituent stocks go ex-dividend, corresponding debits or credits are applied to your account.
Summary
US2000 is a critical gauge of the U.S. small-cap market and domestic economic health, with approximately 2,000 constituents spanning sectors from healthcare innovation to industrial manufacturing. Compared to large-cap indices, US2000 offers higher growth potential and volatility, with heightened sensitivity to Fed rate policy and domestic economic data.
Mastering macroeconomic cycles, tracking Fed policy direction, monitoring large-to-small-cap rotation signals, and leveraging technical analysis tools for entry and exit timing form the fundamental framework for trading US2000.