 Home
Home- Investment Guide: Strategies for Stocks, Forex, and Metals
- Counter-Trend Trading: Strategies, Risks, and Forex Tips
Counter-Trend Trading: Strategies, Risks, and Forex Tips
Counter-trend trading is a strategy of entering against the prevailing market trend—selling in uptrends and buying in downtrends—and works best in range-bound markets or at trend reversals.
Rather than riding the trend, counter-trend trading means calmly positioning against an overheated move — it can capture profits in range-bound markets, but it tests a trader's judgment on timing and risk control.
This article explores the methods and precautions for effective counter-trend trading in forex.
- Counter-trend trading goes against the market: sell in uptrends, buy in downtrends
- It suits range-bound markets and reversals; losses grow fast if the trend persists
- Use RSI, Stochastics, CCI, Bollinger Bands, and MACD to spot reversals
- Set clear stop-losses and enter on analysis, not emotion
- Beginners should master trend-following first
- 1. What Is Counter-Trend Trading
- 2. Differences Between Counter-Trend and Trend-Following Trading
- 3. Advantages and Disadvantages of Counter-Trend Trading
- 4. How to Effectively Use Counter-Trend Trading
- 5. Using Technical Indicators for Counter-Trend Trading
- 6. Precautions for Entering Counter-Trend Trades
- 7. Counter-Trend Trading Q&A
- 8. Summary
1. What Is Counter-Trend Trading
Counter-trend trading refers to a strategy where trades are placed against the current market trend. In forex, this means taking positions opposite to the dominant price movement:
- During an uptrend: Sell
- During a downtrend: Buy
If timed correctly—such as at a trend reversal or short-term pullback—this approach can yield profits. However, since it goes against the trend, losses can escalate quickly if the trend persists, making it a high-risk strategy.
2. Differences Between Counter-Trend and Trend-Following Trading
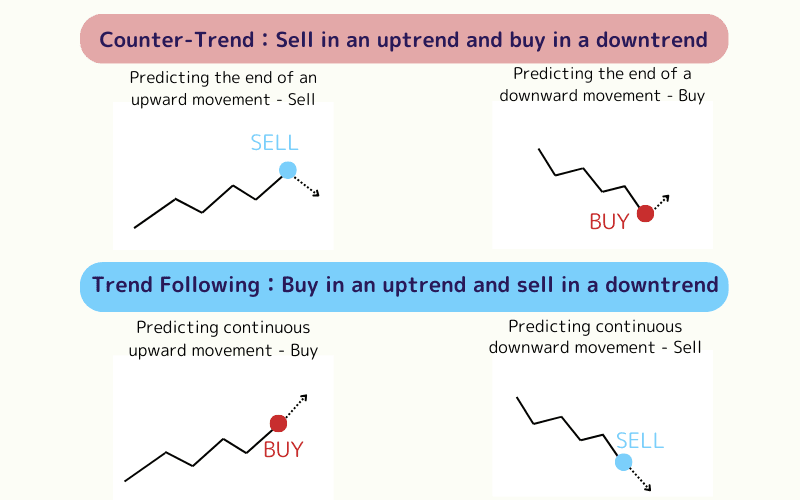
Trend-following trading aligns with the market’s direction:
- Uptrend: Buy
- Downtrend: Sell
Forex trends often persist once established, making trend-following a widely preferred method. In contrast, counter-trend trading shines in range-bound markets or at potential reversal points. Adapting between these strategies based on market conditions and timeframes is key to maximizing returns.
| Strategy | Definition | Best Suited For |
|---|---|---|
| Trend-Following | Trading with the trend | Trending markets |
| Counter-Trend | Trading against the trend | Range-bound or reversals |
3. Advantages and Disadvantages of Counter-Trend Trading
Advantages
The primary benefit of counter-trend trading is its potential for high returns. Successfully identifying the end of a trend and entering against it can capture the initial move of a reversal, leading to substantial profits.
Disadvantages
However, if the trend continues after entry, losses can mount rapidly. Without timely stop-loss measures, counter-trend trading carries significant risk, requiring careful execution.
4. How to Effectively Use Counter-Trend Trading
In forex, counter-trend opportunities arise in specific scenarios:
- Targeting key speeches by influential figures
- Trading range-bound markets
- Capitalizing on pullbacks
Targeting Key Speeches
"Key speeches" refer to statements by individuals with significant influence over a country’s monetary policy or economy, such as central bank governors or finance ministers.
In the US and Europe, notable figures include:
- FRB (Federal Reserve) Chair and Governors
- ECB (European Central Bank) President and Council Members
- Treasury Secretaries or Finance Ministers
Their statements can shift markets based on tone and content:
| Speech Content | Policy Rate | Currency Value |
|---|---|---|
| Optimistic economic outlook | Increase | Increase |
| Pessimistic economic outlook | Decrease | Decrease |
| Prices "above target" | Increase | Increase |
| Prices "below target" | Decrease | Decrease |
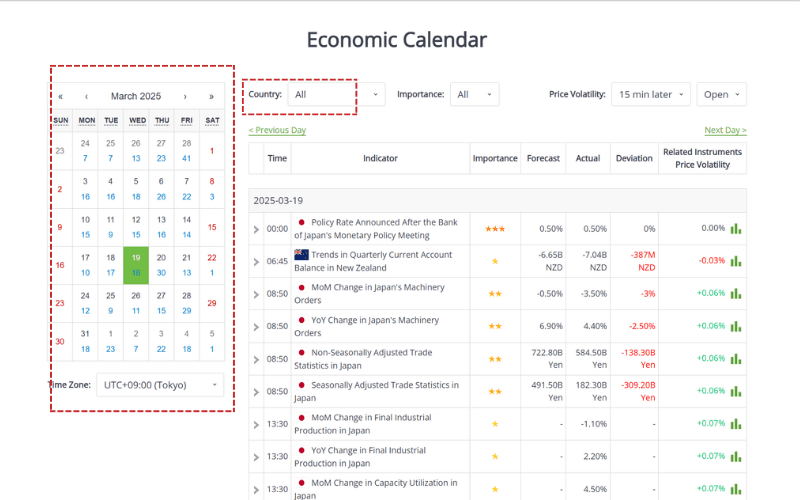
Anticipating a speech that could reverse the trend allows for strategic counter-trend positioning. Checking market expectations against outcomes is crucial.
Titan FX offers an Economic Calendar to track indicator significance, forecasts, and past results, with filters for date and region.
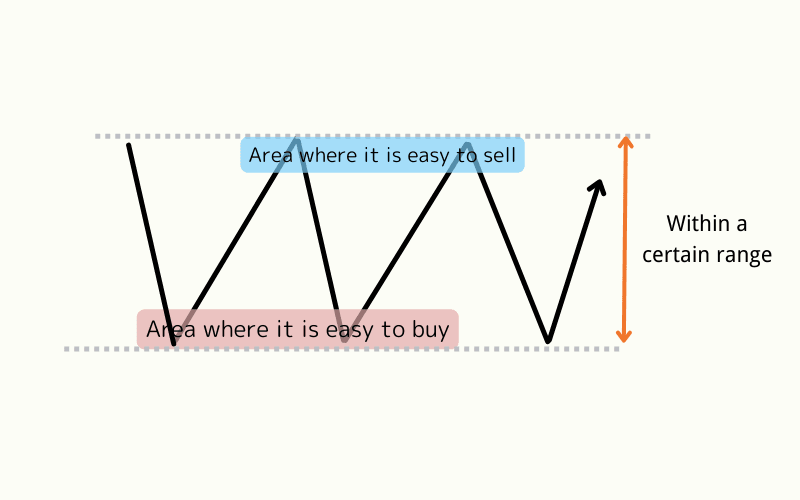
Trading Range-Bound Markets
A range-bound market occurs when prices fluctuate within a defined band. At the upper boundary, selling pressure often emerges; at the lower boundary, buying support kicks in. Trading against the trend near these "hard-to-break" levels—selling at resistance or buying at support—can be effective.
Capitalizing on Pullbacks
Pullbacks mark a temporary reversal within a broader trend (e.g., a bounce in a downtrend). While "buying the dip" or "selling the rally" aligns with the overall trend, these short-term moves are counter-trend at specific entry points, offering quick profit opportunities.
5. Using Technical Indicators for Counter-Trend Trading
Counter-trend trading often relies on technical indicators to predict potential trend reversals. This section introduces methods using key indicators—RSI, Stochastic , CCI, Bollinger Bands, and MACD—for effective counter-trend strategies.
- RSI Counter-Trend Method
- Stochastic Counter-Trend Method
- CCI Counter-Trend Method
- Bollinger Bands Counter-Trend Method
- MACD Counter-Trend Method
RSI Counter-Trend Method
RSI (Relative Strength Index) measures market momentum by comparing average gains to losses over a period, identifying overbought or oversold conditions. Common thresholds include:
- RSI > 70: Overbought—prices may pull back or decline, signaling a potential sell.
- RSI < 30: Oversold—prices may rebound or rise, signaling a potential buy.
- RSI Divergence: When prices hit a new high but RSI doesn’t, it may indicate a reversal.
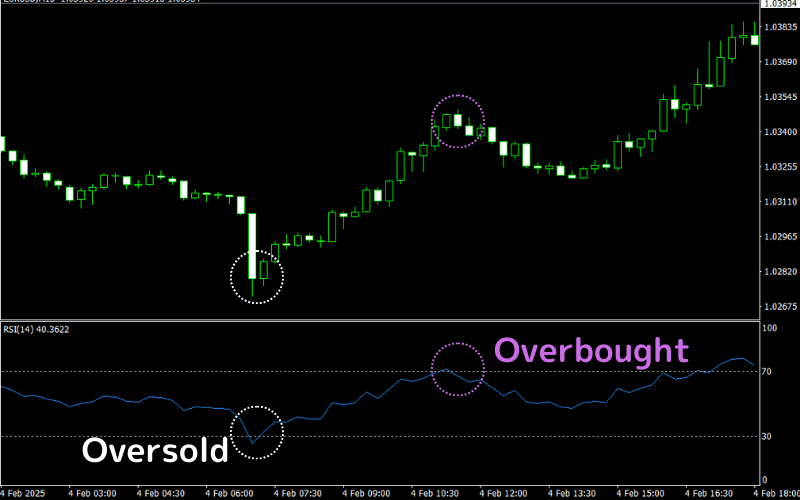
For example, an overbought RSI followed by a price drop, or an oversold RSI followed by a rally, can guide counter-trend entries.
Extended Reading: RSI Basics
Stochastic Counter-Trend Method
The Stochastic Oscillator, consisting of %K and %D lines, gauges overbought and oversold levels by comparing current prices to a recent range (0–100 scale). Key signals include:
| Signal | Description |
|---|---|
| %K > 80 | Overbought—prices may decline, consider selling. |
| %K < 20 | Oversold—prices may rise, consider buying. |
| %K/%D Crossover | %K crossing above %D signals a buy; below %D signals a sell. |
Divergence: If prices hit a new high or low but Stochastic doesn’t follow, it may hint at a reversal.
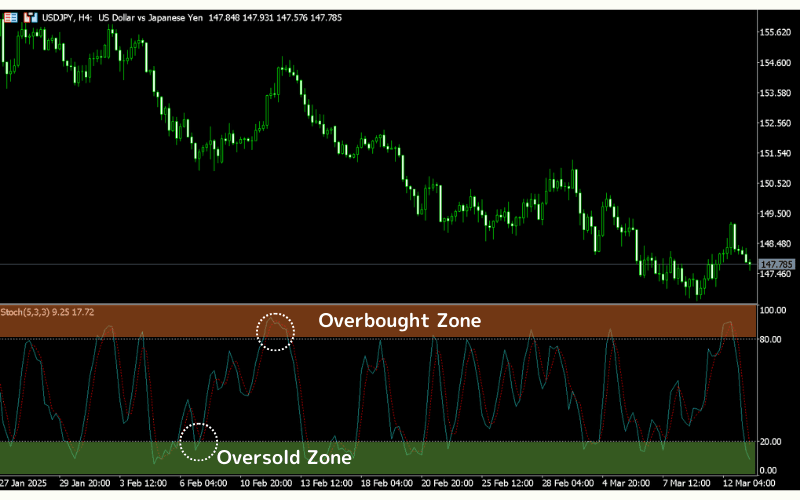
For instance, %K dropping below %D above 80 often precedes a downturn. However, frequent signals can lead to false positives.
Extended Reading: Stochastic Basics
CCI Counter-Trend Method
CCI (Commodity Channel Index) measures how far prices deviate from their statistical mean, highlighting overbought or oversold conditions.
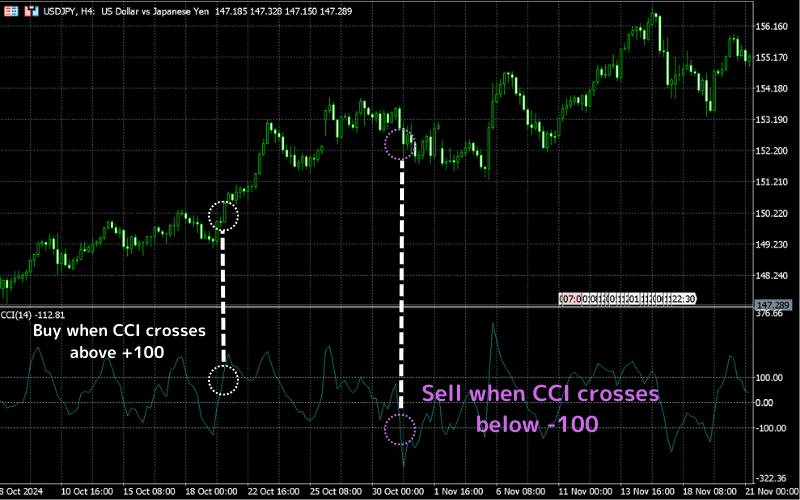
Key levels include:
| Signal | Description |
|---|---|
| CCI > +100 | Overbought—prices may fall, consider selling. |
| CCI < -100 | Oversold—prices may rise, consider buying. |
| CCI Zero-Line Cross | Crossing above zero signals a buy; below zero signals a sell. |
In volatile markets, CCI might spike beyond ±200, indicating extreme conditions—best to wait rather than trade. Unlike most oscillators, CCI can also support trend-following strategies.
Extended Reading: CCI Basics
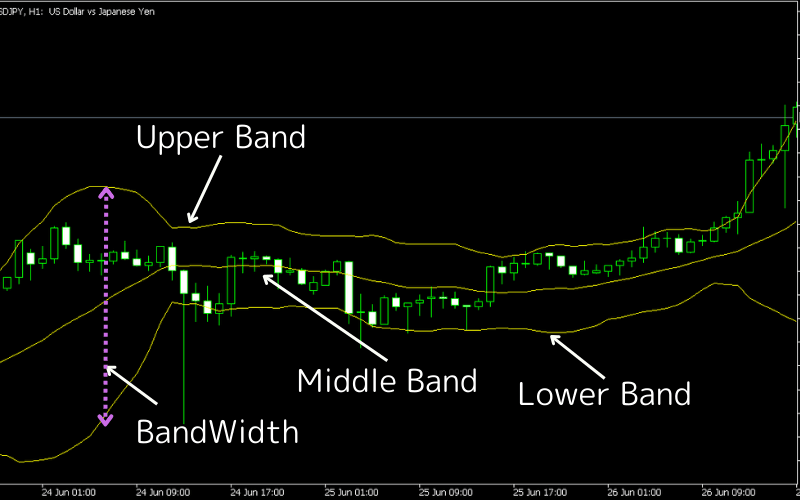
Bollinger Bands Counter-Trend Method
Bollinger Bands use a simple moving average (SMA) and standard deviations to define a price range, signaling overbought or oversold states.
When prices hit the upper band, selling may be warranted; at the lower band, buying could be considered. However, if prices break and trend beyond the bands, counter-trend signals may fail.
To improve accuracy, watch for band "expansion" (rising volatility) or "squeeze" (low volatility before a breakout). A narrowing band often precedes significant price moves.
Extended Reading: What Are Bollinger Bands
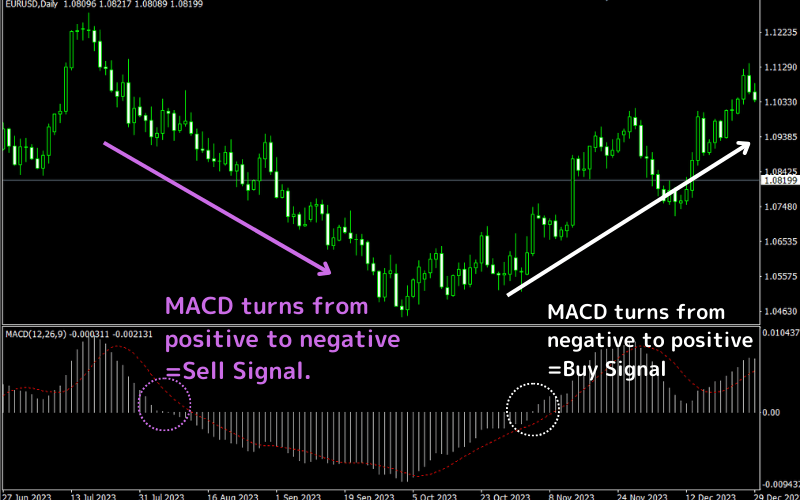
MACD Counter-Trend Method
On MT4/MT5, MACD (Moving Average Convergence Divergence) appears as a histogram and signal line. Key signals include:
| Crossover Type | Description |
|---|---|
| Golden Cross | Histogram shifts from negative to positive (fast line crosses above signal line), signaling a buy as momentum builds. |
| Death Cross | Histogram shifts from positive to negative (fast line crosses below signal line), signaling a sell as momentum weakens. |
Crossovers mark trend shifts, offering counter-trend entry points. A histogram at zero during a crossover can refine timing.
Extended Reading: MACD Basics
6. Precautions for Entering Counter-Trend Trades
Counter-trend trading in forex requires caution. Key considerations include:
- Avoid Unplanned Position Averaging
- Set Stop-Loss Levels
- Trade with Clear Rationale
Avoid Unplanned Position Averaging
Avoid blindly [averaging down] averaging down—adding to a losing position to adjust costs. Since counter-trend trades oppose the trend, misjudgments can amplify losses significantly.
Set Stop-Loss Levels
Given the risk of trend continuation, stop-losses are critical—more so than in trend-following trades. Define a clear exit point (e.g., "cut losses at this level") before entering.
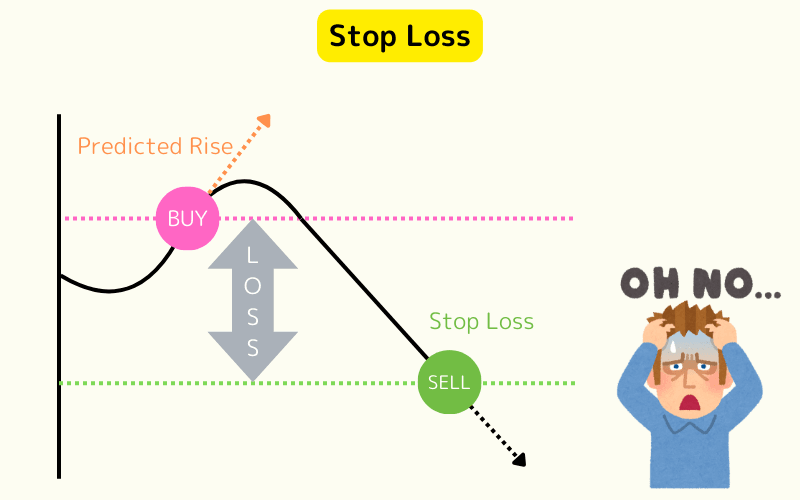
Extended Reading: Understanding Stop-Loss
Trade with Clear Rationale
Never trade counter-trend impulsively. Base entries on technical indicators or fundamental analysis to ensure a solid foundation. Even if unsuccessful, reasoned trades provide insights for improvement.
7. Counter-Trend Trading Q&A
Q1: What’s the key to winning with counter-trend trading?
Focus on quieter periods with frequent ranges. Forex markets are volatile during London and New York sessions, favoring trends. Opt for calmer hours, like 22:00 to 03:00 Eastern Time (ET), for range - bound opportunities.
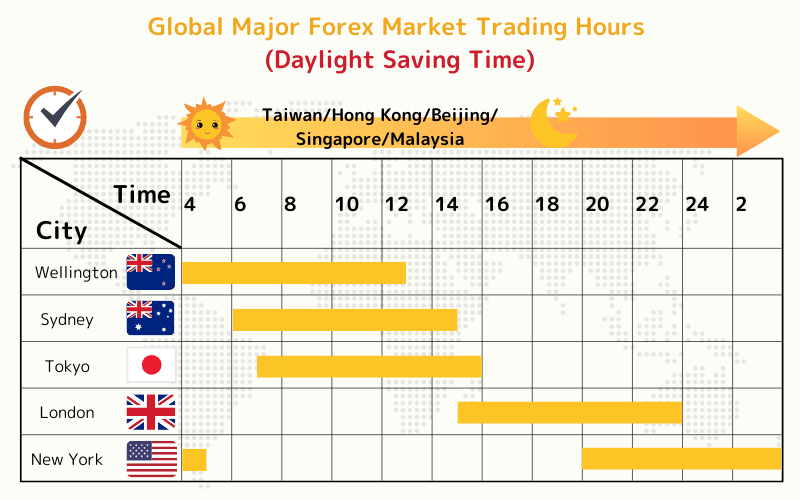
Extended Reading: Forex Trading Hours Explained
Q2: Which is less likely to lose—trend-following or counter-trend?
Trend-following is generally safer for beginners, as it aligns with momentum and reduces loss potential. Counter-trend trading risks higher losses if reversals don’t materialize.
Q3: Is counter-trend trading suitable for beginners?
Beginners can try it, but it’s tougher due to its contrarian nature. Trend-following is more intuitive and recommended as a starting point.
Q4: Which indicators are best for counter-trend trading?
Oscillators excel at spotting overbought/oversold conditions. Recommended options include:
- RSI (Relative Strength Index)
- RCI (Rank Correlation Index)
- Psychological Line
- Stochastic Oscillator
Extended Reading: More on Oscillators
8. Summary
Counter-trend trading involves going against the market flow—selling in uptrends or buying in downtrends.
It thrives in reversals or ranges, offering high rewards when timed right, but carries elevated risk if trends persist. Indicators like RSI, Stochastic, CCI, Bollinger Bands, and MACD enhance entry precision, while strict stop-losses mitigate losses.
Beginners should master trend-following first before tackling this advanced strategy.
Further Reading
Titan FX Trading Strategy Lab. We produce educational content for investors across forex, precious metals, energy, indices, US stocks, and crypto, covering technical analysis and how markets work.
Primary Sources (by Category)
- Educational & research: Investopedia, CMT Association
- Market & data: Bloomberg, Reuters, and TradingView chart analysis and commentary