What is CCI? Definition, Strategies & Trading Tips
CCI (Commodity Channel Index) is a technical indicator primarily used to determine whether the market is "overbought" or "oversold."
While most oscillators are typically used for "counter-trend trading," one of CCI’s key features is that it can also be applied for "trend-following trading."
CCI also has multiple variations, such as the "Dual CCI" strategy. Mastering these techniques can significantly improve trading accuracy.
This article will explain the basic concept, applications, and calculation formula of CCI in detail.
1. What is CCI?
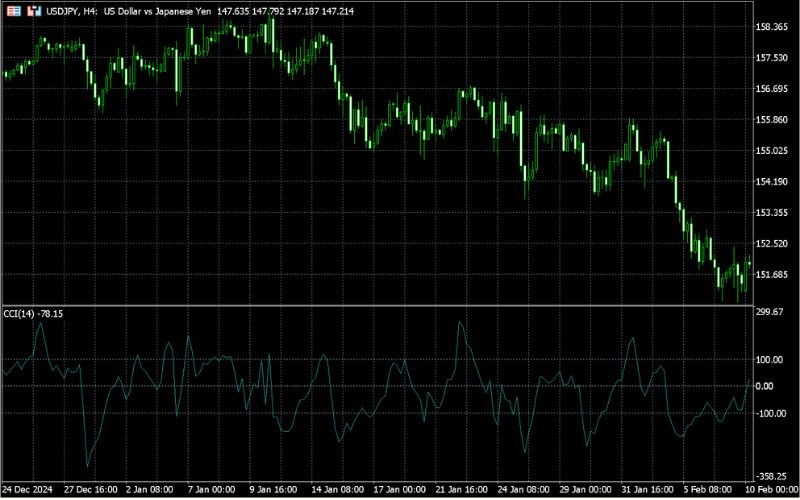
CCI (Commodity Channel Index) is an oscillator used to measure whether the market is in an "overbought" or "oversold" condition.」
Oscillators are mainly used to detect market overheating, allowing traders to engage in counter-trend trading. However, CCI can be used for both counter-trend and trend-following trading.
CCI Calculation Formula
The CCI calculation is as follows:
CCI = (TP - MA) ÷ (0.015 × MD)Where:
- TP ( Typical Price ) = (High + Low + Close) ÷ 3
- MA ( TP, n ) : Moving average of TP over n periods
- MD ( TP, n ) : Mean deviation of TP from the moving average over n periods
Origin of 0.015:
This value was selected by Donald Lambert (the creator of CCI) as an empirical constant to ensure that most CCI values (around 70%–80%) remain within the ±100 range.
To adjust CCI sensitivity, you can modify this coefficient — for example, setting it to 0.02 or 0.025 to adapt to different market volatility.
The core concept of this formula is to measure how far the current value deviates from the moving average over a specific period.
CCI is similar to the Moving Average Convergence Divergence (MACD), but unlike MACD, CCI factors in market volatility, making it more responsive.
Common Parameter Settings:
- Standard setting: 14 periods (this is the default setting in MT4 and MT5)
- Shorter period (e.g., 6 periods): More sensitive, suitable for short-term trading
- Longer period (e.g., 50 periods): Smoother fluctuations, suitable for long-term trading
2. Basic Concepts and How to Use CCI
Basic Interpretation of CCI
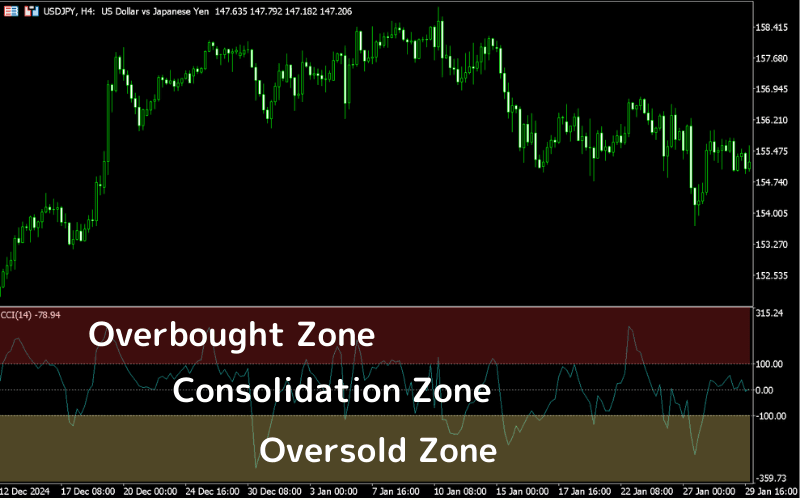
CCI values tend to fluctuate between -100 and +100. When the CCI value exceeds +100, the market is considered strong; when it falls below -100, the market is considered weak.
- CCI > +100: Market is in an overbought condition
- CCI < -100: Market is in an oversold condition
- -100 < CCI < +100: Market is in a consolidation phase
Even if the CCI has not yet crossed these key levels, other methods can be used to determine entry points.
3. CCI Trading Strategies
3.1: Trend-Following Strategy
The trend-following strategy involves trading in the direction of the market trend. Here’s how to apply it:
- Buy when CCI crosses above +100
- Sell when CCI crosses below -100

In highly volatile markets, the following situations may occur:
- CCI simultaneously breaks +100 and +200
- CCI simultaneously falls below -100 and -200

Such extreme volatility often makes the market unpredictable. It's recommended to stay on the sidelines and avoid trading during these periods.
3.2: Using the Zero Line to Identify Trade Signals
The Zero Line (CCI = 0) represents the level where the current price equals the moving average.
- CCI crossing above the zero line → Buy signal ( Golden Cross)
- CCI crossing below the zero line → Sell signal ( Death Cross)
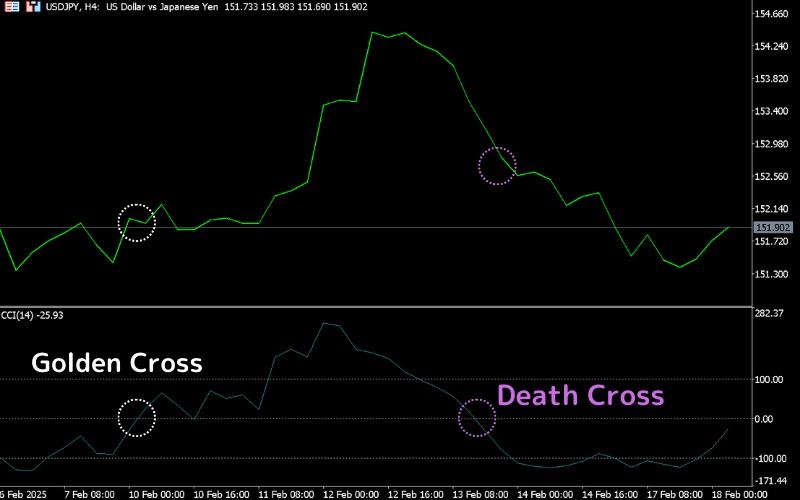
This is similar to the concept of golden crosses and death crosses with moving averages. When CCI crosses the zero line, it signals a potential trend reversal and can serve as a reference point for trade entries.
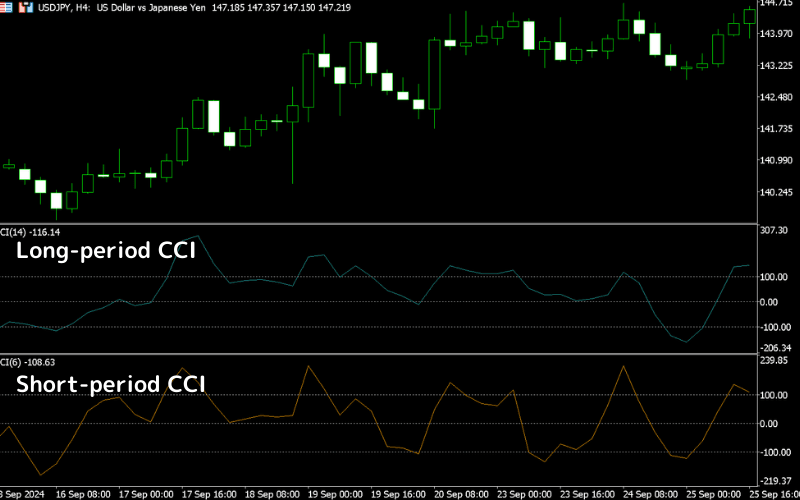
3.3: Dual CCI Strategy
The Dual CCI strategy involves using two CCI indicators with different periods to capture market movements.
The short-period CCI responds more sensitively to market conditions, while the long-period CCI reacts more slowly and steadily.
By observing the difference between these two lines, you can identify buy-the-dip and sell-the-rally opportunities.
Common CCI Combinations:
- Short-period CCI (e.g., 6 periods) → More sensitive, suited for short-term movements
- Long-period CCI (e.g., 14 periods) → More stable, suited for trend confirmation
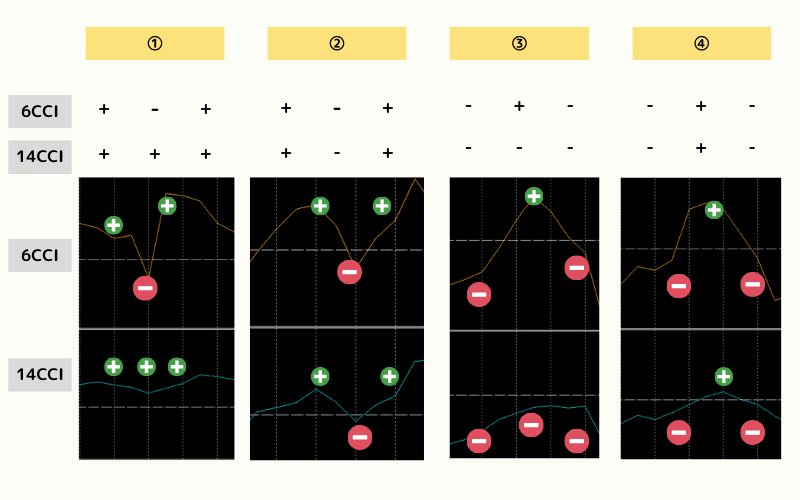
Dual CCI Trading Rules
- Both CCI lines above zero → Bullish market, consider buying
- Both CCI lines below zero → Bearish market, consider selling
When the short-period CCI crosses the zero line before the long-period CCI, it can be an ideal entry point. For example:
| Description | Trading Suggestion |
|---|---|
| Short-period CCI drops below the zero line, but long-period CCI remains above the zero line | Wait for the short-period CCI to cross back above the zero line before buying |
| Short-period CCI crosses above the zero line, but long-period CCI remains below the zero line | Wait for the short-period CCI to cross back below the zero line before selling |
For the two CCI indicators, values above the zero line are considered positive (+), and values below are negative (-).
This strategy can effectively filter out false signals and improve trading accuracy.
4. How to Set Up the CCI Indicator (MT4/MT5)
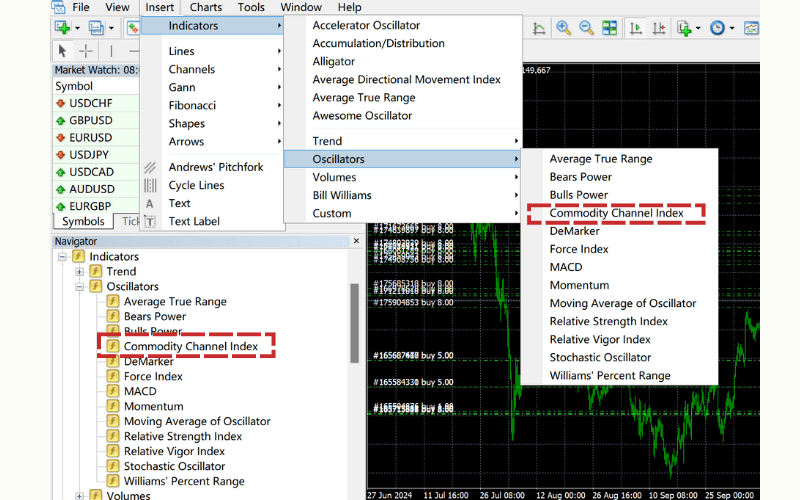
How to Set Up CCI in MT4
① Log in to MT4
② Open the chart of the trading instrument
③ Select "Insert" → "Indicators" → "Oscillators" → "Commodity Channel Index" from the menu bar;
or select "Indicators" → "Oscillators" → "Commodity Channel Index" from the navigator bar.
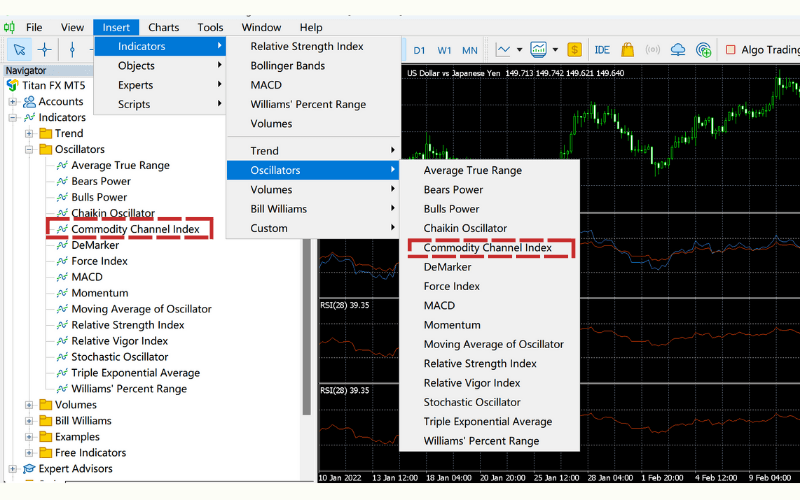
How to Set Up CCI in MT5
① Log in to MT5
② Open the chart of the trading instrument
③ Select "Insert" → "Indicators" → "Oscillators" → "Commodity Channel Index" from the menu bar;
or select "Indicators" → "Oscillators" → "Commodity Channel Index" from the navigator bar.
5.Conclusion
The Commodity Channel Index (CCI) is an oscillator that helps identify whether the market is overbought or oversold.
The main CCI strategies include:
1.Trend Following (Enter when CCI crosses +100 or -100)
2.Zero Line Crossover Strategy (Confirm trend reversal when crossing the zero line)
3.Dual CCI Strategy (Combining short-period and long-period CCI)
Additionally, using CCI alongside other indicators such as the Relative Strength Index (RSI), Stochastic Oscillator, and Psychological Line can enhance prediction accuracy.
By mastering CCI strategies, traders can more accurately identify market trends and improve their trading success rate!