Oscillators

Oscillators are widely used tools in technical analysis, mainly employed to determine whether a market is overbought or oversold and predict potential price reversal points. These indicators are particularly useful in range-bound markets and help traders implement contrarian strategies. This article will discuss the significance of oscillators, common types, and how to use them.
Key Takeaways
- What oscillators are and how they differ from trend indicators
- How to read RSI, Stochastic, and MACD — the three most common oscillators
- Overbought/oversold thresholds and practical trading signals
- Step-by-step setup of oscillators in MT4/MT5
What are Oscillators?
Oscillators are technical indicators used to measure the overbought or oversold levels of a market. The term "oscillate" refers to the characteristic of prices fluctuating within a certain range. These indicators help traders determine if the market is in an extreme state, thereby predicting possible price reversals.
Core Functions of Oscillators
1. Identify Overbought and Oversold Conditions
When an oscillator indicates that the market is overbought, it may suggest that prices are likely to drop. Conversely, when the market is oversold, it may indicate that prices are about to rise.
2. Suitable for Range-bound Markets
In markets where price fluctuations are small, oscillators are effective in identifying potential reversal opportunities.
3. Contrarian Trading Tool
Oscillators are often used in contrarian trading strategies, where traders take the opposite position when prices reach extreme values.
Oscillators vs. Trend Indicators
Technical indicators can broadly be divided into two categories: trend indicators and oscillators. The main differences between them are as follows:
| Indicator Type | Characteristics |
|---|---|
| Indicate overbought or oversold market conditions Can predict price reversals Suitable for contrarian strategies Best for short-term trading | |
| Determine trend direction and strength Used in trend-following strategies Best for medium to long-term trading |
Application of Oscillators in Forex Trading
In the forex market, the primary function of oscillators is to help traders determine whether the market is overreacting and identify potential price reversal points. These indicators are especially useful for short-term trading, particularly in range-bound markets, where they can effectively spot overbought and oversold extremes, helping traders find optimal entry points.
Advantages:
Helps traders avoid buying high and selling low
Reduces trading risks and increases win rates
Suitable for high-frequency trading or short-term strategies
Common Oscillators
Here are some of the most commonly used oscillators and their methods of use:
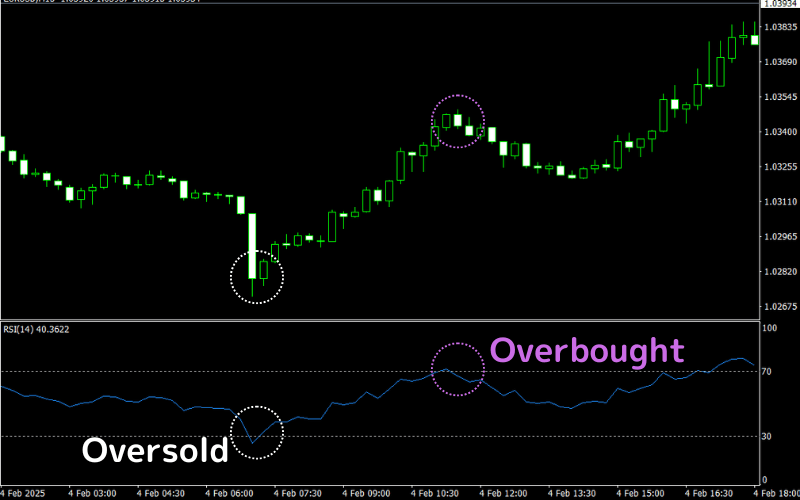
RSI (Relative Strength Index)
RSI (Relative Strength Index) is one of the most widely used oscillators, helping traders measure market overbought and oversold conditions to identify potential reversal points.
RSI Calculation Formula
RSI (Relative Strength Index) is based on the average gains and losses over a specific period, calculated using the following formula:
RSI = 100 - [100 / (1 + RS)]Where:
RS (Relative Strength) = Average gain / Average loss
Standard RSI period = 14 (can be adjusted based on strategy)
RSI Usage
RSI > 70: Market is overbought, price may correct or drop; suitable for considering selling or reducing positions.
RSI < 30: Market is oversold, price may bounce or rise; suitable for considering buying or increasing positions.
RSI Divergence: When prices hit new highs, but RSI doesn't, it may signal a trend reversal.
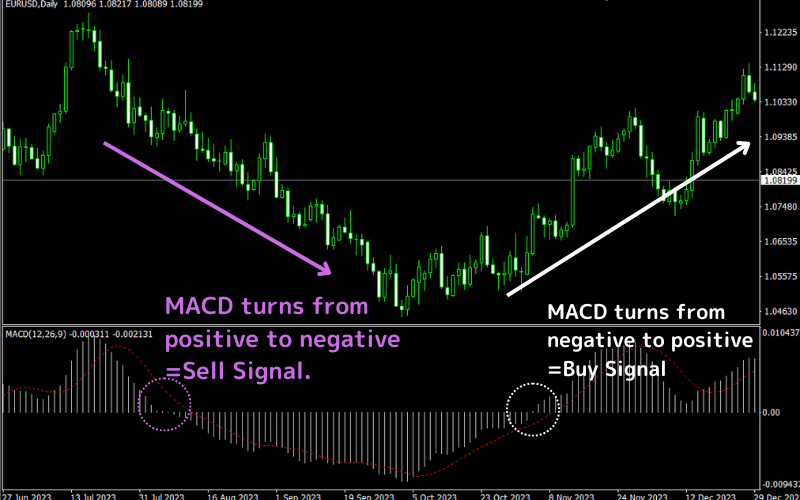
MACD (Moving Average Convergence Divergence)
MACD (Moving Average Convergence Divergence) combines both trend and oscillator characteristics, often used to measure trend strength and turning points.
MACD Components and Calculation
| Component | Formula | Description |
|---|---|---|
| MACD Line (Fast Line) | MACD Line = Short-term EMA (12) - Long-term EMA (26) | Reflects the difference between short- and long-term trends. |
| Signal Line (Slow Line) | Signal Line = 9-period EMA of the MACD Line | Smooths out MACD fluctuations to help identify trend changes. |
| MACD Histogram | MACD Histogram = MACD Line - Signal Line | The histogram length and direction indicate the difference between the MACD Line and Signal Line, reflecting market momentum. |
MACD Usage (Example using MT4/MT5)
In MT4/MT5 platforms, MACD is typically displayed with a histogram and a Signal Line (MACD Line is not shown by default). The interpretation is as follows:
| Cross Type | Description |
|---|---|
| Golden Cross | When the MACD histogram moves from negative to positive, it signals that the MACD Line (Fast Line) has crossed above the Signal Line (Slow Line), typically seen as a buy signal, indicating strengthened momentum and a potential price increase. |
| Death Cross | When the MACD histogram moves from positive to negative, it signals that the MACD Line (Fast Line) has crossed below the Signal Line (Slow Line), typically seen as a sell signal, indicating weakened momentum and a potential price decrease. |
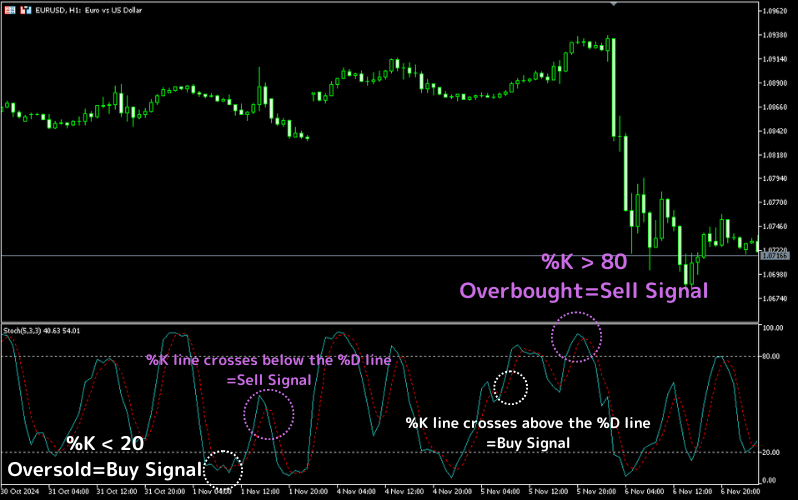
Stochastic Oscillator (KD)
Stochastic Oscillator Indicator is a commonly used oscillator for measuring market overbought and oversold conditions by comparing the current price to the price range over a specified period to predict potential price reversals.
Stochastic Oscillator Indicator Calculation
The KD Stochastic consists of two lines: the %K line and the %D line. The %K line represents the relative position of the current price between the highest and lowest prices in a specified period, while the %D line is the smoothed moving average of the %K line.
%K = [(Current closing price - Lowest price of the last n days) / (Highest price - Lowest price of the last n days)] × 100 %D = n-day moving average of %KTypically, the %K line is calculated using a 14-day period, while the %D line uses a 3-day period.
Stochastic Oscillator Usage
| Signal Type | Description |
|---|---|
| %K > 80 | Market is overbought, price may correct or drop; suitable for considering selling or reducing positions. |
| %K < 20 | Market is oversold, price may rebound or rise; suitable for considering buying or increasing positions. |
| %K and %D Crossovers | A %K line crossing above the %D line is a buy signal, and a %K line crossing below the %D line is a sell signal. |
Stochastic Oscillator Divergence
Price Divergence: When price reaches new highs or lows, but the KD Stochastic does not, it may signal a trend reversal. For example, when the price reaches a new high but the KD Stochastic fails to do so, it may indicate that the uptrend will end, and vice versa.
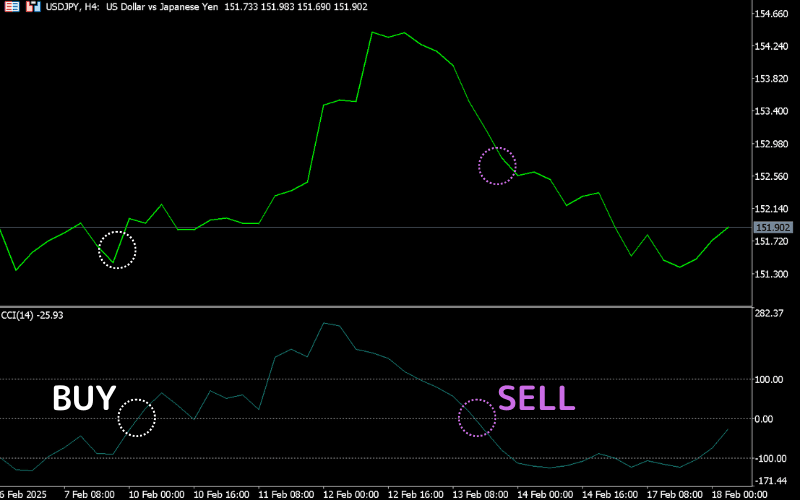
CCI (Commodity Channel Index)
CCI (Commodity Channel Index) is an oscillator used to measure the deviation of prices from their statistical average, helping traders identify overbought and oversold conditions and providing potential reversal signals.
CCI Calculation Formula
CCI is calculated based on the deviation of price from its moving average, with standard deviation as a measure of this deviation. The formula is:
CCI = (Current price - Moving average) / (0.015 × Average absolute deviation)Where:
- The current price is usually the closing price.
- Moving average refers to the simple moving average over a given period.
- Average absolute deviation measures the average absolute deviation of prices from the moving average, helping gauge price volatility.
Typically, CCI uses a 14-period calculation, but it can be adjusted according to trading strategies.
CCI Usage
| Signal Type | Description |
|---|---|
| CCI > +100 | Market is overbought, price may correct or drop; suitable for considering selling or reducing positions. |
| CCI < -100 | Market is oversold, price may rebound or rise; suitable for considering buying or increasing positions. |
| CCI Zero Line Crossovers | A CCI crossing from below to above zero is a buy signal, and a CCI crossing from above to below zero is a sell signal. |
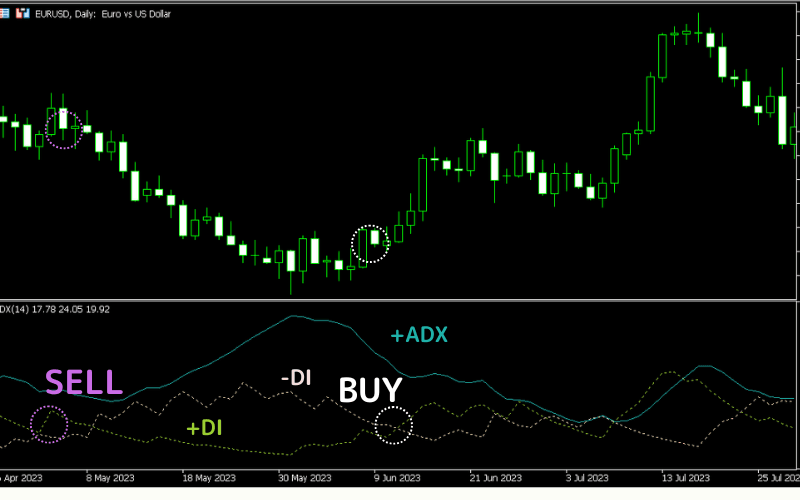
DMI (Directional Movement Index)
DMI (Directional Movement Index) is a technical indicator used to measure trend direction and strength. Although it is classified as an oscillator, it is sometimes grouped as a trend indicator.
The primary purpose of DMI is to address the limitations of oscillators like RSI in trend markets, helping traders better assess market trends.
DMI Three Lines
| Line Name | Meaning |
|---|---|
| +DI | Represents the strength of an upward trend. |
| -DI | Represents the strength of a downward trend. |
| ADX | Measures the overall strength of the trend. |
DMI Signal Interpretation
| Signal Type | Description |
|---|---|
| Buy Signal | When +DI crosses above -DI, forming a "Golden Cross", it is considered a buy signal. If the ADX is rising, the trend is strengthening, making the signal more reliable. |
| Sell Signal | When -DI crosses above +DI, forming a "Death Cross", it is considered a sell signal. If the ADX is rising, the trend is strengthening, making the signal more reliable. |
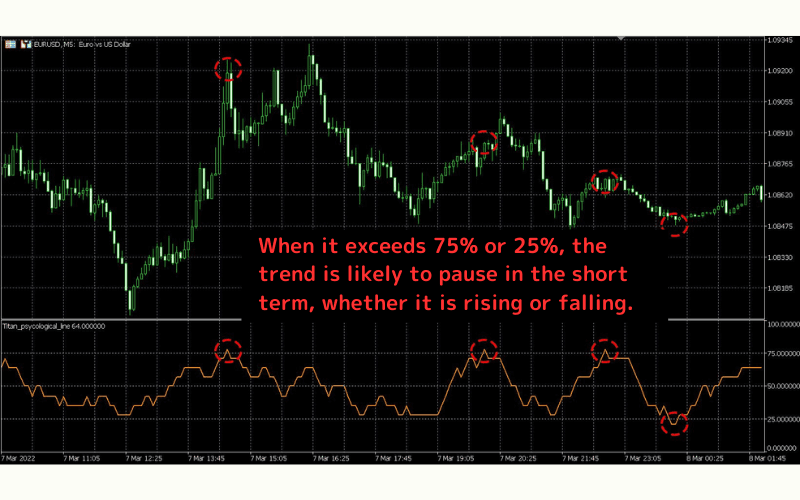
PSY Indicator (Psychological Line)
Psychological Line (PSY) is a simple oscillator that shows the percentage of upward days within a specified period.
When the indicator value is at 100%, it means all candles in the specified period are bullish; when the value is 0%, it means all candles are bearish.
PSY helps traders analyze the overheat or overcooling of the market based on the ratio of upward days, offering trading decision guidance.
PSY Calculation Formula
PSY = (Number of Up Days / Total Days) × 100For example, if there are 10 up days in a 14-day period, PSY = (10 / 14) × 100 = 71.43.
PSY Usage
| Signal Type | Description |
|---|---|
| PSY > 75 | When PSY exceeds 75%, it suggests the market is overly optimistic and may be overheating, so consider selling or reducing positions. |
| PSY < 25 | When PSY is below 25%, it suggests the market is overly pessimistic, and a rebound may occur, so consider buying or increasing positions. |
| PSY Extreme Values | When PSY nears 100 or 0, it indicates extreme market sentiment. Exercise caution, as extreme sentiment could lead to a reversal. |
Notes on Oscillators
Although oscillators are very useful for identifying market reversal points, they also have some limitations:
| Issue Type | Description |
|---|---|
| False Signals | In strong trend markets, oscillators may remain in overbought or oversold zones for extended periods, causing signals to fail. |
| Limited Applicability | Oscillators work best in range-bound markets and may be less effective in trending markets. |
| Combination with Other Indicators | To increase the accuracy of signals, it is recommended to combine oscillators with trend-following indicators. |
How to Set Up Oscillators in MT4 and MT5
Here are the methods for setting up oscillators on MT4 (MetaTrader 4) and MT5 (MetaTrader 5).
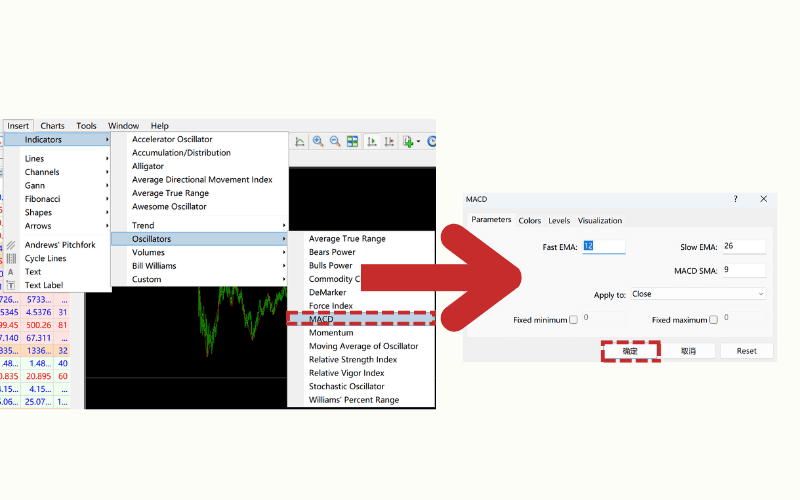
MT4 Setup Method (Using MACD as Example)
Step 1: Open the MT4 platform and click on the "Insert" menu in the top left corner.
Step 2: Choose "Indicators" → "Oscillators" → "MACD".
Step 3: The MACD settings dialog will pop up, click "OK" to complete the setup.
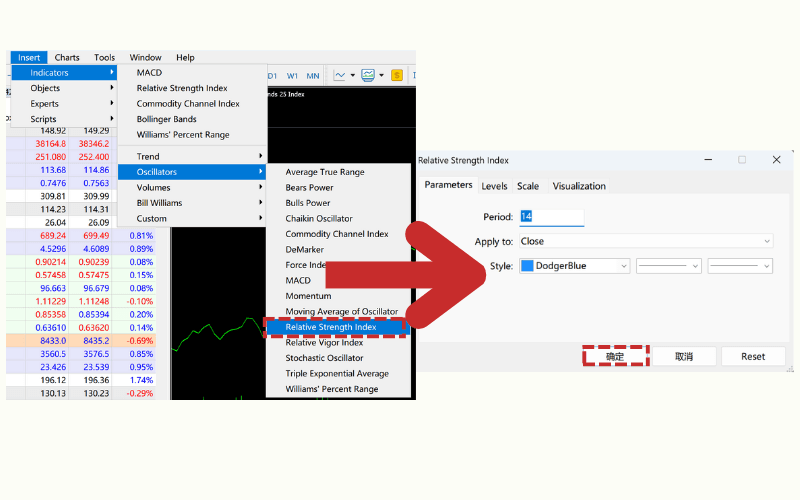
MT5 Setup Method (Using RSI as Example)
Step 1: Open the MT5 platform and click on the "Insert" menu in the top left corner.
Step 2: Choose "Indicators" → "Oscillators" → "Relative Strength Index".
Step 3: The RSI settings dialog will pop up, click "OK" to complete the setup.
Frequently Asked Questions (FAQ)
Q1: What is the difference between oscillators and trend indicators?
Trend indicators (like moving averages) identify market direction and work best in trending markets. Oscillators measure momentum and overbought/oversold conditions, performing better in ranging markets. Combining both improves trading accuracy.
Q2: Which is better, RSI or Stochastic?
Neither is universally superior. RSI is better for overall momentum and longer-term overbought/oversold readings. Stochastic is more sensitive to short-term price reversals. Choose based on your timeframe and strategy.
Q3: Can oscillators be used alone?
Not recommended. Oscillators often generate false signals during strong trends. Always confirm with trend analysis, support/resistance levels, or other technical tools.
Q4: Which oscillator should beginners learn first?
RSI is the best starting point. Its concept is simple, parameters are standardized (14-period), and interpretation is intuitive (above 70 = overbought, below 30 = oversold).
Summary
Oscillators are an indispensable tool in technical analysis, particularly in identifying overbought and oversold conditions and capturing potential price reversal points. Common oscillators like RSI, MACD, Stochastic, CCI, and DMI each have unique applications and use cases.
However, oscillators can produce misleading signals in strong trend markets, so traders should combine them with trend indicators for more accurate decision-making.
Related Articles
Titan FX Research. We produce educational content for investors, covering a wide range of financial instruments including forex, commodities (crude oil, precious metals, agricultural products), stock indices, U.S. equities, and digital assets.
Primary Sources (by category)
- Technical Analysis: Investopedia — Oscillator; CME Group — Technical Analysis
- Platform: MetaQuotes — MT4/MT5 Indicators