Selecting Moving Average Time Periods | How to Choose the Best Parameters
A moving average (MA) can look completely different depending on the period you set. A short period reacts nimbly to price; a long one steadily reflects the broader trend. Choosing that period well is the first key to using moving averages effectively.
This article covers the common period parameters, how the setting affects your analysis, and how to choose and combine periods to fit your trading style.
- What the period is: The number of candles in the average; it sets MA sensitivity
- Short: 5–25; reacts fast to price but gives more false signals
- Medium–long: 50–200; smoother and better for trends, but slower
- How to choose: Match style and timeframe (short for day trading, long for investing)
- Combining: Use short/long crosses (GC/DC) or GMMA to sharpen signals
1. Common Period Parameters
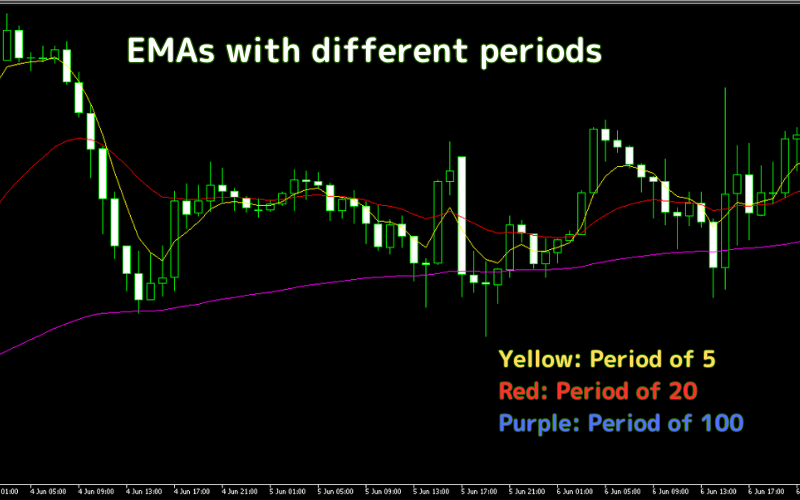
The time period parameter of a moving average refers to the specific number of days used for its calculation. Appropriate selection of parameters is crucial, because different periods affect the sensitivity and lag of the moving average.
Some common period settings and their applications are as follows.
Short-Term Moving Averages
Period:
5-day, 10-day.
Application:
These short-term moving averages are highly sensitive, and they respond to the latest price changes rapidly. They are commonly used to capture short-term market trends and dynamics, suitable for intraday and short-term trading strategies.
Mid-Term Moving Averages
Period:
20-day, 50-day.
Application:
Mid-term moving averages provide a balanced perspective, which effectively reflects trends without being oversensitive. Mid-term moving averages are often used to determine mid-term market trends and serve as potential support or resistance levels.
Long-Term Moving Averages
Period:
100-day, 200-day.
Application:
Long-term moving averages respond slower to short-term price fluctuations; thus they are primarily used to identify and confirm long-term market trends. These moving averages are particularly important in long-term strategy and investment decisions.
2. Impact of Period Selection
Suitable selection of period parameters significantly affects the functionality and effectiveness of moving averages. Different periods result in various levels of sensitivity and lag, which are critical for the timeliness and accuracy of trading decisions.
Sensitivity:
Shorter periods make moving averages more sensitive to price changes, allowing them to reflect the latest market dynamics rapidly. However, this can also lead to more false signals, because short-term market noise influences the average more frequently.
Lag:
Although longer periods can filter out noises created by short-term fluctuation and provide a more stable trend, they respond more slowly, which may result in the lag of entry and exit signals.
3. How to Select the Best Time Period Parameters
The best selection of moving average time period requires consideration of trading strategy, market conditions, and risk tolerance. Some helpful strategies for best period selection are as follows.
Market Analysis:
First, analyze the market volatility first. In highly volatile markets, shorter moving averages may generate excessive trading signals, which increases the risk of misjudgment. In such cases, a longer period may be needed to get more stable signals.
Trading Strategy:
The nature of trading strategy is also critical. For example, intraday and short-term traders may prefer shorter periods for moving averages to respond to minor market changes more rapidly, while mid- to long-term investors may prefer longer periods for moving averages to have a better understanding of long-term market trends.
Backtesting:
Utilizing historical data to test the influence of past trading decisions placed by different period parameters is an effective approach to determining the best choice. Through backtesting, it can be observed how various settings perform under similar market conditions, which leads to a more scientific selection of appropriate periods.
4. Combination of Multiple Time Periods
Combining moving averages of different time periods is a common and effective trading strategy. This approach provides a more comprehensive market perspective and enhances the reliability of trading signals. By comparing the crossover points of short-term and long-term moving averages, traders can identify trend reversals more accurately and, therefore make more informed trading decisions.
Benefits of Utilizing Multiple Moving Averages:
Confirmation of Trend:
Long-term moving averages facilitate the confirmation of primary market trends, while short-term moving averages can capture minor fluctuations.
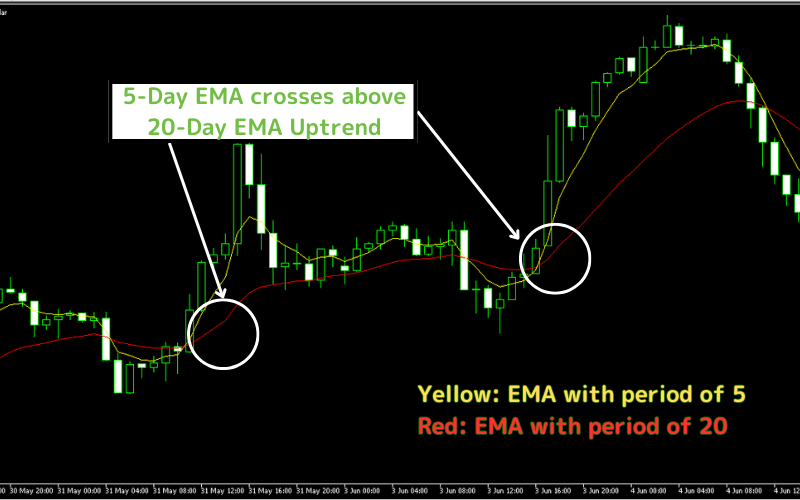
When a short-term moving average crosses above a long-term moving average (Golden Cross), it is often taken as a buy signal.
On the other hand, when a long-term moving average crosses down a long-term moving average (Death Cross) it may be a sell signal.
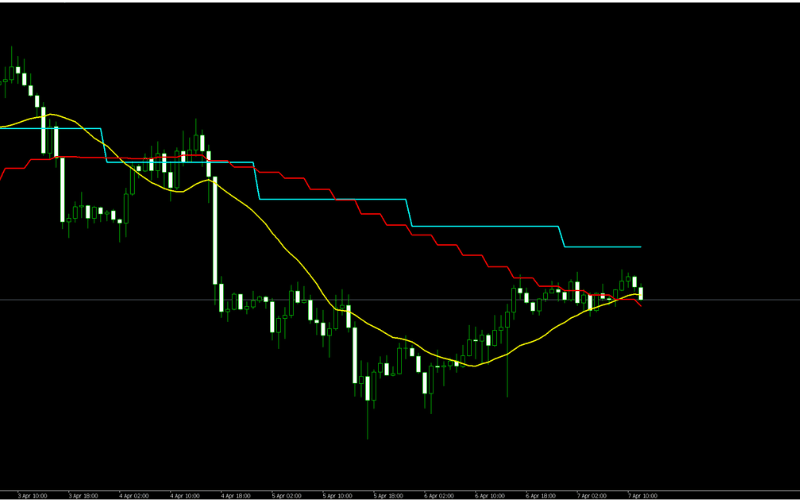
Dynamic Support and Resistance:
Multiple moving averages can serve as dynamic support and resistance levels. In an uptrend, longer-term moving averages often serve as support, prices may rebound after reaching these levels.
In a downtrend, these averages may act as resistance, prices may fall after reaching them.
Reducing False Signals:
Combination of different moving averages can effectively reduce misleading signals that may be generated by a single moving average.
This approach can filter out random fluctuations that appear only in short-term moving averages, ensuring more stable and reliable trading signals.
Example for Actual Application:
Day Trade
Traders can use the 5-day and 20-day EMA to identify short-term market dynamics. When the 5-day EMA crosses above the 20-day EMA, it may indicate a good opportunity to buy in the short term; otherwise, it may be a signal to sell.
Long-term Investment
Long-term investors may look at the crossovers between the 50-day and 200-day SMAs, using this strategy to decide when to enter the market or add to a position, and when to reduce a position or exit entirely.
5. Titan FX Free Custom Moving Average Indicators
Titan FX provides traders with a variety of custom indicators for MT4/MT5, all based on Moving Averages.
1. Multi-Timeframe Moving Average (Titan_Multi_MA)
This indicator displays not only the Moving Average for the current chart's timeframe but also for longer timeframes. It helps traders quickly identify potential support/resistance levels and significant trend changes.
Learn More and Install the Multi-Timeframe Moving Average
2. Moving Average Deviation (Titan_Multi_MA_Deviation)
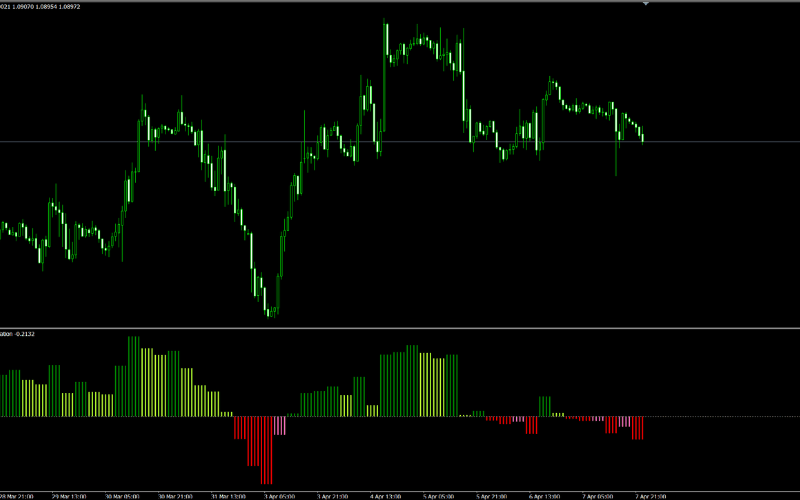
This indicator shows the deviation ratio from the Moving Average as a histogram or line. It can be used to identify potential trends, market overheating, and other scenarios. It supports SMA, EMA, SMMA, and LWMA and can analyze deviation ratios for both chart and longer timeframes.
Learn More and Install the Moving Average Deviation
3. Moving Average Bands (Titan_Multi_MA_Bands)
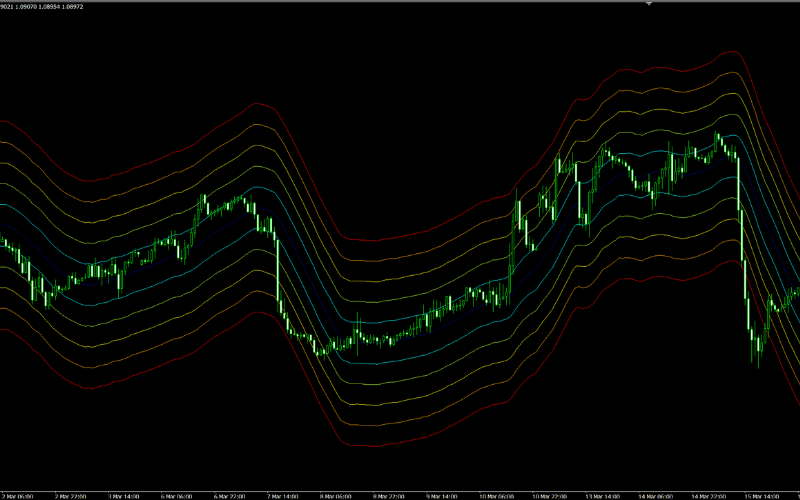
The Moving Average Bands indicator plots lines above and below a Moving Average based on a specified deviation ratio. It is useful for analyzing trends, evaluating trend strength, and identifying market overheating.
Learn More and Install the Moving Average Bands
4. Multi-Timeframe Hull Moving Average (Titan_Multi_HMA)
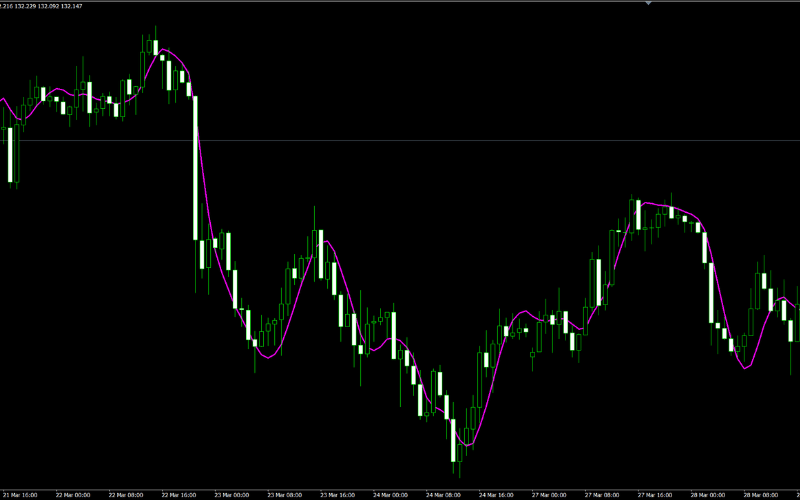
The Multi-Timeframe Hull Moving Average (HMA) indicator shows HMA lines for both the chart's timeframe and longer timeframes. It helps traders analyze trends more effectively.
Learn More and Install the Multi-Timeframe Hull Moving Average
5. Trend Checker Indicator (Titan_Trend_Checker)
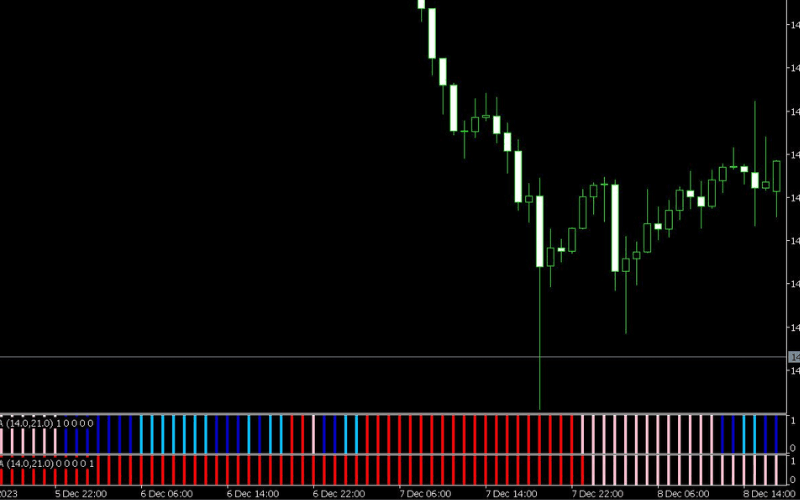
This indicator displays the status of three types of trend-based indicators (SMA, EMA, DMI, or Parabolic SAR) in the sub-chart. It also supports multi-timeframe analysis to provide insights into long-term trends.
Learn More and Install the Trend Checker Indicator
6. Guppy Multiple Moving Average (Titan_GMMA)
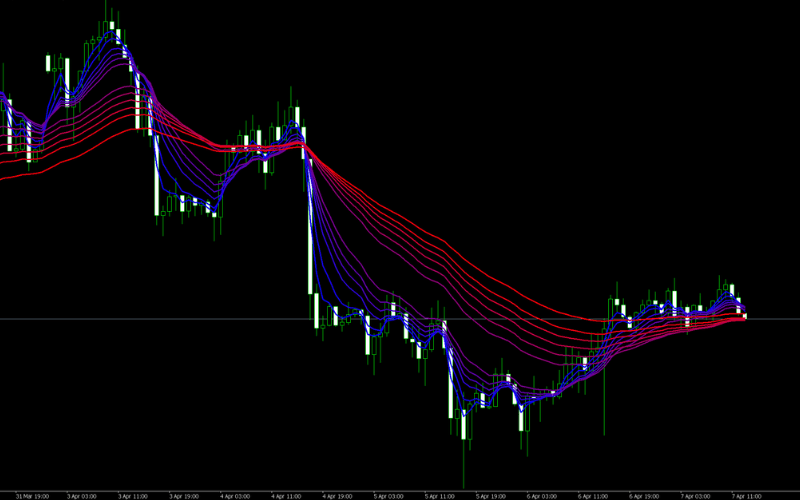
The Guppy Multiple Moving Average (GMMA) indicator displays 12 EMAs for short-term (3–15 periods) and long-term (30–60 periods) trends. Developed by Daryl Guppy, this tool helps traders analyze both short-term price movements and long-term trends.
Learn More and Install the Guppy Multiple Moving Average
6. Frequently Asked Questions (FAQ)
Q1. Which moving-average periods are most common?
Short: 5, 10, 25; medium: 50, 75; long: 100, 200. The 25-day is popular for Japanese stocks, 50/200-day for U.S. stocks, and 21/90/200 in forex.
Q2. How do I choose short vs. long periods?
It depends on your style and timeframe. Use short periods (5–25) for day trading on lower timeframes, and medium-to-long (50–200) for swing or long-term investing. Combining several gives a fuller picture.
Q3. Does a longer period mean more accuracy?
No. A longer period is smoother with fewer false signals but lags, so entries come late. A shorter one is faster but noisier. It is a trade-off — choose based on your goal.
Q4. How do I combine multiple periods?
Overlay a short and a long MA and read golden/death crosses for trend shifts. GMMA (several MAs) lets you see the balance between short-term and long-term traders at a glance.
Further Reading
Titan FX Trade Strategy Research Lab covers forex (FX), commodities (oil, precious metals, agricultural products), stock indices, U.S. equities, and crypto assets — producing educational content for retail investors across asset classes.
Primary Sources (by Category)
- Reference: Investopedia — Moving Average
- Platform: MetaQuotes — MT4 / MT5