What is the Exponential Moving Average (EMA)? Calculation, Parameter Settings, and Applications

The Exponential Moving Average (EMA) is a moving average that gives greater weight to recent prices, so it reacts to market changes faster than the Simple Moving Average (SMA). It is a widely used tool for trend judgment and signals in technical analysis.
This article breaks down what the EMA is and how it is calculated, how it differs from the SMA, practical applications, choosing the period parameter, and its limitations.
- The EMA weights recent prices more heavily, making it faster and more sensitive than the SMA
- It uses a smoothing factor (e.g. 2÷(N+1)); shorter periods are more sensitive, longer ones smoother
- Used to judge trend direction and momentum and signals such as golden/death crosses
- Common periods: 5/10 (short), 20/50 (mid), 100/200 (long) — chosen by trading style
- It is a lagging indicator; in ranges it gives false signals, so pair it with other tools and risk control
1. What is the Exponential Moving Average (EMA)?
The Exponential Moving Average (EMA) is a commonly used indicator in technical analysis, mainly used to smooth price data, and facilitate the identification of market trends and potential trading opportunities.
In comparison with the Simple Moving Average (SMA), the EMA is more sensitive to recent price changes, which makes it reflect the trends of price change more quickly.
This characteristic makes EMA particularly suitable for short-term traders and investors seeking to respond rapidly to market changes.
The EMA calculation involves the weighting of price data within a specified time period, every data point is assigned a weighting factor according to its recentness.
Because the more recent data are assigned with greater weight in the calculation of EMA, EMA is able to provide more timely signals to respond to rapid price fluctuations.
2. How to Calculate the Exponential Moving Average (EMA)?
The detailed steps of Exponential Moving Average (EMA) calculation are as follows, which includes the initialization and update process of EMA.
1. Calculation of Smoothing Constant (α)
The smoothing constant is a key parameter in EMA calculation, it determines the weights assigned to recent price data.
Equation for Smoothing Factor (α): 𝛼 = 2 ÷ (n + 1)
※Where, n is the time period, which is usually set as 12 or 26.
2. Calculation of Initial EMA Value
The initial EMA value is usually calculated from the Simple Moving Average (SMA), which serves as a starting point for the EMA.
Equation for SMA: SMA = summation of the closing prices of n days ÷ n
3. Calculation of EMA for Each Subsequent Day
Once we have the initial EMA value, we can calculate EMA for each subsequent day by the following equation.
EMA (Day D) = EMA (Day D-1) + 𝛼 × (Closing Price (Day D) – Closing Price (Day D-1))
Example
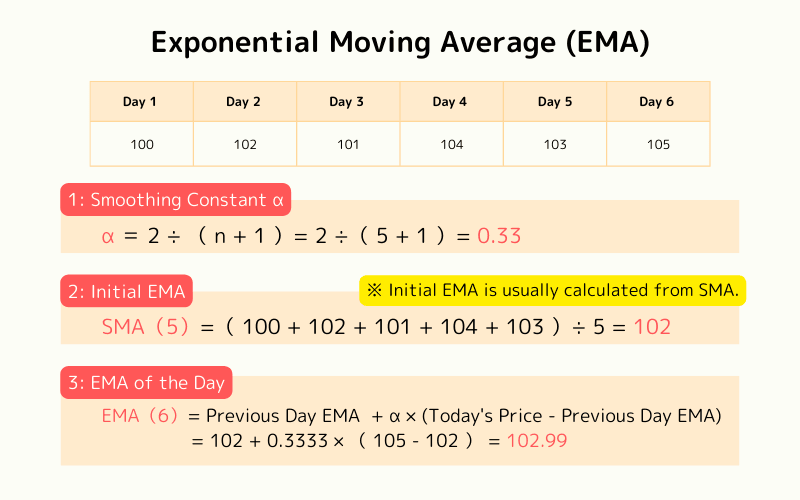
Assume that the selected time period is 5 days and calculate the Smoothing Constant of 5 days. 𝛼 = 2 ÷ (5 + 1) = 0.33
If the closing prices for the recent five days are $100, $102, $101, $104, and $103, the initial EMA (SMA) will be:
SMA = (100 + 102 + 101 + 104 + 103) ÷ 5 = 102
If the closing price of Day 6 is $105, the EMA for Day 6 will be:
EMA (6) = 102 + 0.33 × (105 – 102) = 102.99
This calculation ensures that the EMA responds quickly to the latest price changes, particularly during the time of rapid market fluctuation, this is critical. Through this mechanism, EMA provides a sensitive indicator for market trends which facilitates traders to make timely decisions.
3. Importance and Applications of EMA
The EMA is indispensable in technical analysis, particularly for traders looking forward to capturing opportunities in rapidly changing markets. The importance of EMA and some of its uses are as follows.
1. Identification of Trend
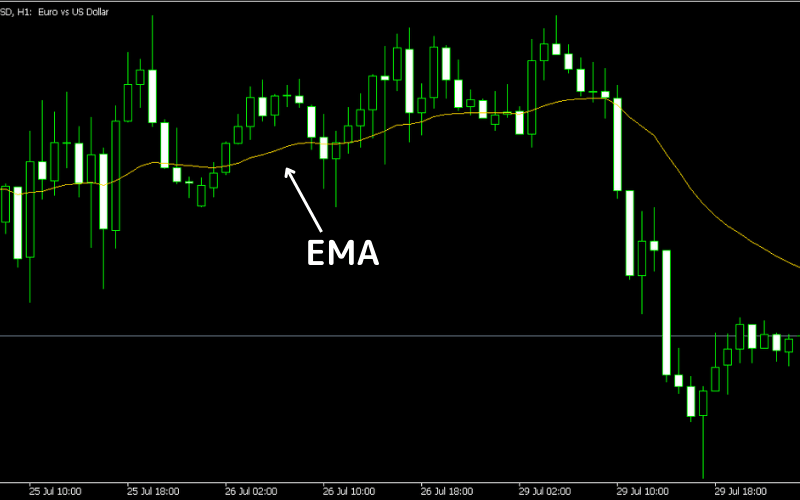
The EMA is a powerful tool for the identification of market trends. No matter in a market of upward, downward, or sideways, EMA can always provide clear visualized information to facilitate the judgment of traders on the market trends. Long-term EMAs can facilitate the identification of long-term trends, while short-term EMAs are suitable for capturing short-term dynamics of the market.
2. Generation of Trading Signals
The EMA is usually used for the generation of buy and sell signals. When a short-term EMA crosses above a long-term EMA (golden cross), it’s often seen as a buy signal. On the other hand, when a short-term EMA crosses below a long-term EMA (death cross), it’s considered a sell signal. These signals are widely used in various trading strategies, especially in trend-following and momentum-based strategies.
3. Dynamic Support and Resistance
The EMA serves as not only an indicator for trends, but also a level for dynamic support or resistance. In an uptrend, the EMA can be taken as a dynamic support, where often the supports of prices appear, and rebounds take place. In a downtrend, the EMA can be taken as resistance, where a sell-off often occurs while the price level is reached.
4. Filtering the Fluctuation of Prices
Because the weights on recent data are heavier in EMA, it provides a measure to smooth out market fluctuations, which facilitates the filtration of misleading price fluctuations resulting from market noises, thus making EMA reflect the true market dynamics more effectively than the SMA.
5. Strategy Development and Risk Management
Traders and investors can develop various trading strategies such as dual EMA crossovers or a combination of EMA with other indicators like MACD or RSI. Besides, the EMA can be used for the facilitation of risk management, e.g. to control potential losses by determination of exit points.
4. Examples of EMA Applications
1. Identification of Market Trends
The use of EMAs for identification of trends is straightforward.
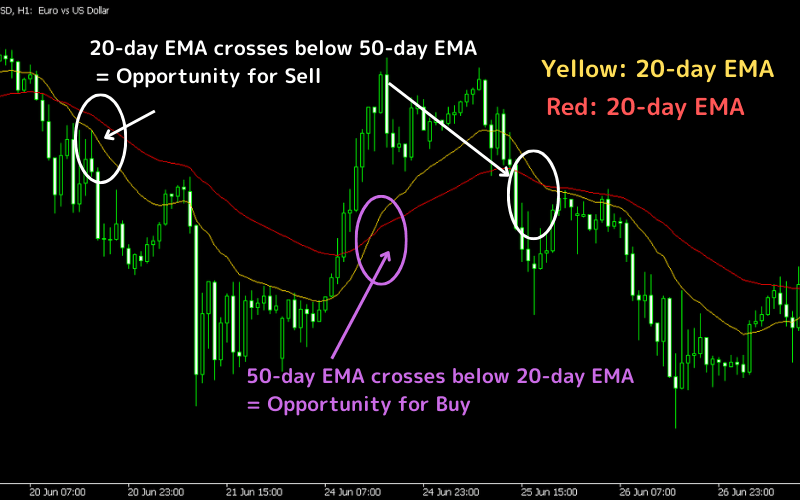
For example, traders can set a 20-day EMA and a 50-day EMA on a daily chart.
When a 20-day EMA (short-term) crosses above a 50-day EMA (long-term), it is usually taken as a signal for uptrend, or a buy signal. On the other hand, when a 20-day EMA (short-term) crosses below a 50-day EMA (long-term), it is taken as a signal for downtrend, or a sell signal.
2. Combination of EMA with Other Technical Indicators
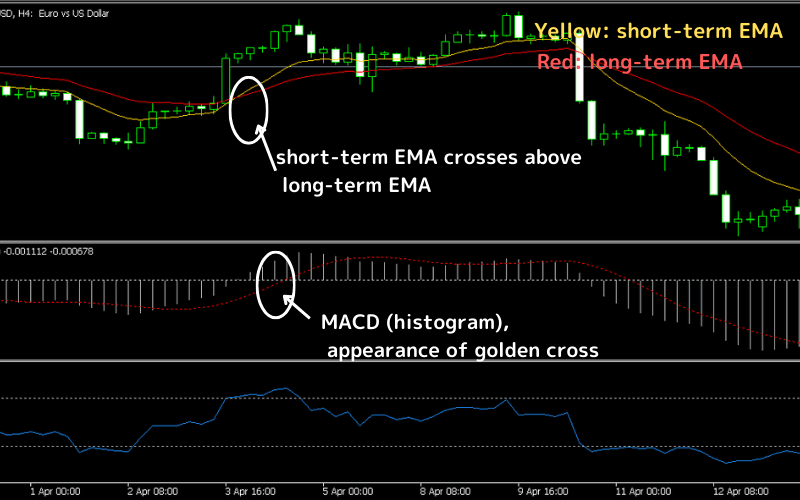
The combination of EMA with other technical indicators, e.g. MACD or RSI, provides a more comprehensive market analysis.
For example, when EMA indicates an upward trend (short-term EMA over long-term EMA), coupled with a positive MACD crossover, a combination of the two signals can improve confidence in entering a trade.
At the same time, the RSI can be used for confirmation of oversold or overbought, which provides an additional perspective for trading decisions.
5. EMA parameter selection
In markets such as FX and stocks, appropriate selection of parameters is critical, because different EMA periods capture different market dynamics at different timeframes.
Traders can select different periods of EMA according to the difference in trading strategies and market fluctuations to optimize their trading decisions.
Classification of EMA Periods
| Classification | Commonly Used Periods | Characteristics | Suitable Scenarios |
|---|---|---|---|
| Short-term EMA | 5, 10, 12 days | Responds quickly to price changes, suitable for capturing short-term market dynamics. | Suitable for day traders and scalpers who need fast response to small fluctuations in market prices. |
| Med-term EMA | 20, 26, 50 days | Provides a mid-term perspective on market trends, balancing between response speed and trend smoothing. | Suitable for swing traders seeking to close trades within days or weeks, avoiding intraday market noise. |
| Long-term EMA | 100, 200 days | Provides insight into long-term market trends, very stable, with low sensitivity to short-term fluctuations. | Suitable for long-term investors focusing on trends sustaining for months or even years. |
6. Limitations (Disadvantages) of EMA
Although the EMA is a valuable tool for technical analysis, it is not perfect and has some limitations:
Lagging Nature:
Although the lag of EMA is not that bad compared with the SMA, the EMA still lags behind the current prices as it relies on historical data, which may lead to delayed signals at sudden extreme market reversals.
Misleading Signals:
In trendless markets or markets with dramatic fluctuations, the EMA may produce false signals of crossovers, resulting in poor trading decisions.
Parameter Reliance:
The effectiveness of the EMA depends heavily on the selection of parameters. Inappropriate parameters may lead to suboptimal analysis.
7. Frequently Asked Questions
Q1. How does the EMA differ from the SMA?
The SMA averages prices over the period with equal weight, while the EMA weights recent prices more heavily. That makes the EMA faster and more sensitive, but also more affected by short-term swings.
Q2. Which EMA period should I use?
It depends on your style: 5 and 10 for short-term, 20 and 50 for medium-term, 100 and 200 for long-term. Shorter periods are more sensitive and give more signals, but also more noise.
Q3. Can I trade on the EMA alone?
Not recommended. The EMA is a lagging indicator and produces false signals in ranges, so combine it with volume, RSI, MACD and support/resistance analysis, and set strict stops.
8. Summary
The Exponential Moving Average (EMA) is a fundamental and powerful tool for financial market analysis. It facilitates traders to capture real-time market dynamics by assigning greater weight to recent price data. Traders can effectively identify trends in markets, discover trading opportunities, and establish corresponding entry and exit strategies by selecting and utilizing EMA with different periods.
Short-term EMAs allow traders to respond quickly to market changes, suitable for intraday and short-term. Med-term EMAs offer insights into trends over days or weeks, ideal for swing trades. Long-term EMAs help investors identify and confirm market trends that sustain for long-term, suitable for long-term investment decisions. The flexibility of EMA ensures that the needs of different trading styles and market conditions can be fulfilled.
Although EMA is a useful tool, it is not perfect. Traders should be cautious when using EMA for its lagging nature and potential for false signals in specific market conditions. The best choice is to combine the EMA with other technical analysis tools like the MACD or RSI, to enhance the accuracy of the analysis and reliability of trading decisions.
All in all, proper understanding and application of the EMA can greatly improve efficiency and successful rates of trade. Continuous practice and adjustment allow traders to adapt to market environments changing continuously, facilitating traders to achieve trading goals.
Further Reading
- What Is a Moving Average (MA)?
- What Is a Golden Cross?
- What Is MACD?
- Introduction to Technical Analysis
The financial markets research team at Titan FX. We produce educational content across a broad range of instruments, including forex (FX), commodities (crude oil, precious metals, agricultural products), equity indices, U.S. stocks, and crypto assets.
Primary Sources (by Category)
- Technical analysis references: John J. Murphy — Technical Analysis of the Financial Markets; Investopedia — Exponential Moving Average (EMA) definition; StockCharts — Moving Averages
- Trading practice: Titan FX — moving-average and technical-analysis education; TradingView — EMA indicator