NFP(U.S. Non-Farm Payrolls)
Among all U.S. economic releases, the Non-Farm Payrolls report is widely regarded as one of the most market-moving. Published on the first Friday of each month, it brings traders and investors around the world to a standstill as they wait for a single number.
This article explains what the NFP report is, its release schedule, why it matters, and other key details.
- What NFP (Non-Farm Payrolls) measures and when it is released
- Market reaction patterns before and after the data release
- Relationship with unemployment rate and ADP report
- Practical use of NFP data in forex trading strategies
- 1: What is U.S. Non-Farm Payrolls (NFP)?
- 2: Differences Between the Household Survey and Establishment Survey
- 3: Key Data in the U.S. Non-Farm Payrolls Report
- 4: Impact of U.S. Non-Farm Payrolls on Forex and Stock Markets
- 5: U.S. Non-Farm Payrolls Frequently Asked Questions (FAQ)
- 6: Summary – What is U.S. Non-Farm Payrolls?
1: What is U.S. Non-Farm Payrolls (NFP)?
Definition of Non-Farm Payrolls
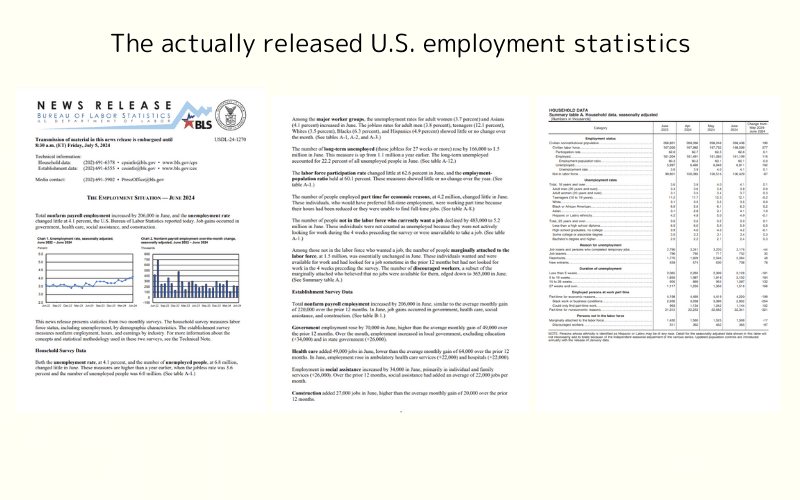
The NFP report, published monthly by the U.S. Department of Labor, is a critical measure of employment conditions in the country.
As the U.S. economy plays a central role in global finance and the U.S. dollar serves as the world's primary reserve currency, labor market conditions—including employment and unemployment trends—are key indicators of economic strength.
The report has a significant impact on financial markets, making it a crucial data point for traders and investors.
The NFP report includes over ten key data points, with "Non-Farm Payroll Employment" and "Unemployment Rate" being the most important.
NFP Release Schedule for 2026
The NFP data is generally released on the first Friday of each month.
Below is the release schedule for 2026 (times are in U.S. Eastern Time, adjusted for daylight saving time where applicable):
| Reporting Month | Release Date & Time (ET) |
|---|---|
| January 2026 | February 11 (08:30) Wed, delayed due to government shutdown |
| February 2026 | March 6 (08:30) |
| March 2026 | April 3 (08:30) |
| April 2026 | May 8 (08:30) Second Friday |
| May 2026 | June 5 (08:30) |
| June 2026 | July 2 (08:30) Thu, moved up due to Independence Day holiday |
| July 2026 | August 7 (08:30) |
| August 2026 | September 4 (08:30) |
| September 2026 | October 2 (08:30) |
| October 2026 | November 6 (08:30) |
| November 2026 | December 4 (08:30) |
2: Differences Between the Household Survey and Establishment Survey
The NFP report is compiled from two separate surveys: the Household Survey and the Establishment Survey. The key differences between them are as follows:
| Category | Household Survey (CPS) | Establishment Survey (CES) |
|---|---|---|
| Data Source | Current Population Survey | Current Employment Statistics |
| Survey Scope | Monthly survey of ~60,000 households | Monthly survey of ~122,000 businesses and government agencies, covering ~666,000 worksites |
| Employment Coverage | Includes: - Self-employed individuals - Unpaid family workers - Agricultural workers - Individuals on unpaid leave | Excludes the above groups (only agricultural workers are included) |
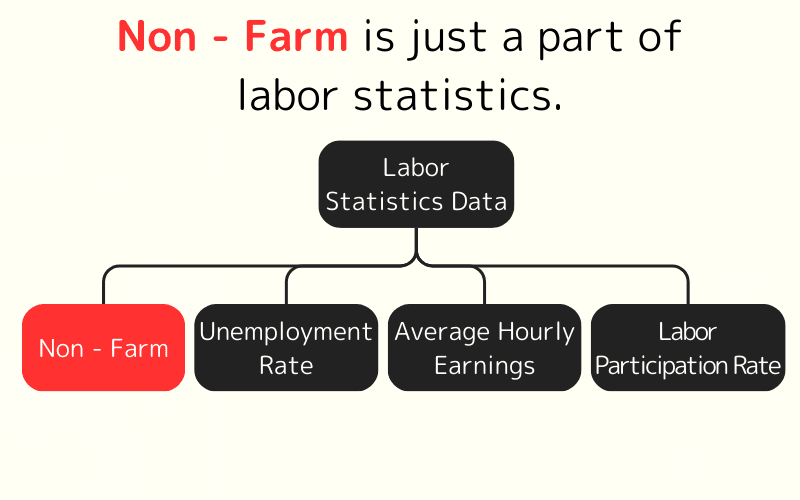
The data from these surveys is used to calculate five key employment indicators:
| Category | Key Metrics |
|---|---|
| Household Survey | - Unemployment Rate - Labor Force Participation Rate |
| Establishment Survey | - Non-Farm Payroll Employment - Average Hourly Earnings - Average Weekly Hours |
Due to differences in methodology and data sources, employment figures from the Household and Establishment Surveys may sometimes show discrepancies.
3: Key Data in the U.S. Non-Farm Payrolls Report
The four most closely watched data points in the U.S. Non-Farm Payrolls (NFP) report are as follows:
- Non-Farm Payrolls (Establishment Survey)
- Unemployment Rate (Household Survey)
- Average Hourly Earnings (Establishment Survey)
- Labor Force Participation Rate (Household Survey)
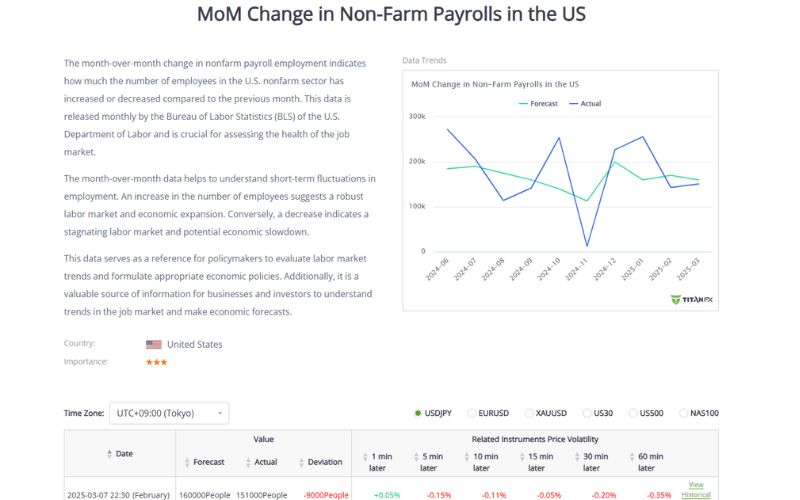
Non-Farm Payrolls (Establishment Survey)
Non-Farm Payrolls refers to the number of employees working in the non-agricultural sectors of the economy (private businesses and government agencies).
An increase in payrolls usually indicates a rise in consumer spending, so changes in non-farm payrolls are seen as a key indicator of economic health.
Check the latest change in Non-Farm Payrolls
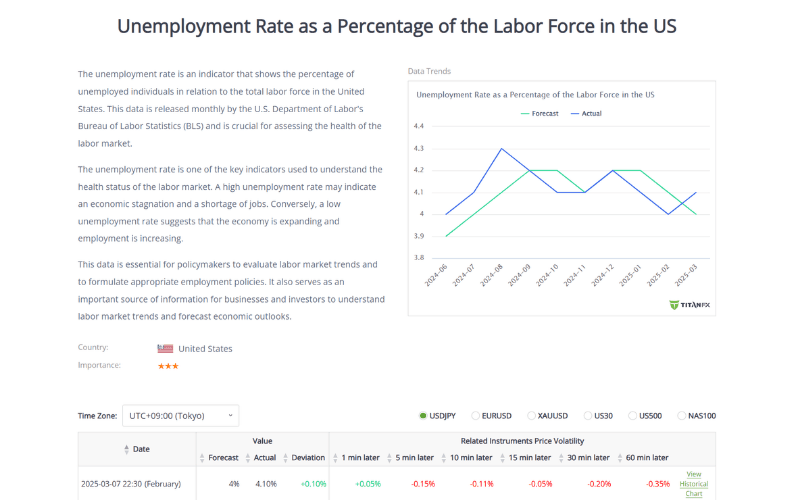
Unemployment Rate (Household Survey)
The Unemployment Rate represents the percentage of people who are willing and able to work but are currently unemployed.
The U.S. Non-Farm Payrolls report breaks down the unemployment rate into six categories from "U-1" to "U-6," based on the severity of unemployment.
The unemployment rate most commonly cited in the NFP report is the U-3 data.
The official U.S. unemployment rate (U-3) and other unemployment categories are as follows:
| Category | Summary | Definition |
|---|---|---|
| U-1 | Long-term unemployment (15 weeks or more) | Percentage of the civilian labor force unemployed for 15 weeks or more (excluding military personnel) |
| U-2 | Unemployed due to dismissal or contract expiration | Percentage of the civilian labor force unemployed due to being laid off or having temporary employment contracts end |
| U-3 | Official unemployment rate | Percentage of the civilian labor force that is unemployed |
| U-4 | U-3 + Discouraged workers | Percentage of the civilian labor force and discouraged workers who have given up looking for work |
| U-5 | U-4 + Marginally attached workers | Percentage of the civilian labor force, discouraged workers, and other marginally attached workers |
| U-6 | U-5 + Part-time workers seeking full-time work | Percentage of the civilian labor force, marginally attached workers, and people working part-time due to economic reasons |
A decrease in the unemployment rate is generally seen as a sign of economic improvement.
Check the latest unemployment rate data
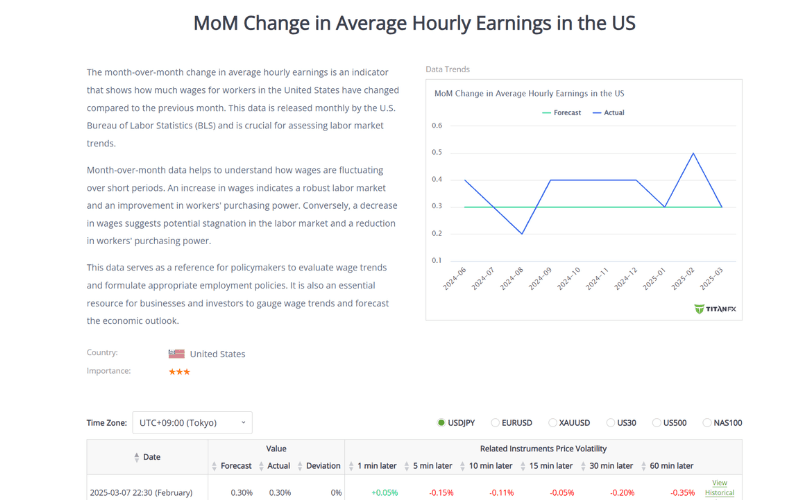
Average Hourly Earnings (Establishment Survey)
The Average Hourly Earnings data in the U.S. Non-Farm Payrolls report refers to the average wage rate for employees in non-agricultural industries, and it tracks any changes in wages.
An increase in average hourly earnings typically indicates higher labor costs, which can signal economic expansion and potential inflation trends.
Check the average hourly earnings change from last month
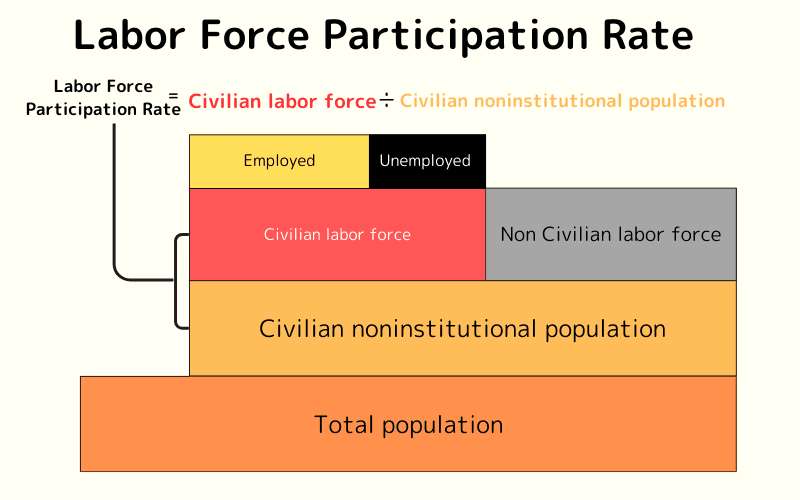
Labor Force Participation Rate (Household Survey)
The Labor Force Participation Rate represents the proportion of the working-age population that is either employed or actively seeking employment.
When the unemployment rate decreases but the labor force participation rate also falls, it may indicate that more people have stopped looking for work due to a lack of available jobs, meaning the economy may not be improving as expected.
Conversely, when the unemployment rate increases and the labor force participation rate also rises, it could suggest that more people are re-entering the job market, indicating that the economy may be recovering from a recession.
4: Impact of U.S. Non-Farm Payrolls on Forex and Stock Markets
U.S. Non-Farm Payrolls (NFP) provides deep insights into the U.S. economy and has a significant impact on both the forex and stock markets.
Impact on the Forex Market
Approximately 70% of the U.S. GDP comes from personal consumption, and employment data directly affects consumption levels.
When employment data is strong, the market expects economic growth, and the U.S. dollar typically appreciates. This is because strong employment data may drive inflation, prompting the Federal Reserve (Fed) to raise interest rates, making the dollar more attractive for investors seeking higher yields.
Conversely, weak employment data may lead the market to expect Fed rate cuts to stimulate the economy, weakening the dollar.
Impact on the Stock Market
Strong employment data is generally seen as a signal of economic health, leading to stock market rallies, especially in sectors like consumer, financial, and technology stocks. Consumer stocks benefit from increased income and consumption, while financial stocks thrive in a rising interest rate environment that boosts net interest income.
However, if the employment data is excessively strong, the market may worry about rising inflation pressures, which could prompt the Fed to adopt more aggressive rate hikes. This may increase corporate borrowing costs and squeeze profit margins, particularly for interest-sensitive sectors such as real estate and utilities.
If employment data is weak, the market may be concerned about an economic slowdown, leading to stock market declines. Cyclical sectors like industrials and energy are more affected by such data.
Weak data may also trigger expectations of Fed rate cuts, which typically benefit growth stocks, such as tech stocks, due to lower financing costs and improved valuations.
After the NFP data is released, market sentiment can change rapidly, leading to significant short-term fluctuations in the stock market.
If the data significantly exceeds expectations, stocks may rise, though inflation concerns could create headwinds; if the data falls short of expectations, stocks may drop, but expectations of rate cuts could lead to a quick rebound.
5: U.S. Non-Farm Payrolls Frequently Asked Questions (FAQ)
Q1. What is the "Yellen Dashboard"?
The Yellen Dashboard refers to a set of nine employment indicators that former Federal Reserve Chairman Janet Yellen considered critical when formulating monetary policy:
-
- Non-Farm Payrolls
-
- Unemployment Rate
-
- Labor Force Participation Rate
-
- Broad Unemployment Rate (U-6)
-
- Long-Term Unemployment Rate
-
- Quit Rate
-
- Job Vacancy Rate
-
- Hiring Rate
-
- Layoff Rate
Although Yellen is no longer the Fed Chair, these indicators remain important for the Federal Reserve when evaluating the employment market and economic conditions.
Q2. Which agency releases the U.S. Non-Farm Payrolls?
U.S. Non-Farm Payrolls is released by the U.S. Bureau of Labor Statistics (BLS).
The BLS is a government agency responsible for ensuring workers' rights, improving labor conditions, and releasing employment and wage data.
Q3. Where can I find U.S. Non-Farm Payrolls data?
U.S. Non-Farm Payrolls data can be found on the Bureau of Labor Statistics (BLS) website:
Current Employment Statistics – CES (National)
You can also track monthly changes and historical data on the Titan FX economic indicators page.
Q4. What is the relationship between Non-Farm Payrolls and the Unemployment Rate?
The table below illustrates the relationship between Non-Farm Payrolls and the Unemployment Rate for better understanding:
| Indicator | Non-Farm Payrolls | Unemployment Rate | Explanation |
|---|---|---|---|
| Definition | Change in employment in the non-agricultural sector. | Proportion of the workforce that is unemployed. | NFP reflects job growth, while the unemployment rate reflects unemployment conditions. |
| Data Source | Employer survey (Establishment Survey). | Household survey. | Different data sources may lead to discrepancies between the two. |
| Main Impact | Economic activity strength, business hiring needs. | Labor market supply and demand. | An increase in NFP usually lowers the unemployment rate, though labor force participation can influence the unemployment rate. |
| Reasons for Discrepancy | Reflects employment changes in the non-agricultural sector only. | Affected by labor force participation (entry or exit from the workforce). | For example, if more people enter the labor force but cannot find work, the unemployment rate may rise, while NFP remains unchanged. |
Q5. What happens when NFP actual vs. forecast diverges significantly?
The larger the gap, the greater the market volatility. A strong beat typically strengthens USD and lifts equities; a significant miss weakens USD and boosts safe-haven assets.
Q6. Does NFP only affect the forex market?
No. NFP impacts equities, bonds, gold, oil, and other markets. It is one of the most closely watched economic indicators globally.
Q7. What should beginners watch out for during NFP release?
Reduce position sizes or stay flat before the release, and always set stop-losses. Volatility spikes in the minutes around the announcement make chasing entries risky.
Q8. How does NFP differ from the ADP Employment Report?
ADP is published by a private firm two days before NFP and is considered a leading indicator. However, methodologies differ, so the two reports sometimes diverge.
6: Summary – What is U.S. Non-Farm Payrolls?
U.S. Non-Farm Payrolls is a crucial economic indicator released by the U.S. Bureau of Labor Statistics, reflecting the state of the U.S. employment market. It is considered an important reference for assessing the health of the U.S. economy.
As the report can significantly impact market expectations of the U.S. economy and the Fed's monetary policy, it has a substantial effect on the forex market, especially on the U.S. dollar's fluctuations.
Traders should closely monitor Non-Farm Payrolls data and market interpretations when engaging in forex trading to better understand market trends and devise trading strategies.
Further Reading
Titan FX Research. We produce educational content for investors, covering a wide range of financial instruments including forex, commodities (crude oil, precious metals, agricultural products), stock indices, U.S. equities, and digital assets.
Primary Sources (by category)
- Official Data: U.S. Bureau of Labor Statistics — Employment Situation
- Market: Bloomberg; Reuters
- Education: Investopedia — Non-Farm Payrolls