Advantages and Disadvantages of Candlestick Charts: Purpose and Importance of Learning Candlesticks
Behind almost every trading chart stands the same tool — the candlestick. Invented by Japanese rice traders in the 18th century to track the price of rice, it remains, centuries later, the most intuitive language traders use to read forex, stock, and futures markets.
These charts provide a visually unique representation of price dynamics, illustrating open, close, high, and low prices. With their color-coded and shape-based patterns, candlestick charts are not only visually appealing but also rich in insights into market sentiment and trend shifts.
This article delves into the advantages and limitations of candlestick charts, along with the purpose and significance of mastering candlestick analysis. By understanding and applying candlestick chart techniques, traders can more accurately identify market opportunities and make informed trading decisions.
- Candlesticks originated in 18th-century Japanese rice markets; each candle shows open, close, high, and low
- Color and shape reveal buyer-vs-seller pressure and sentiment, across any timeframe
- Pros: high information density and visual clarity; pairs well with RSI, moving averages, and more
- Cons: reading patterns takes experience; can give misleading signals in high volatility; reacts slowly
- Best practice: do not use candlesticks alone — combine with other indicators for accuracy
Components and Structure of a Candlestick
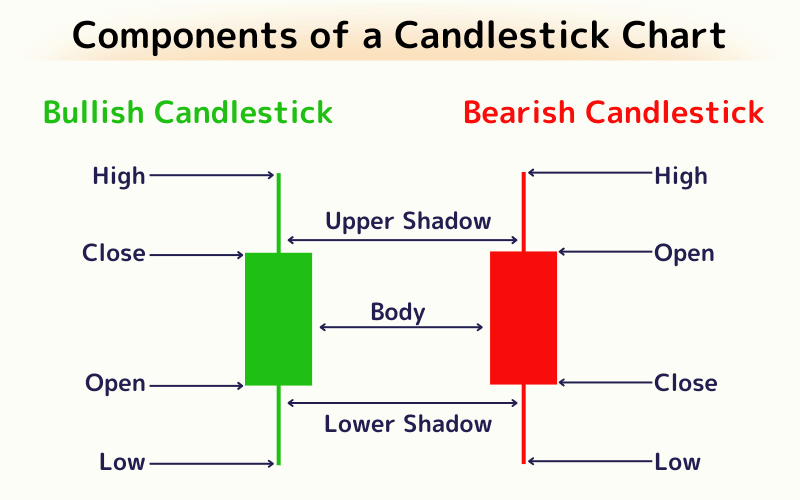
A candlestick is composed of six elements: the high price, low price, opening price, closing price, body, and shadows (or four key parts if considering only the prices). Together, they represent price fluctuations over a given period:
| Component | Description |
|---|---|
| High Price | The highest trading price within the period. |
| Low Price | The lowest trading price within the period. |
| Opening Price | The price at the start of the trading period. |
| Closing Price | The price at the end of the trading period. |
| Body | A rectangular area formed by the opening and closing prices. If the closing price is higher than the opening price, it forms a bullish candlestick (green); if lower, it forms a bearish candlestick (red). |
| Shadow | Thin lines extending from the body, representing the range between the high/low prices and the opening/closing prices. |
For information on candlestick composition and classification, please refer to the content linked below. How to Read Candlestick Charts: A Guide to 20 Key Patterns
Purpose and Importance of Learning Candlestick Charts
Learning candlestick charts is essential for traders and investors, offering a deeper understanding of market price behavior and enhancing decision-making quality. Here are the key purposes and importance of mastering candlestick charts:
1. Comprehensive Display of Price Dynamics:
Candlestick charts uniquely present the opening, closing, highest, and lowest prices of financial assets such as stocks and forex. This detailed information provides an intuitive understanding of market sentiment and aids in forecasting future price movements.
2. Intuitive Representation of Market Sentiment:
The colors and shapes of candlesticks visually reflect the balance of power between buyers and sellers. For example, in regions like Japan, Korea, Taiwan, and mainland China, red candles indicate price increases, while black (or green) candles represent price decreases.
3. Identifying Trends and Reversal Signals:
Specific candlestick patterns, such as the "Hammer," "Inverted Hammer," and "Engulfing" formations, are considered key indicators of potential market trend reversals. Recognizing these patterns is crucial for predicting shifts and timing entry or exit points.
4. Supporting Advanced Technical Analysis:
Candlestick charts complement other technical indicators and tools, such as Moving Averages, Relative Strength Index (RSI), and Bollinger Bands. This integration allows for deeper market analysis and more accurate trading signals.
5. Adaptability to Various Timeframes:
Whether for short-term traders or long-term investors, candlestick charts accommodate different timeframes. Traders can tailor their analysis to align with their strategies and goals by selecting suitable timeframes.
6. Enhancing Learning and Strategy Development:
Mastering candlestick charts fosters a better understanding of market behavior, encouraging deeper research and refinement of trading strategies. It serves as a foundation for continuous learning and optimization in trading and investing.
Advantages and Disadvantages of Candlestick Charts
Candlestick charts are widely used tools in financial market analysis, offering unique strengths while also presenting certain limitations.
Advantages
1. Intuitive Information Presentation
Candlestick charts provide all key data, including opening, closing, highest, and lowest prices, offering a comprehensive view of price dynamics in a single graphic.
2. Rich Market Sentiment Insights
The colors and patterns of candlesticks allow traders to quickly identify shifts in market sentiment, such as bullish or bearish trends.
3. Versatile Analysis Patterns
Candlestick charts incorporate various trading signals and patterns, such as double tops, double bottoms, head-and-shoulders, and inverse head-and-shoulders. These are powerful tools for analyzing market trends and predicting future movements.
4. Adaptability to Multiple Timeframes
Whether for short-term traders or long-term investors, candlestick charts can be adjusted to different timeframes, catering to diverse trading strategies and analysis needs.
Disadvantages
1. Requires Interpretation Skills
For beginners, the wealth of information and complex patterns in candlestick charts can be overwhelming. Mastery requires learning and practical experience.
2. Potential for Misleading Signals
While candlestick charts offer detailed market insights, they can sometimes produce misleading signals, especially in highly volatile markets.
3. Best Used with Other Tools
Relying solely on candlestick charts for market analysis may not provide a complete picture. Combining them with other technical analysis tools and indicators yields more accurate trading signals.
4. Delayed Reaction to Rapid Market Changes
In fast-moving markets, candlestick charts alone may not be sufficient to capture sudden market shifts promptly.
Candlestick charts remain a vital tool for traders, offering a balance of visual clarity and analytical depth. However, understanding their limitations and combining them with other tools ensures more informed and accurate trading decisions.
Frequently Asked Questions (FAQ)
Q1: How does a candlestick chart differ from other charts (line or bar charts)?
A candlestick chart carries more information than a line or bar chart. It shows the open, close, high, and low, and its body and wicks reveal the balance of buying and selling pressure and shifts in sentiment. Line charts show only the close, while bar charts emphasize volume. This detail makes candlesticks especially suited to pattern analysis and trend identification.
Q2: Are candlestick charts suitable for beginner traders?
Yes. Their visual, clearly structured format makes them very beginner-friendly. Deep pattern reading takes time to learn, but the basics — bullish and bearish candles, long wicks — are easy to grasp, making them an excellent entry point into technical analysis.
Q3: Which timeframes are candlestick charts best for?
They work flexibly across timeframes, from 1- and 5-minute scalping to daily, weekly, and monthly analysis. Short-term traders use small timeframes for immediate reactions, while long-term investors prefer daily-and-above patterns to gauge the overall trend.
Further Reading
- 16 Common Candlestick Patterns
- Technical Analysis Explained
- Market Sentiment
- What Is RSI?
- Bar Chart (Barchart)
Titan FX Research Team. We cover a broad set of financial instruments — foreign exchange, commodities (crude oil, precious metals, agricultural products), equity indices, US equities, and digital assets — producing practical, research-backed educational content for investors.
Primary Sources (by Category)
- Technical analysis theory: Munehisa Homma (Edo period) / Steve Nison, "Japanese Candlestick Charting Techniques" (1991)
- Platform tools: Titan FX Technical Indicators