What Is a Balance Sheet? Formula, Three Components & How to Read It
In US and Asian equity fundamental analysis, the balance sheet is often described as a company's "health check-up." While the income statement shows how much a company earned over a period, the balance sheet reveals its true financial strength at a specific point in time.
Warren Buffett has repeatedly emphasized that reading financial statements is the best way to understand how a company really operates — and among them, the balance sheet speaks most clearly about a firm's resilience during economic downturns. This guide starts from the core formula, unpacks the three components, and walks through reading logic that beginners can apply right away.
1. What Is a Balance Sheet? Core Concept and Formula
A balance sheet is a static financial report that captures a company's financial position at a specific point in time (for example, quarter-end or year-end). Alongside the income statement and the cash flow statement, it makes up a company's three core financial statements — together they form a complete picture of the firm's financial reality.
While the income statement focuses on profitability over a period, the balance sheet is more like a "financial snapshot," reflecting how resources are allocated and how funding is sourced at a given moment.
The core concept of a balance sheet is expressed by a simple equation:
Assets = Liabilities + Shareholders' Equity
This identity tells you where the company's funds come from and where they are deployed. The left side (Assets) represents the resources the company currently holds. The right side (Liabilities and Shareholders' Equity) shows the source of those resources — either money borrowed from external creditors, or capital contributed by shareholders.
From an investor's standpoint, the balance sheet serves as an entry point to understand the firm's capital structure — whether it is over-reliant on debt, whether cash reserves are adequate, and whether shareholder equity is compounding over time.
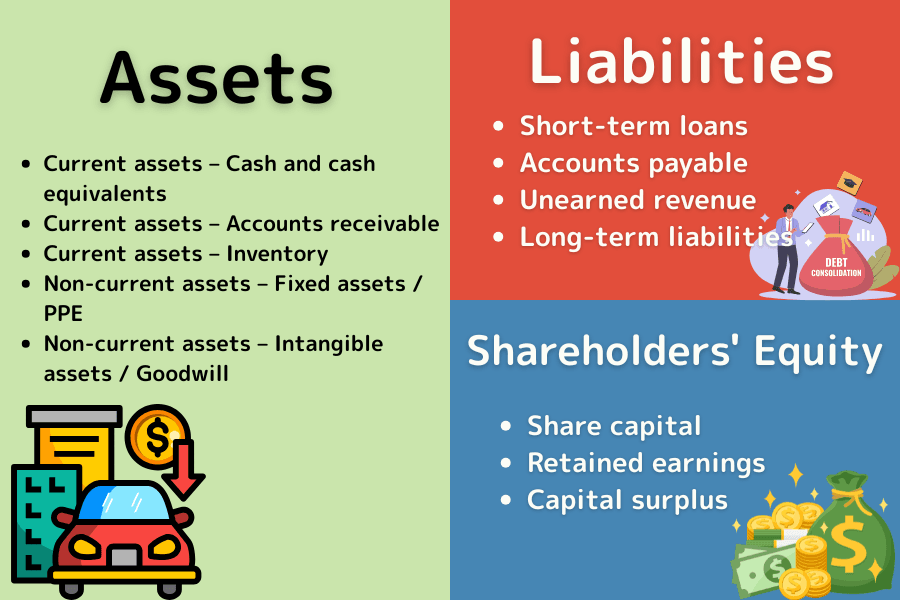
2. The Three Components of a Balance Sheet
Abstract accounting categories become much more intuitive with an everyday example. Imagine you are opening a coffee shop: Mr. Tanaka contributes US$100,000 of his own money and borrows US$50,000 from a bank. The combined US$150,000 goes toward leasing the shop, buying an espresso machine, and stocking beans. In this example, the US$150,000 of shop fit-out and equipment are assets, the US$50,000 bank loan is a liability, and Tanaka's US$100,000 contribution is shareholders' equity.
Component 1: Assets
Assets represent the resources a company owns. Under accounting standards, assets are listed from most to least liquid (speed of conversion into cash), and split into two major categories:
- Current assets: expected to be converted into cash, sold, or consumed within one year — the lifeblood of short-term operations.
- Non-current assets: expected to be used for more than a year, not for sale but to support long-term operations.
| Key Line Item | Description | Coffee Shop Example |
|---|---|---|
| Current — Cash & Cash Equivalents | The most flexible money; bank deposits and short-term marketable instruments. | Cash in the till and the shop's bank balance. |
| Current — Accounts Receivable | Goods sold but not yet collected — represents future cash inflows. | Orders delivered through a food-delivery platform, pending settlement. |
| Current — Inventory | Items held for sale: raw materials, work-in-progress, and finished goods. | Coffee beans, milk, and takeaway cups in the storeroom. |
| Non-current — Property, Plant & Equipment (PPE) | Real estate, factories, and fixed equipment — the physical backbone of operations. | The expensive espresso machine, shop fit-out, tables and chairs. |
| Non-current — Intangible Assets / Goodwill | Non-physical items with value: patents, trademarks, or M&A premiums. | The shop's registered trademark or a proprietary blend recipe. |
Investor takeaway: An unusual spike in accounts receivable or inventory can signal weak sales (inventory pile-up) or collection risk (bad debts) — a common red flag in financial statements.
Component 2: Liabilities
Liabilities represent the company's obligations to external creditors, listed in order of maturity.
| Key Line Item | Description | Coffee Shop Example |
|---|---|---|
| Short-term Debt | Bank loans due within one year. | A small short-term loan taken out to buy raw materials. |
| Accounts Payable | Unpaid amounts owed to suppliers. | Coffee beans purchased from a supplier, payable next month. |
| Deferred Revenue | Money collected in advance before delivering goods or services. | Prepaid coffee vouchers or stored-value card balances. |
| Long-term Debt | Obligations due beyond one year. | A five-year loan originally used to open the shop. |
Investor takeaway: Deferred revenue (such as stored-value cards) is technically a liability but carries no interest cost and signals strong customer loyalty — it is often viewed as "high-quality debt."
Component 3: Shareholders' Equity
Shareholders' equity is the residual value after subtracting total liabilities from total assets — the firm's book value.
| Key Line Item | Description | Coffee Shop Example |
|---|---|---|
| Paid-in Capital | The amount initially contributed by shareholders. | Tanaka's original US$100,000 startup capital. |
| Retained Earnings | Profits kept inside the company rather than distributed as dividends. | The shop earned US$20,000 in year one and retained it to fund a second location. |
| Capital Surplus | Proceeds from share issuance above par, not from operating revenue. | The premium paid by angel investors during a later funding round. |
Investor takeaway: Retained earnings are the fuel for corporate growth. A healthy company should show retained earnings compounding year after year.
3. How to Read a Balance Sheet: A Beginner's Logic
Facing a dense block of numbers, beginners can quickly filter the signal with the following three-step framework.
Step 1: Check the Cash Level
Cash is the lifeblood of any business. By examining the ratio of cash and cash equivalents, you can gauge whether the company has enough liquidity.
If a company reports strong profits but shows very little cash on the balance sheet, funds may be trapped in inventory or unrecoverable accounts receivable — raising the risk of "profitable but insolvent" bankruptcies.
Step 2: Assess the Quality of Liabilities
Not all debt is bad; what matters is the interest burden.
When liabilities are concentrated in accounts payable (from suppliers) or deferred revenue (from customers), the company likely wields strong pricing power in its industry. Such non-interest-bearing debt boosts capital efficiency. Conversely, if short-term debt dominates the balance sheet, a rise in market interest rates can sharply intensify financial pressure.
Step 3: Observe Structure and Trends Over Time
A balance sheet should be read across multiple years, not just a single quarter.
In high-quality firms, shareholders' equity grows steadily and retained earnings compound year after year. If asset growth is driven primarily by expanding debt rather than equity, the company is ramping up leverage — and with it, risk.
4. Key Ratios Derived from the Balance Sheet
Ratio analysis converts raw figures into standardized, comparable metrics.
Ratio 1: Current Ratio
Current Ratio = Current Assets ÷ Current Liabilities.
This ratio measures the ability to cover short-term obligations. Generally, a current ratio above 100% indicates acceptable short-term solvency, while 150%–200% is considered relatively solid — though the appropriate range varies meaningfully by industry.
Ratio 2: Debt Ratio
Debt Ratio = Total Liabilities ÷ Total Assets.
This ratio reflects the company's financial leverage. Manufacturing firms typically cluster around 50%, but the range varies widely by sector — financial institutions, for example, generally operate at much higher debt ratios by design.
Ratio 3: Return on Equity (ROE) — Connected Analysis
ROE = Net Income ÷ Shareholders' Equity.
By combining the balance sheet with the income statement, investors can judge whether a rising ROE is driven by genuine earnings power or simply by higher leverage. Be cautious of companies whose ROE is propped up primarily by aggressive leverage.
5. FAQ: Common Misconceptions for Beginners
Q1: Does a larger total asset base mean a bigger and safer company?
Total assets reflect the scale of resources a firm controls, but size alone does not equal safety. If the bulk of those assets sits in accounts receivable or hard-to-sell inventory, asset quality is poor. True safety requires evaluating both asset quality and the pressure of liabilities.
Q2: Is a very low debt ratio always a sign of a good company?
An unusually low debt ratio may indicate overly conservative management that fails to use financial leverage effectively. Well-run firms tend to maintain a healthy debt range, using low-cost borrowed capital to generate higher returns on equity.
Q3: Why can't the balance sheet alone determine whether a company is good?
The balance sheet captures a moment in time but says nothing about earning power. A capital-rich company without revenue momentum (income statement) or real cash generation (cash flow statement) will ultimately see its asset base shrink. Cross-referencing all three statements is the only way to see the full picture.
Q4: Is it enough to look at a single quarterly balance sheet?
Compare at least four consecutive quarters, or the same quarter year-over-year. A single quarter is too easily distorted by seasonality. Beginners should start with familiar companies such as Apple, Microsoft, or TSMC ADR — first check cash, liabilities, and equity, then layer on ratio analysis.
6. Summary: The Investment Core of the Balance Sheet
The fundamental value of the balance sheet lies in evaluating a company's underlying strength and defensive capability. The simple identity Assets = Liabilities + Shareholders' Equity lays out where a firm's resources come from and how they are deployed.
When reading one, beginners should prioritize cash adequacy, the soundness of the liability mix, and the trajectory of shareholders' equity. Quantitative tools like the current ratio and debt ratio let you screen out financially fragile businesses before committing capital. In volatile markets, a robust balance sheet is the strongest line of defense for protecting investment principal.
Titan FX Trading Strategy Research Institute
The financial markets research team at Titan FX. Produces educational content for investors across a broad range of asset classes, including foreign exchange (FX), commodities (crude oil, precious metals, agricultural products), stock indices, US equities, and cryptocurrencies.
Primary sources: SEC EDGAR, NYSE Listed Companies, International Financial Reporting Standards (IFRS), U.S. GAAP (FASB), Bloomberg, Reuters