Income Statement Explained: From Revenue to Net Income
When reading corporate financials, the income statement is usually the first report most investors encounter. By capturing revenue, costs, and final profit over a period, it offers the most direct read on a company's operating results and earning power.
For investors, the point isn't simply to learn how much a company earned. It's to dissect the sources, structure, and evolution of profit. That dissection reveals growth momentum, cost discipline, and the durability of those earnings.
This guide starts with the definition and core structure of the income statement, walks step-by-step from revenue to net income, highlights the practical read-points that matter most, and ties the income statement to the other two core financial statements so you end up with a complete framework for financial analysis.
- 1. What Is an Income Statement? Core Concept and Structure
- 2. Full Structural Breakdown: From Revenue to Net Income
- 3. How Investors Use the Income Statement to Make Judgments
- 4. Cross-Analysis: Income Statement vs. the Three Core Statements
- 5. FAQ: Common Pitfalls Beginners Run Into
- 6. Summary: The Investment Core of the Income Statement
1. What Is an Income Statement? Core Concept and Structure
The Income Statement (often abbreviated as P/L for Profit and Loss) is a dynamic report recording a company's revenue, costs, expenses, and final earnings over a specific period (usually a quarter or a year). Together with the balance sheet and the cash flow statement, it forms the company's three core financial statements.
The core question the income statement answers is simple: "How much did the company actually earn during this period?" The simplified structure reads as:
- Revenue − Cost of Goods Sold = Gross Profit
- Gross Profit − Operating Expenses = Operating Income
- Operating Income ± Non-operating Items = Pre-tax Income
- Pre-tax Income − Income Tax = Net Income
From this report, investors gauge a company's earning power, cost discipline, and operating efficiency — making it one of the most essential entry points for US-equity fundamental analysis.
2. Full Structural Breakdown: From Revenue to Net Income
To keep accounting concepts concrete, we continue with Mr. Tanaka's coffee shop. After opening his café, last month's data lets us unpack each layer in turn.
Component 1: Revenue
The top line of the income statement — the total money the company collects from selling goods or services. It is the source of all profits, reflecting market demand and company scale. Rising revenue signals that the business is expanding.
- Coffee-shop example: US$100,000 in total receipts from coffee and pastries last month.
Component 2: Cost of Goods Sold (COGS)
Direct costs incurred to produce goods or services; usually proportional to output. It captures production efficiency — the higher COGS runs, the more expensive each cup of coffee becomes to produce.
- Coffee-shop example: US$30,000 spent on coffee beans, milk, and sugar.
Component 3: Gross Profit
Revenue minus COGS. This is the first line of defense for product competitiveness. A higher gross margin usually means the product has differentiation or pricing power.
- Coffee-shop example: 100,000 − 30,000 = US$70,000.
Component 4: Operating Expenses (SG&A + R&D)
The indirect costs needed to keep the business running — fixed overhead paid regardless of volume. It reflects administrative discipline and marketing efficiency, and includes selling expenses, G&A, and research & development.
- Coffee-shop example: US$40,000 for rent, staff salaries, and a flyer campaign.
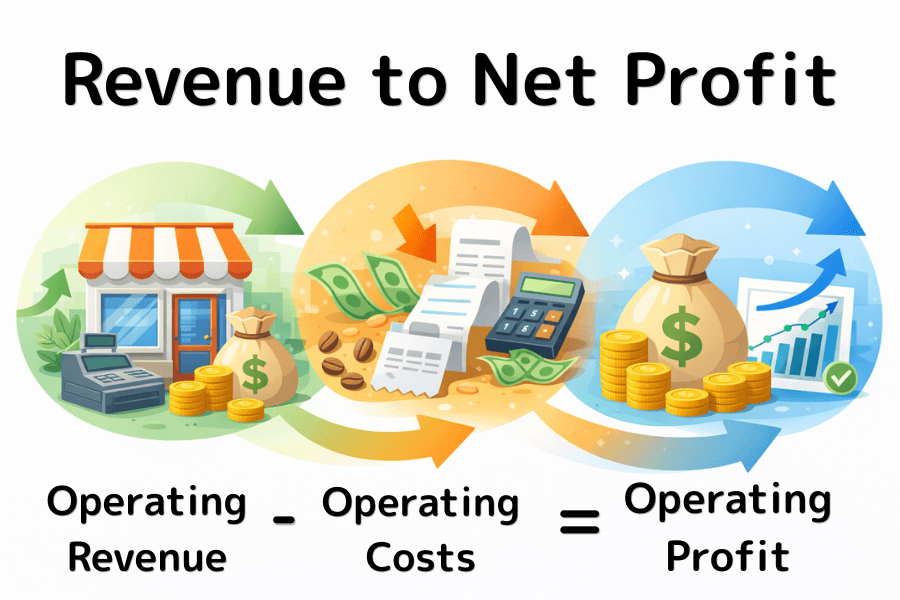
Component 5: Operating Income (EBIT)
Gross profit minus operating expenses — the most telling number on the report. It strips out interest and one-off asset sales to ask a single question: is the core business itself profitable?
- Coffee-shop example: 70,000 − 40,000 = US$30,000.
Component 6: Non-operating Items
Gains or losses generated outside the core business, reflecting financial leverage or investment positions. A company with a core-business loss papered over by non-operating gains warrants extra caution — those earnings may not persist.
- Coffee-shop example: US$2,000 interest paid on the startup loan.
Component 7: Pre-tax Income
The combined total of operating and non-operating results, before taxes are paid to the government. Pre-tax income provides a comparable basis of operating results that is not distorted by the tax regime of any particular country.
- Coffee-shop example: 30,000 − 2,000 = US$28,000.
Component 8: Income Tax
The taxes owed on profits, shaped by national policy and any tax incentives. Pure cost with no revenue offset.
- Coffee-shop example: Assuming a 20% rate, US$5,600.
Component 9: Net Income
The bottom line of the income statement — the amount ultimately attributable to shareholders. It is the final scorecard for investors and the basis on which EPS (earnings per share) is calculated.
- Coffee-shop example: 28,000 − 5,600 = US$22,400.
Here is the consolidated income statement for Mr. Tanaka's coffee shop.
| Line Item | Amount | Key Financial Meaning |
|---|---|---|
| Revenue | 100,000 | Total scale of sales and market acceptance |
| COGS | (30,000) | Raw materials and direct production efficiency |
| Gross Profit | 70,000 | Product quality and technical barrier |
| Operating Expenses | (40,000) | Organizational and marketing control |
| Operating Income | 30,000 | Core-business earning power |
| Non-operating Items | (2,000) | Financial maneuvers and non-recurring impacts |
| Pre-tax Income | 28,000 | Consolidated profitability |
| Income Tax | (5,600) | Tax obligation |
| Net Income | 22,400 | Final profit attributable to shareholders |
3. How Investors Use the Income Statement to Make Judgments
When reading the income statement, avoid the trap of looking only at absolute numbers. Focus instead on the following observation points.
Point 1: Health of the Three Margins
- Gross Margin: A persistent decline may signal new competitors triggering price wars, or runaway raw-material costs.
- Operating Margin: If revenue grows but this margin drops, management costs are likely out of hand — a hollow form of "growth."
- Net Margin: The last line of defense, reflecting overall earning strength.
Point 2: Quality of Earnings (Weight of Non-operating Items)
Quality earnings should concentrate in operating income. If net income spikes because of a one-off property sale or subsidiary divestiture, that earning power will not carry into next year and does not deserve a premium multiple.
Point 3: EPS vs. Revenue Growth Rhythm
Ideally, revenue, operating income, and EPS all rise in sync. If EPS grows while revenue stalls, the company is usually leaning on cost cutting — layoffs or R&D cuts — which can undermine long-term competitiveness.
4. Cross-Analysis: Income Statement vs. the Three Core Statements
The three statements are interlinked; numbers in the income statement eventually resurface in the other two.
| Dimension | Income Statement | Balance Sheet | Cash Flow Statement |
|---|---|---|---|
| Main focus | Whether the company earns money | How much the company has | Where the money actually is |
| Time concept | Cumulative over a period | Balances at a point in time | Dynamic in and out over a period |
| Linkage | Produces net income | Net income rolls into retained earnings | Net income reconciles back to real cash |
How the Three Statements Move Together (A Concrete Example)
When Mr. Tanaka buys a US$50,000 coffee machine: the cash flow statement records a US$50,000 investing outflow. On the balance sheet, fixed assets rise by US$50,000. The expense is not deducted all at once on the income statement; instead, based on its useful life (say, 5 years), US$10,000 in depreciation flows through the income statement each year. This is exactly the divide between the income statement's "cost allocation over time" and the cash flow statement's "lump-sum outflow."
5. FAQ: Common Pitfalls Beginners Run Into
Q1: Revenue jumped but net income shrank — why?
Usually, operating expenses (an aggressive ad campaign, say) or COGS (rising raw-material prices) grew faster than revenue. The company is in a "made noise, lost money" phase, and management needs to audit spending efficiency.
Q2: If the company's net income is high, does that mean it is flush with cash?
Not necessarily. Net income is a book figure that may include receivables the company has not collected. If those receivables cannot be recovered, the company ends up "profitable but cash-poor" — which is exactly why you need to pair the income statement with the cash flow statement.
Q3: Is positive non-operating income a good thing for investors?
Short term, the balance sheet looks better. Long term, it can scatter management focus. Unless the company defines itself as a holding or investment vehicle, recurring asset sales are usually a sign of weakening core operations.
6. Summary: The Investment Core of the Income Statement
The income statement is a compass for evaluating operating efficiency. It clearly records the step-by-step journey from revenue to net income. Investors should focus on whether gross margin stays stable, whether operating income dominates total earnings, and whether EPS growth is driven by the core business. Once you master the income statement, you will not be fooled by the sheer size of a profit number — you will see through to the operating efficiency beneath the figures and find companies with genuinely durable earning power.
Titan FX Trading Strategy Research Institute
The financial markets research team at Titan FX. Produces educational content for investors across a broad range of asset classes, including foreign exchange (FX), commodities (crude oil, precious metals, agricultural products), stock indices, US equities, and cryptocurrencies.
Primary sources: SEC EDGAR, NYSE Listed Companies, IFRS, U.S. GAAP (FASB), Bloomberg, Reuters