EPS ( Earnings Per Share)

EPS (Earnings Per Share) is a financial metric calculated by dividing a company's after-tax net profit by its number of shares outstanding, showing how much profit is attributable to each share. It lets investors compare profitability on a per-share basis and, combined with the P/E ratio (PER), helps assess whether a stock is fairly valued and how fast its earnings are growing.
What makes EPS so useful to investors is that it boils a company's total profit down to a per-share figure, letting firms of very different sizes be compared on the same basis. It is also the denominator behind the price-to-earnings (PER) ratio, which is why EPS is often the first number analysts reach for when judging whether a stock is cheap or expensive.
- EPS (Earnings Per Share) = net income ÷ shares outstanding — a core measure of profitability and shareholder return.
- Formulas: basic EPS = (net income − preferred dividends) ÷ weighted-average shares outstanding; diluted EPS additionally accounts for potential dilution (convertibles, options).
- Reading EPS only makes sense alongside peers, the company's own history, and the P/E ratio.
- Caveats: one-off items, buybacks, and accounting changes can distort EPS — also look at adjusted EPS.
- Key application: the quarterly "EPS surprise" (actual vs estimate) is the single biggest short-term driver of US equity earnings season.
1. What Is EPS (Earnings Per Share)?
EPS (Earnings Per Share) measures how much after-tax net income a company generates per share of common stock over a given period. It is a fundamental gauge of corporate profitability.
If EPS is stable or trending higher year after year, the company typically has solid operations and growth potential. Conversely, erratic or declining EPS can signal deteriorating profitability. EPS is among the most widely cited data points in equity investing, and a key input for valuing stocks and judging a company's financial health.
2. How to Calculate EPS
Earnings Per Share (EPS) measures how much after-tax net income a company generates per share of common stock.
EPS Formula
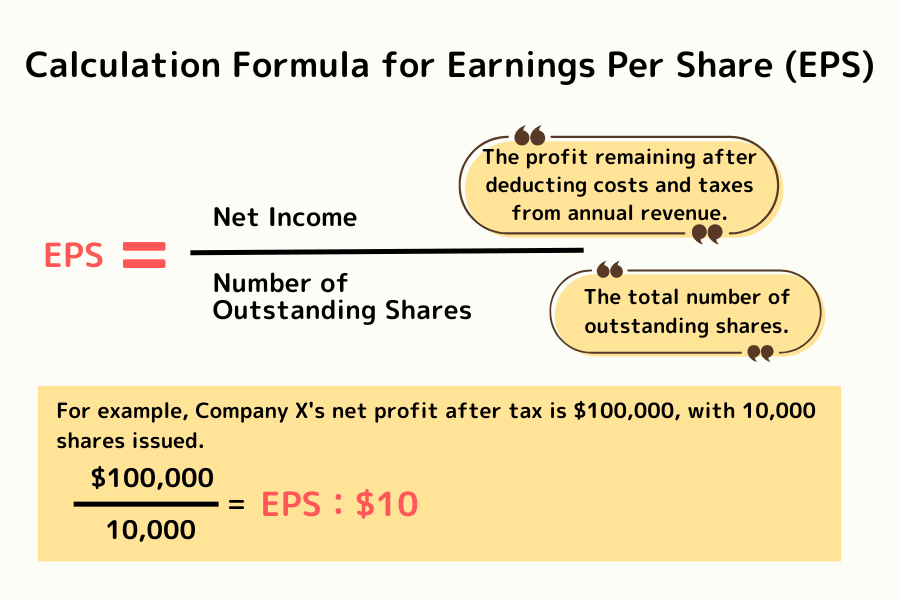
EPS = After-Tax Net Income ÷ Shares Outstanding
- After-Tax Net Income: The company's total profit for the period after deducting costs and taxes.
- Shares Outstanding: Usually the total number of common shares in circulation in the public market. In practice, the weighted average shares outstanding is used to compute EPS.
EPS Calculation Example
Suppose Company X has an after-tax net income of $100,000 and 10,000 shares outstanding.
Calculation: $100,000 ÷ 10,000 = $10 EPS per share
Note:
This example is simplified. Real-world calculations use the weighted average shares outstanding and account for potential dilution (convertibles, warrants, stock options) to avoid distortion.
EPS Growth Rate — Calculation and Meaning
Looking at a single year's EPS isn't enough — the growth trajectory matters more.
The EPS growth rate tells investors whether profitability is steadily improving.
EPS Growth Rate Formula
EPS Growth Rate = (Current EPS − Prior EPS) ÷ Prior EPS × 100%
EPS Growth Rate Example
Suppose Company X had EPS of $8 last year and $10 this year.
Calculation: ($10 − $8) ÷ $8 × 100% = 25%
Company X's EPS growth rate of 25% indicates a meaningful profit improvement.
Why EPS Growth Rate Matters
- Tracks profitability stability: Consistent EPS growth reflects healthy operations.
- Smooths one-off noise: Single-year EPS can be distorted by non-recurring events; the growth rate gives a cleaner read on underlying quality.
- Gauges growth potential: Fast-growing companies typically earn higher market valuations.
3. Types of EPS
EPS comes in two main flavors: Basic EPS and Diluted EPS. Understanding the difference helps investors evaluate true profitability more accurately.
EPS Type Comparison
| Type | Description | Calculation |
|---|---|---|
| Basic EPS | The most commonly cited EPS — uses current outstanding shares only, ignoring potential dilution. | After-tax net income ÷ Weighted average shares outstanding |
| Diluted EPS | Accounts for potential shares (convertibles, warrants, employee options); more conservative. | After-tax net income ÷ Weighted average shares (including potential shares) |
4. How to Interpret EPS
EPS numbers alone don't tell the whole story. Investors need to interpret EPS from multiple angles to make sound judgments.
Interpreting EPS
| Dimension | What It Means |
|---|---|
| Absolute EPS level | Generally, higher EPS = stronger profitability = better for shareholders. But cross-industry comparisons can be misleading. |
| EPS growth trend | Consistently rising EPS typically reflects stable operations and long-term investment value. Sharp swings warrant deeper investigation. |
| Comparison with prior periods | Year-over-year or multi-year comparisons reveal whether profitability is expanding or contracting. |
| vs Market expectations | When reported EPS beats consensus, the stock often rallies; misses typically trigger sell-offs. Market sentiment around EPS is powerful. |
| One-off EPS anomalies | EPS can be distorted by one-time gains or losses (asset sales, restructuring). Filter these out before drawing conclusions. |
5. Key Considerations When Using EPS
When analyzing EPS, two considerations are especially important:
5.1: Changes in Share Count Affect EPS
EPS = After-tax net income ÷ shares outstanding, so EPS moves with both profit and share count.
Investors must watch for share-count changes that move EPS independently of actual earnings growth.
For example:
- Share buybacks: Shares outstanding decrease, pushing EPS higher.
- Stock splits: Shares outstanding increase, lowering per-share EPS.
EPS changes therefore aren't always about operating performance — they can reflect capital-structure moves too.
5.2: Don't Evaluate Using EPS Alone
Although EPS is an important input for evaluating profitability and growth, it shouldn't be used in isolation.
EPS can be distorted by share count changes, one-off events, or financial engineering, so investors should also look at:
- PER (Price-to-Earnings Ratio)
- PBR (Price-to-Book Ratio)
- ROE (Return on Equity)
- BPS (Book Value Per Share)
A multi-metric approach gives a much clearer picture of true value and risk.
6. Frequently Asked Questions (FAQ)
Q1. Is there a standard benchmark for EPS?
EPS is affected by each company's share count and capital structure — there is no universal benchmark. High EPS doesn't automatically mean a company is better, but within the same industry, a higher EPS typically signals stronger profitability and tends to attract more market attention.
Q2. How do EPS, PER, and Earnings Yield differ?
EPS (Earnings Per Share) reflects per-share profitability. PER (Price-to-Earnings Ratio) = Price ÷ EPS, used to judge whether a stock is cheap or expensive — a lower PER is cheaper. Earnings Yield = EPS ÷ Price, the reciprocal of PER; a higher earnings yield means a cheaper stock.
Q3. What other metrics relate closely to EPS?
EPS is closely tied to a company's dividend policy, especially the Dividend Payout Ratio: Dividend per Share ÷ EPS × 100%. The payout ratio reveals whether a company prefers high dividends or retaining earnings for reinvestment. Generally, the more stable the EPS, the more stable the dividend — a positive sign for income-focused investors.
Q4. Can EPS be compared directly across different industries or company sizes?
Not recommended. Capital structure and earnings models vary widely across industries: technology stocks (like U.S. tech majors) often have higher EPS and growth rates; financials and traditional sectors typically have lower absolute EPS due to capital intensity and larger share counts. The most meaningful comparisons are within the same industry and similar company sizes, or the same company across different periods. Cross-industry comparisons require supplementary metrics like ROE and margins.
Q5. When do companies report EPS, and how should investors approach earnings season?
U.S. stocks report quarterly (Q1: Apr-May, Q2: Jul-Aug, Q3: Oct-Nov, Q4: Jan-Feb). Earnings season is when EPS releases cluster, and stocks often move sharply based on whether results beat or miss expectations. Strategies: (1) Check the Titan FX Economic Calendar ahead of time for reporting schedules and consensus estimates; (2) Consider trimming positions before earnings to reduce overnight risk; (3) Avoid opening large new positions around earnings calls.
Q6. How does EPS interpretation differ for growth vs value stocks?
Growth stocks (AI, semiconductors, cloud services) typically have high EPS growth rates (20%+ annually) even if the absolute EPS number is modest; markets grant them higher PERs to reflect future expectations. Value stocks (utilities, financials, consumer staples) have slower EPS growth (low single digits) but stable cash flow and higher payout ratios; markets assign lower PERs and investors buy primarily for steady dividend income. Identifying which category a company belongs to is essential for interpreting EPS correctly.
7. Conclusion
EPS is a cornerstone metric in investment analysis, showing how much profit a company generates per share. But EPS movements aren't driven solely by earnings — they're also affected by capital-structure changes.
Investing on EPS alone is not enough. Combining EPS with PER, ROE, payout ratio and other metrics gives a far more complete view of a company's true value and risks.
Further Reading
- GDP (Gross Domestic Product) — Macro momentum drives corporate EPS expectations.
- Unemployment Rate — How labour-market dynamics link to corporate earnings.
- Inflation — How inflation affects corporate margins and EPS.
- Insider Trading — The regulatory boundary around pre-earnings trading.
- IPO (Initial Public Offering) — How post-IPO share dilution affects EPS.
- Asset Allocation — Stock-selection strategies combining EPS with P/E.
The Titan FX Research team covers global macroeconomic indicators, foreign exchange (FX), commodities (oil, precious metals, agriculture), equity indices, US stocks, and crypto assets, producing educational content for investors and traders.
Primary Sources by Category
- Official data and regulators: Financial Accounting Standards Board (FASB) — ASC 260 Earnings Per Share; International Financial Reporting Standards (IFRS) — IAS 33 Earnings Per Share; U.S. Securities and Exchange Commission (SEC) — Regulation S-K disclosure rules.
- Exchanges and market data: S&P Global — S&P 500 EPS aggregates; FactSet — S&P 500 Earnings Insight (weekly); Refinitiv I/B/E/S — consensus EPS estimates; Bloomberg, Reuters.
- Media and historical references: Bloomberg, Reuters, Wall Street Journal, Financial Times; the 2008 GFC (S&P 500 EPS dropped roughly 90%), the 2020 COVID episode (short-term EPS drawdowns), the 2023–2024 AI-driven EPS surges at NVDA / TSMC, and the all-time-high EPS prints at Apple / Microsoft.