What Is the Unemployment Rate? Definition, Types, and Market Impact

In financial markets, the unemployment rate is used as a gauge of economic health. Each release can trigger significant moves in global forex, equities, and commodities.
For investors, understanding the unemployment rate is more than reading the news — it is also about decoding the future direction of monetary policy. Why does having more people without jobs shake stock markets? And how can this indicator help you anticipate signs of recession?
This article starts from the core definition, walks through how unemployment drives asset prices via consumption and policy channels, and shows how to interpret market reactions in practice.
- What the unemployment rate measures, and why it does not count everyone without work
- The differences between frictional, structural, cyclical, and seasonal unemployment
- How unemployment affects equities, FX, bonds, gold, and real estate through spending and policy expectations
- How to read unemployment data together with NFP, wage growth, and labor-force participation
- Where to check current releases through Titan FX and official data sources
1. What Is the Unemployment Rate? Core Definition and Formula
The unemployment rate measures the proportion of the labor force that is not being utilized. Statistically, it does not simply count people without a job — there is a strict definition.
The formula is: Unemployment Rate = (Unemployed / Labor Force) × 100%
Common Beginner Misunderstanding
The most common misunderstanding is treating everyone without a job as unemployed. In economics, "labor force" only includes people who have the intent to work and are actively looking for a job. Full-time students, homemakers, retirees, and "discouraged workers" who gave up looking after long periods are not counted in the labor force.
2. A Deeper Look: The Four Types of Unemployment
Unemployment does not always equal recession. Based on root causes, it can be divided into four categories.
Type 1: Frictional Unemployment
A normal career-transition period — recent graduates sending out resumes, or people who voluntarily quit to look for a better role. It is typically short-term and healthy, reflecting flexibility in the labor market.
Type 2: Structural Unemployment
Arises when industry structure shifts and workers' skills no longer match market demand. For example, as AI advances, some traditional manual tasks are replaced. Adjustment takes longer and usually requires retraining.
Type 3: Cyclical Unemployment
The type investors watch most closely. When the economy weakens and demand shrinks, companies cut headcount to survive. A rise in cyclical unemployment is often a strong signal of recession.
Type 4: Seasonal Unemployment
Driven by seasonal or holiday cycles. Ski instructors unemployed in summer or farmers idle during fallow periods are typical examples. This variation is largely predictable.
3. How High and Low Unemployment Affect Assets
Changes in unemployment ripple through spending power, corporate profit, and central bank policy into equities, real estate, and other assets. Both unusually low and unusually high readings can matter, but for different reasons.
Scenario 1: Low Unemployment
When unemployment is low, the labor market is stable, most people earn steady income, and willingness to spend is high.
Company revenues and earnings rise, which supports equities. Real estate also tends to see both higher prices and higher transaction volume as purchase demand expands.
But if unemployment is too low, the labor market can overheat. Companies raise wages aggressively to compete for talent, fueling inflation. Central banks then tighten by raising rates, which lifts corporate borrowing costs and mortgage payments — pressuring both equities and housing.
Scenario 2: Rising Unemployment
When unemployment keeps rising, households worry about future income and cut nonessential spending.
That consumption slowdown hits corporate revenue directly, and equities tend to face corrective pressure; real-estate prices and volumes soften. A sharp rise in cyclical unemployment is often a warning sign of an economic downturn.
Against this backdrop, capital typically flows to safer havens such as gold and government bonds. If the rise is too fast, central banks may pivot from hikes to cuts to stimulate the economy, which often lifts bond prices.
Overall, the unemployment rate is a key bridge between the labor market and asset prices. Beyond the headline number, investors should also consider the cycle stage and potential cascading effects — that yields a clearer view of how it will affect their portfolios.
4. Practical Walkthrough: Linking NFP and the Unemployment Rate
In real trading, the unemployment rate is rarely read in isolation. It is observed together with other employment data, the most important of which is the monthly U.S. Non-Farm Payrolls (NFP) report. NFP covers new jobs, the unemployment rate, and wage growth, making it a key indicator for tracking the U.S. economy and a major source of market volatility.
How NFP and the Unemployment Rate Differ
NFP shows how payroll jobs changed, while the unemployment rate shows the share of the labor force that is unemployed. Combining the two paints a more complete picture of the labor market.
If new hiring continues to rise and unemployment stays low, companies are still expanding and the labor market is steady. If new hiring weakens while unemployment climbs, the economy may be cooling.
Mechanism: Why These Data Move Markets
When setting rate policy, the Fed weighs both employment and inflation. A too-strong labor market brings wage pressure and inflation, leaning toward keeping rates elevated; weakening employment may prompt rate cuts to stimulate growth.
Markets move sharply on release because investors instantly update their expectations for rates and the outlook.
How Beginners Should Read the Data
The most important principle is comparing "market expectation" with "actual release." Significantly above or below expectations tends to drive big market moves.
With that core in mind, beginners can observe trends through several lenses. First, month-on-month change — several consecutive months of gradual decline suggest a steady labor-market improvement; a sudden jump deserves caution as a possible slowdown signal.
Year-on-year comparison can tell you whether conditions have improved or deteriorated relative to last year. Looking longer, comparing current unemployment with the 10-year average or natural rate reveals whether the market is running hot or cool.
Labor-force participation is another important supplementary indicator. If unemployment is falling but more people are also leaving the labor market, the improvement may not be as strong as it appears.
Building the habit of "expectation vs actual + multi-indicator observation" helps you more accurately judge the Fed's likely policy direction and the implications for equities, FX, and bonds.
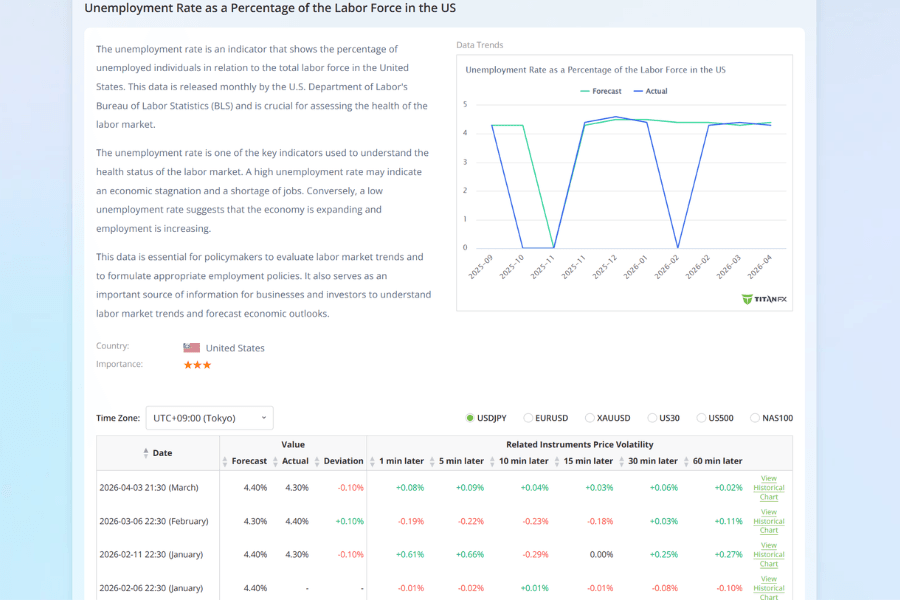
Titan FX provides a U.S. unemployment rate economic indicator page, which is useful for comparing historical trends with each release.
5. Summary: Building a Macro Data-Reading Mindset
The unemployment rate is a key indicator linking the labor market with financial markets, and its changes come from multiple forces — the business cycle, industry transformation, and labor-force participation. By understanding the formula and four types, beginners can better grasp what the data really means.
From an investment standpoint, the unemployment rate influences equities, FX, and bonds via consumption, corporate profit, and monetary policy. In practice, watch it alongside NFP and focus on the gap between actual release and market expectation.
Building a steady reading habit — and zooming out from a single data point to the whole economic context — helps investors respond to market swings with more reason. As your understanding deepens, you can make consistent, well-grounded decisions in a changing environment.
6. FAQ
Is a lower unemployment rate always better?
Not always. Low unemployment usually signals a strong labor market, but an overly tight market can add wage and inflation pressure, which may keep interest rates higher.
Does the unemployment rate count everyone without a job?
No. Official unemployment measures generally count people who are jobless, available to work, and actively looking for work. People who stopped looking are usually outside the labor force.
How should traders compare unemployment with NFP?
NFP shows the change in payroll jobs, while the unemployment rate shows the broader labor-market condition. Wages and labor-force participation help confirm the signal.
How can rising unemployment affect markets?
If rising unemployment points to weaker demand, equities and real estate can come under pressure. At the same time, rate-cut expectations may support bond prices.
Further Reading
Titan FX Trading Strategy Research Institute
The financial market research team at Titan FX. We produce educational content for investors covering forex (FX), commodities such as crude oil, precious metals and agricultural products, stock indices, U.S. equities, and cryptocurrencies.
Primary Sources by Category
- Official labor-market data: BLS CPS Concepts and Definitions, BLS Employment Situation, FRED UNRATE
- Central-bank policy reference: Federal Reserve monetary policy goals
- Titan FX related page: U.S. unemployment rate economic indicator