 Home
Home- Investment Guide: Strategies for Stocks, Forex, and Metals
- PER, PBR, EPS & BVPS Explained: Definitions and Formulas
PER, PBR, EPS, and BVPS Explained: Four Essential Stock-Analysis Metrics
PER, PBR, EPS, and BVPS are the four core metrics of stock fundamental analysis. EPS (earnings per share) and BVPS (book value per share) come straight from the financials, capturing a company's earning power and per-share assets; PER (= price ÷ EPS) and PBR (= price ÷ BVPS) bring the share price in to judge whether a stock is expensive or cheap relative to its earnings and assets.
When you ask whether a stock is "expensive or cheap, worth buying or not," the share price alone tells you nothing — a 100-dollar stock is not necessarily pricier than a 50-dollar one. What matters is placing the price back against the company's earnings and assets, and that is exactly what PER, PBR, EPS, and BVPS answer.
These four metrics look independent but actually come from the same financial statements and are tightly linked. Using one relationship diagram plus formulas and examples, this article walks you through how each is calculated, how they connect, and how to use them when picking stocks.
- How EPS and BVPS are calculated and what each reveals about earnings and per-share assets
- How PER and PBR use the share price to gauge valuation
- A diagram linking the four metrics to the balance sheet and P&L
- Whether higher or lower is better for each metric, and which sectors they suit
- Why a single metric is unreliable and needs to be combined
1. How the Four Metrics Connect: Reading PER/PBR/EPS/BVPS from the Financials
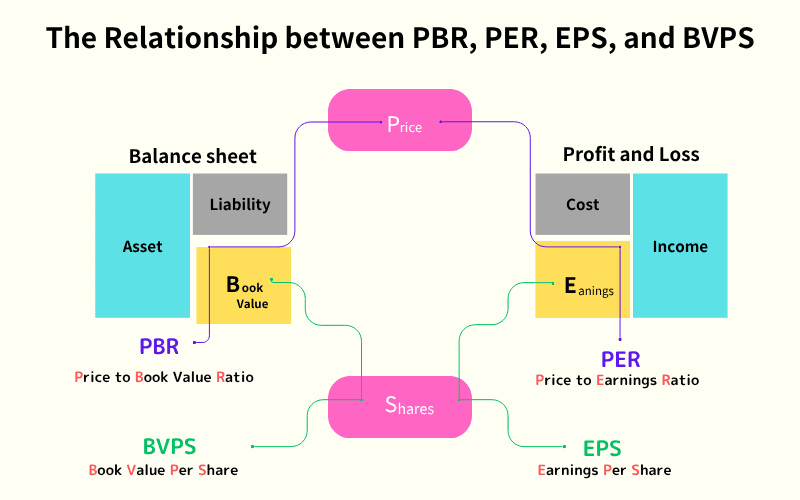
The diagram above lays out where all four metrics come from. The left side is the balance sheet — built around assets, liabilities, and net assets, from which BVPS and PBR are derived. The right side is the profit and loss statement, where revenue and costs produce earnings, which in turn give EPS and PER. The top of the chart is the share price (Price) and the bottom is shares outstanding (Shares) — the two that run through every calculation.
In other words, the logic boils down to two lines:
- Divide net assets by shares → BVPS; then compare with price → PBR
- Divide earnings by shares → EPS; then compare with price → PER
Once you grasp "first convert to a per-share figure using shares outstanding, then compare against the price," the four metrics stop being scattered and become a single, coherent valuation toolkit.
2. PBR (Price-to-Book Ratio)
PBR compares a company's share price with its book net assets — how many times the book value the market is willing to pay.
PBR = Share price ÷ Book value per share (BVPS)
For example, if a company's BVPS is 50 and the share price is 100, the PBR is 2.
How to read a high or low PBR:
- High PBR: the market is optimistic and expects future growth
- Low PBR: possibly undervalued, or a sign of weak fundamentals
PBR is especially useful for asset-heavy companies (banks, real estate) but does not always fit tech or growth stocks. PBR alone is not enough — pair it with other metrics.
3. BVPS (Book Value Per Share)
BVPS is the book net assets represented by a single share — in theory, how much each shareholder would receive per share if the company were liquidated today. It refers to the same thing as the common abbreviation BPS.
BVPS = Net assets ÷ Shares outstanding
For example, if net assets are 1 billion and 100 million shares are outstanding, BVPS is 10.
What BVPS tells you:
- Helps gauge a "floor value" for the share price
- A price far below BVPS can signal undervaluation
- Often paired with PBR for value assessment (since PBR = price ÷ BVPS)
That said, book net assets follow accounting rules and may not capture brand value or future earning power, so BVPS is a reference — not a standalone metric.
4. PER (Price-to-Earnings Ratio)
PER measures the relationship between a company's share price and its earnings per share — how many times each dollar of profit an investor is willing to pay.
PER = Share price ÷ Earnings per share (EPS)
For example, if EPS is 5 and the share price is 100, the PER is 20.
How to read a high or low PER:
- High PER: the market expects growth and pays a high multiple for earnings
- Low PER: possibly undervalued, or low growth and weak confidence
PER is one of the most common ways to judge whether a stock is "expensive" or "cheap," but a reasonable multiple varies widely by sector, so it cannot be applied uniformly. Note too that EPS is a trailing figure and does not fully represent the future.
5. EPS (Earnings Per Share)
EPS is how much a company earns per share — profit divided by shares outstanding — and is a basic measure of earning power.
EPS = Net profit ÷ Shares outstanding
For example, if net profit is 500 million and 100 million shares are outstanding, EPS is 5.
What EPS is used for:
- The higher the EPS, the stronger the earning power
- Investors pair EPS with the share price to compute PER
- Steady EPS growth tends to pull the share price up over time
However, EPS can be distorted by one-off gains or accounting choices, so view it alongside revenue growth, ROE, and other metrics for a fuller picture.
6. Frequently Asked Questions (FAQ)
Q1: What is the difference between PER and PBR?
PER measures valuation against earnings (price ÷ EPS), while PBR measures it against net assets (price ÷ BVPS). The first looks at earning power, the second at asset backing.
Q2: What PER counts as reasonable?
There is no absolute standard — it depends on the sector. Growth stocks tend to carry high PERs, traditional or cyclical stocks lower ones; compare against peers and the stock's own history.
Q3: Are BVPS and BPS the same?
Yes. BVPS (book value per share) and the common abbreviation BPS refer to the same thing. This article uses BVPS throughout.
Q4: Does a higher EPS always mean a better buy?
Not necessarily. High EPS signals strong earnings, but if the price is also high the PER may be expensive; EPS can also be inflated by one-off gains, so check whether it is sustainable.
Q5: Can these four metrics be used on their own?
Not advisable. A single metric is easy to misread; in practice EPS, PER, BVPS, and PBR are combined and viewed alongside ROE, revenue growth, and sector outlook.
7. Summary: Master the Key Metrics and Build a Stock-Picking Framework
When trading stocks or stock CFDs, understanding PER, PBR, EPS, and BVPS lets you assess company value and price levels far more systematically. In short:
- EPS: earnings per share — reflects earning power
- PER: price-to-earnings ratio — gauges whether valuation is reasonable
- BVPS: book value per share — the basis for assessing asset value
- PBR: price-to-book ratio — used to judge over- or under-valuation
Each metric is limited on its own; in practice they are viewed together and combined with sector structure, market sentiment, and company outlook to reach a logical trading decision. If you trade stock CFDs with Titan FX, these fundamentals are a key reference when analysing a stock's trend and volatility potential.
Further Reading
- What Is the Price-to-Earnings Ratio (PER)?
- What Is Earnings Per Share (EPS)?
- What Is Return on Equity (ROE)?
- How to Trade US Stock CFDs on MT5
Titan FX's financial-market research team. We cover a broad set of instruments — foreign exchange, commodities (crude oil, precious metals, agricultural products), equity indices, US equities, and digital assets — producing educational content for investors.
Primary Sources (by Category)
- Metric definitions: Investopedia — P/E Ratio, Investopedia — P/B Ratio
- Per-share metrics: Investopedia — EPS, Investopedia — Book Value Per Share
- Valuation methods: Corporate Finance Institute — Valuation Multiples