PER(Price-to-Earnings Ratio)

The PER (Price-to-Earnings Ratio, or P/E) is a core valuation metric calculated by dividing a stock's price by its earnings per share (EPS), showing how much investors pay for each unit of a company's profit. A lower ratio generally signals a cheaper valuation, but the "fair" range varies by industry and growth profile, so it is best read alongside PBR and ROE.
Among all valuation tools, the PER is the most popular because it distils "is this stock expensive?" into a single intuitive multiple — how many times earnings investors are willing to pay for each dollar a company earns. Yet the very same multiple can mean completely different things for a growth stock versus a cyclical one.
This article explains PER's definition, calculation methods, practical applications, and key considerations to help you make informed investment decisions.
- What the Price-to-Earnings (P/E or PER) ratio represents and why it matters
- How to calculate P/E and interpret it across industries
- Trailing vs. Forward P/E: when each is appropriate
- Common pitfalls when relying on P/E alone for investment decisions
- How to combine P/E with PBR, ROE, and other metrics for sound valuation
1. What is PER?
The Price-to-Earnings Ratio (P/E, PE, or PER), is a critical financial metric that measures the ratio of a stock's price to its earnings per share (EPS).
In simple terms, it shows how much investors are willing to pay for each dollar of a company's earnings.
PER is widely used to evaluate whether a stock is overvalued or undervalued:
| PER Level | Interpretation |
|---|---|
| High PER | Indicates higher market expectations for future growth, but may also signal overvaluation or risk premiums. |
| Low PER | Suggests the market is conservative about the company's prospects or that the stock is undervalued. |
For example, a PER of 20 means investors pay $20 for every $1 of earnings, reflecting confidence in the company's growth potential.
※ Note: PER standards vary by industry. Always compare within the same sector and consider fundamentals.
Comparing Stock Price, EPS, and PER
When evaluating companies in the same industry, analyze the relationship between stock price, EPS, and PER to identify better investment opportunities:
| Stock Price | EPS | PER | Key Insight |
|---|---|---|---|
| Same | Higher EPS | Lower PER | Higher EPS means stronger profitability and faster cost recovery. |
| Lower Price | Same | Lower PER | Lower price with the same EPS means better cost efficiency. |
| Varies | Varies | Lower PER | Lower PER generally indicates better relative value. |
2. How to Calculate PER with Examples
Formula
PER = Stock Price ÷ Earnings Per Share (EPS)
- Stock Price: Current market price.
- EPS: Net profit divided by total shares outstanding (usually based on the last 12 months).
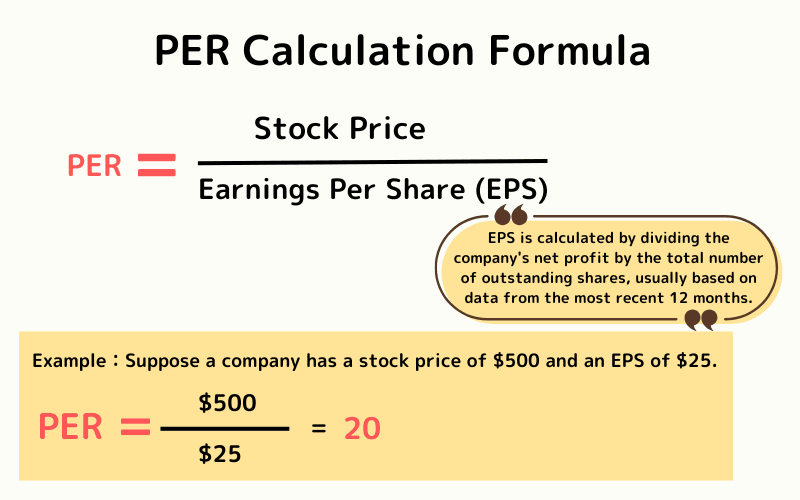
Example
Suppose Company A and Company B:
- Company A: Stock price = $500, EPS = $25
- PER = 500 ÷ 25 = 20x
- Company B: Stock price = $500, EPS = $50
- PER = 500 ÷ 50 = 10x
Though both stocks are priced at $500, Company B's lower PER suggests better earnings efficiency. Company A's higher PER may reflect growth expectations.
Types of PER
| Type | Description |
|---|---|
| Trailing PER | Uses actual earnings from the past 12 months (TTM). Most common and reliable. |
| Forward PER | Based on analysts' future 12-month earnings estimates. Reflects growth potential but carries higher uncertainty. |
Trailing PER is widely preferred for its reliance on reported financials, while Forward PER is often used for growth stocks.
3. What Does PER Tell Us?
3.1. Relative Valuation
- High PER: Could signal market optimism (e.g., tech growth stocks) or overvaluation.
- Low PER: May indicate undervaluation (e.g., mature industries) or underlying challenges.
Example: TSMC (a growth stock) often trades at 20-30x PER due to semiconductor demand, while utilities may hover at 10-15x.
3.2. Market Expectations
PER reflects investor sentiment:
- Growth Stocks (e.g., tech/biotech): High PER due to anticipated earnings growth.
- Value Stocks (e.g., banks/utilities): Low PER due to stable but slow growth.
3.3. Benchmarking
Compare PER to:
- Industry peers: Assess relative positioning.
- Historical PER: Identify deviations from long-term trends.
Example: A tech stock with a PER of 25 may still be reasonable if the sector average is 30.
4. Key Considerations When Using PER
4.1. Industry Variations
"Reasonable" PER ranges differ by sector:
- Tech: 20-40x (high growth).
- Finance: 10-15x (stable earnings).
Always compare within the same industry.
4.2. Earnings Volatility
PER relies on EPS, which can distort during disruptions (e.g., pandemic losses):
- Negative/very low EPS makes PER meaningless.
- Verify earnings consistency with financial statements.
4.3. Complementary Metrics
Combine PER with:
- PBR (Price-to-Book Ratio): Asset-backed valuation.
- ROE (Return on Equity): Capital efficiency.
Example: A low-PER stock with declining ROE may signal stagnation, not value.
5. PER FAQs
Q1. What is a "good" PER range?
No universal standard, but ~15x is a common reference:
Greater than 15x : Growth expectations (evaluate sustainability).
Less than 15x : Could be undervalued or facing headwinds.
Example: S&P 500 average PER is typically 15-20x; tech stocks often exceed 30x.
Q2. PER vs. PBR – What’s the difference?
| Metric | Focus | Calculation | Use Case |
|---|---|---|---|
| PER | Profitability | Price ÷ EPS | Earnings potential |
| PBR | Asset value | Price ÷ Book Value | Safety margin |
PER measures earnings efficiency; PBR assesses balance sheet strength.
Q3. Is a high PER always bad?
Not necessarily. High PER may reflect strong growth prospects (e.g., AI, EVs). However, unsupported high PER increases risk.
Tip: Research financials and industry trends to validate valuations.
Q4. How do you interpret P/E for loss-making companies?
When EPS is negative, P/E becomes mathematically negative or undefined, so it loses its evaluative meaning. In such cases, alternative metrics are used:
- P/S (Price-to-Sales) ratio: revenue-based valuation
- EV/EBITDA: enterprise value relative to earnings before interest, tax, D&A
- Cash-flow metrics: operating cash flow or free cash flow (FCF)
These sales- and cash-flow-based metrics are particularly useful for growth-stage companies that have yet to achieve profitability.
Q5. What are the practical steps for individual investors using P/E?
- Compare against 3-5 industry peers to gauge relative positioning
- Check the 5-10 year P/E range to see how the current level deviates from the long-term mean
- Benchmark against index P/E (S&P 500, Nasdaq, TOPIX)
- Combine with other metrics: P/B, ROE, dividend yield, debt-to-equity
Building these comparisons into your routine prevents reading P/E as a standalone signal and reveals the full valuation picture.
6. Conclusion
PER measures how much you pay for $1 of earnings. High PER suggests growth expectations; low PER may indicate value or stagnation.
Key takeaways:
- Compare PER within industries and historical ranges.
- Combine with PBR, ROE, and other metrics.
- Account for sector dynamics and company specifics.
While PER is a useful starting point, always supplement it with deeper financial and market analysis.
Further Reading
- EPS (Earnings Per Share): Calculation and Practical Use
- NASDAQ Composite Index Overview
- CPI (Consumer Price Index) Explained
- CME Group (Chicago Mercantile Exchange) Overview
The financial markets research team at Titan FX. We produce educational content across a broad range of instruments, including forex (FX), commodities (crude oil, precious metals, agricultural products), equity indices, U.S. stocks, and crypto assets.
Primary Sources (by category)
- Valuation fundamentals: Investopedia — Price-to-Earnings Ratio (P/E Ratio), CFA Institute — Equity Valuation
- Market P/E benchmarks: S&P Dow Jones — S&P 500 P/E Ratio, Multpl — S&P 500 P/E Ratio history
- Industry P/E reference: NYU Stern — Industry PE Ratios (Damodaran data)