ROE (Return on Equity)
When sizing up a "good company" for stock investing, the sheer size of revenue or profit is not enough. The same profit can reflect very different efficiency depending on how little equity was used to earn it — and ROE captures that efficiency at a glance.
- Definition of ROE (Return on Equity) and how it measures capital efficiency
- ROE calculation formula and DuPont decomposition (net margin × asset turnover × leverage)
- Why US S&P 500 ROE structurally exceeds Japan's TOPIX 500 ROE
- Pitfalls of ROE: leverage manipulation, buybacks, and one-off special gains
- Practical framework: combining ROE with ROA, PBR, and PER for investment decisions
1. Overview of ROE (Return on Equity)
ROE, or Return on Equity, is a key financial metric that measures a company's ability to generate profits from shareholders' equity. It serves as a benchmark for assessing how efficiently a company is utilizing shareholders' capital to generate income.
A high ROE indicates that a company is effectively leveraging its equity to create profits, reflecting strong management and capital efficiency. Conversely, a low ROE may suggest inefficiencies in the company’s operations or business model.
This article explains the definition of ROE, its calculation method, and its role in investment strategies.
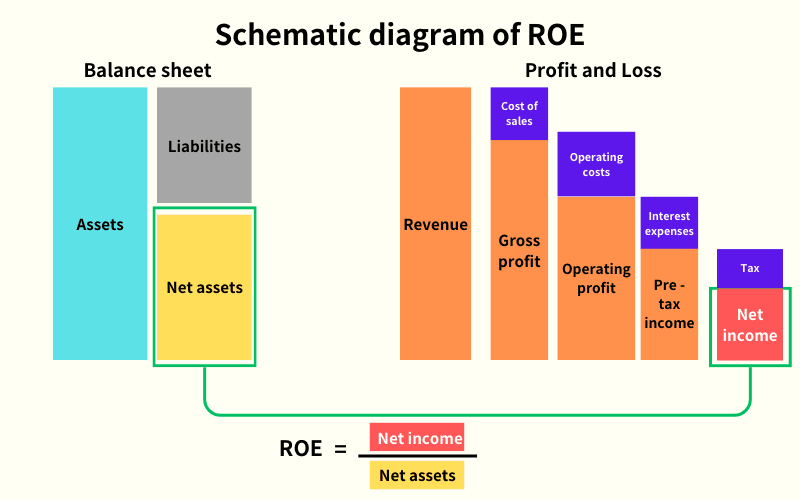
2. How to Calculate ROE
ROE (%) = Net Profit ÷ Shareholders' Equity × 100
- Net Profit: The profit generated by a company in a fiscal year for all shareholders.
- Shareholders' Equity: The shareholders' investment, representing the company’s net assets (excluding liabilities such as bank loans).
For example: If a company has raised $100 million in equity and achieves a net profit of $50 million in a fiscal year:
ROE = $50 million ÷ $100 million × 100% = 50%
This calculation indicates the company achieved a 50% return on its shareholders' equity.
3. What Can ROE Tell Us?
ROE reflects how much profit a company generates relative to its shareholders' equity. Generally:
- A higher ROE suggests that the company efficiently uses equity to generate profits.
- A lower ROE may signal poor operational efficiency or ineffective capital utilization.
Typically, an ROE between 8% and 10% is considered acceptable. Companies with ROE exceeding 10% are often viewed as high-quality investments. However, average ROE can vary across industries, so it’s essential to consider sector-specific benchmarks.
4. ROE: A Comparison Between the U.S. and Japan
A comparison of companies from the S&P 500 Index (U.S.) and the TOPIX 500 Index (Japan) reveals significant differences:
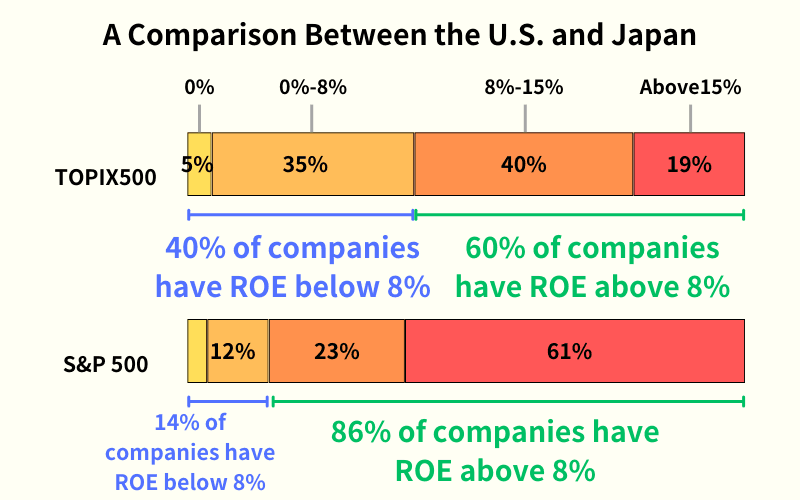
- In the TOPIX 500, 40% of companies have an ROE below the 8% standard.
- In the S&P 500, only 14% of companies fall below this threshold.
This comparison suggests that U.S. companies tend to demonstrate higher operational efficiency compared to their Japanese counterparts.
5. Limitations of ROE
While ROE is useful for evaluating investments, it has limitations because it excludes a company’s liabilities.
For example, consider two companies with the same total assets and net profit but different equity structures:
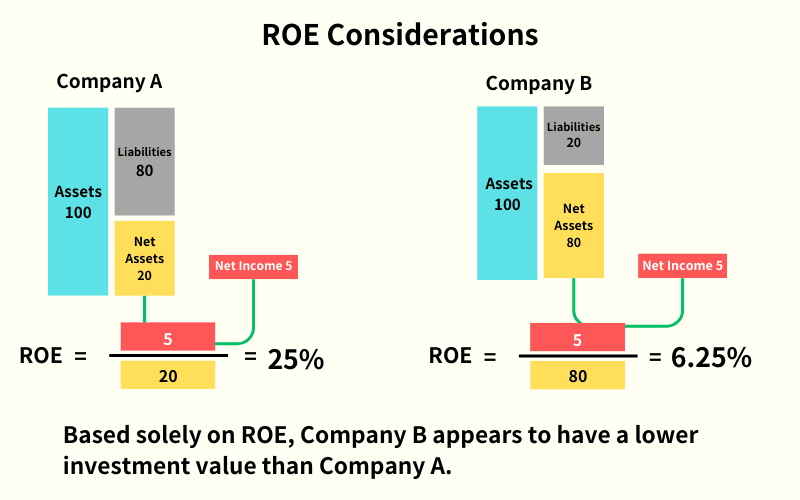
Company A: Total Assets = $10 billion (Liabilities = $8 billion, Equity = $2 billion) Net Profit = $500 million ROE = $500 million ÷ $2 billion × 100% = 25%
Company B: Total Assets = $10 billion (Liabilities = $2 billion, Equity = $8 billion) Net Profit = $500 million ROE = $500 million ÷ $8 billion × 100% = 6.25%
Company A has a much higher ROE, but this is because it uses more debt (liabilities). Simply looking at ROE might make a company with higher leverage appear more efficient, even though it carries greater financial risk.
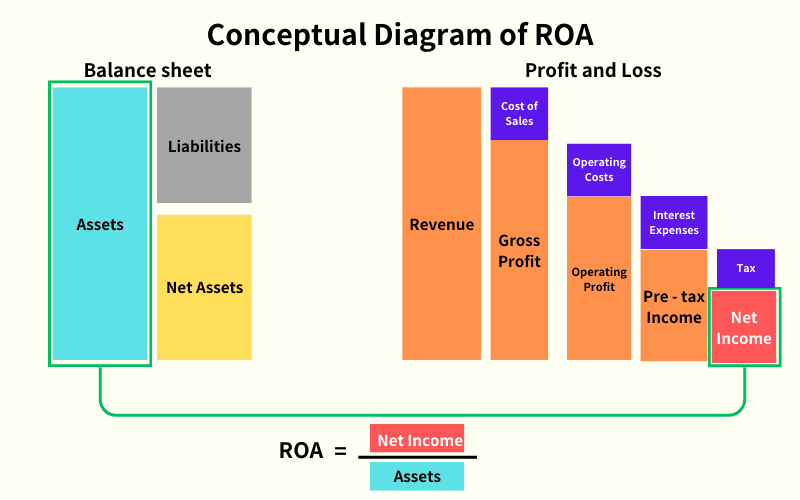
6. Difference Between ROE and ROA
Another related metric is ROA (Return on Assets), which measures the efficiency of a company’s total assets in generating profits.
ROA Calculation
ROA (%) = Net Profit ÷ Total Assets × 100
- ROE uses shareholders' equity as the denominator.
- ROA uses total assets (equity + liabilities) as the denominator.
ROA takes into account all company assets, including debt, making it a more comprehensive measure of operational efficiency.
7. Frequently Asked Questions (FAQ)
Below are common investor questions about ROE.
Q1: What ROE level qualifies as a strong company?
No absolute benchmark exists. General targets:
- 15%+: excellent (typical of US growth companies)
- 10-15%: solid
- 8-10%: Japanese pass mark (Ito Report minimum)
- Below 5%: needs improvement
Combine with ROA/PBR/PER for full evaluation.
Q2: Does a high ROE always mean a good investment?
Not necessarily. High ROE from operational margin improvement is positive, but high ROE from excess leverage or aggressive buybacks can mask risk (rate-rise vulnerability, temporary manipulation). DuPont 3-factor decomposition reveals the source quality:
- Margin-driven high ROE — sustainable
- Leverage-driven high ROE — financial risk
- Buyback-driven high ROE — may not reflect operational strength
Q3: Why is Japanese ROE structurally lower than US?
Three main structural reasons:
- Large retained earnings: thick equity base inflates the denominator
- Conservative financial leverage: companies avoid debt
- High manufacturing share: asset-heavy industries suppress ROE
The 2014 Ito Report set 8% as the minimum target, driving improvement via share buybacks and dividend hikes.
Q4: How does ROE relate to PER and PBR?
Theoretically:
High ROE with comparable PER produces higher PBR, indicating market recognition of profitability. Example: ROE 15% × PER 20 = PBR 3.0; below 2.0 may be undervalued, above 4.0 may be overheated.
Q5: How should individual investors use ROE in practice?
Practical framework:
- Compare against 3-5 industry peers to gauge relative positioning
- Check the 5-10 year ROE trend to filter one-off spikes
- Apply DuPont 3-factor decomposition to assess high-ROE quality
- Combine with ROA/PBR/PER for multi-angle evaluation
- Review shareholder return policy (buybacks, dividends)
ROE works as a center metric within a multi-indicator framework, not as a standalone signal.
8. Conclusion
ROE is a valuable metric for understanding how efficiently a company utilizes shareholders' equity to generate profits. However, it’s important to consider its limitations and analyze it alongside other indicators, such as ROA, to get a complete picture of a company’s financial health.
Investors should also be aware of sector-specific ROE benchmarks and the impact of leverage on financial metrics to make informed investment decisions.
Further Reading
Titan FX Research Team. We cover a broad set of financial instruments — foreign exchange, commodities, equity indices, US equities, and digital assets — producing practical, research-backed educational content for investors.
Primary Sources
- ROE fundamentals: Investopedia — Return on Equity, CFA Institute — Equity Valuation
- Japan ROE improvement: METI — Ito Report, JPX — ROE data
- US vs Japan comparison: S&P Dow Jones — S&P 500, NYU Stern — Industry ROE