Business Cycle
Markets look noisy at first glance, but behind that noise sits the underlying rhythm of the real economy. Economists call that rhythm the business cycle: the recurring expansion and contraction of overall economic activity. For traders and long-term investors alike, understanding the business cycle is less about predicting tops and bottoms and more about knowing which phase the economy is in right now, then picking a strategy that fits.
Once you can read the four phases—recovery, expansion, slowdown and recession—and their typical signals, market swings stop feeling random and start looking more like a sequence you can prepare for instead of react to.
- Four phases run in order. Recovery, expansion, slowdown and recession—predictable sequence, variable length and depth.
- Asset behavior shifts by phase. Equities, bonds, FX and commodities each respond at different speeds; phase guides allocation.
- Three indicator groups. Leading (PMI, equities, confidence), coincident (GDP, IP, retail) and lagging (unemployment, CPI, defaults).
- Policy turns the cycle. Central-bank hikes and cuts mark the inflection points; sentiment plus policy aligning is the signal.
- Build a personal dashboard. Track five or six indicators monthly to swap guessing for reading data.
1. The Basic Framework of the Business Cycle
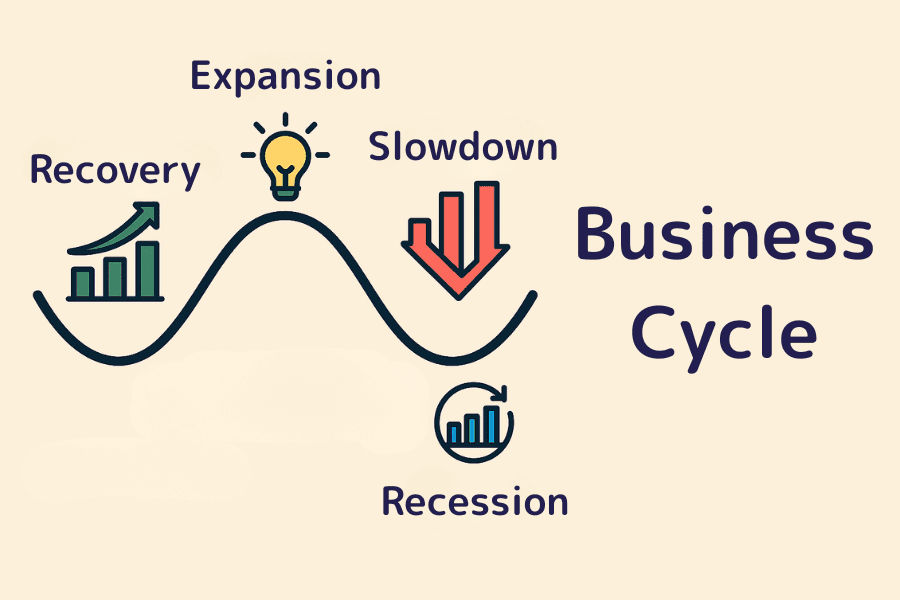
The business cycle describes the recurring fluctuations in overall economic activity—GDP, employment, prices—over time. Economists typically break the cycle into four main phases: recovery, expansion, slowdown and recession.
The cycle emerges from the interaction of corporate investment, household consumption, employment, wages and prices, each moving on its own timeline. The pattern repeats, but no two cycles are identical: their length and amplitude shift with monetary policy, global trade, technological change and market psychology.
Feature 1: It Is a Back-and-Forth Movement, Not a Straight Line
The business cycle is not a one-way uptrend. It is a sequence of phases that the economy moves through, doubles back from, and re-enters.
Recovery follows a trough: companies start investing again, employment improves, and consumer confidence gradually returns. Expansion is when demand, employment and wages are rising together; the economy looks strong, but inflation pressure starts to build. Slowdown brings weaker growth, rising inventories, and softer investment intentions. Recession then sees production and employment contract; markets enter a clear adjustment phase.
The order is fairly predictable—like the seasons—but the length and depth of each phase shift with external conditions.
Feature 2: Policy and Markets Push Each Other
The business cycle moves hand in hand with central bank and government policy.
When growth is weak, central banks tend to cut rates and ease conditions to support investment and consumption. When the economy overheats and inflation runs hot, they hike rates and tighten liquidity to slow things down. Fiscal policy, tax changes and credit conditions reshape the decisions of businesses and households, which in turn change the tempo of the cycle.
In practice, the cycle's turning points tend to coincide with shifts in market sentiment and policy direction happening at the same time.
Feature 3: You Cannot Time the Cycle Precisely, But You Can Read the Signals
Calling the exact tops and bottoms of a cycle is hard even for full-time macro desks. Reading the current phase, however, is something individual investors can absolutely do with the right data.
Tracking the combination of GDP growth, manufacturing PMI, consumer confidence and employment indicators is usually enough to locate the economy on the cycle. Knowing where you are is more practical than guessing where you are going.
2. The Four Phases and Where to Position
The four phases of the business cycle form the core framework behind asset allocation. The economic backdrop, policy stance and capital flow all change between phases, and equities, bonds, foreign exchange and commodities all respond at different speeds and amplitudes.
| Phase | Economic State | Policy Stance | Allocation Bias |
|---|---|---|---|
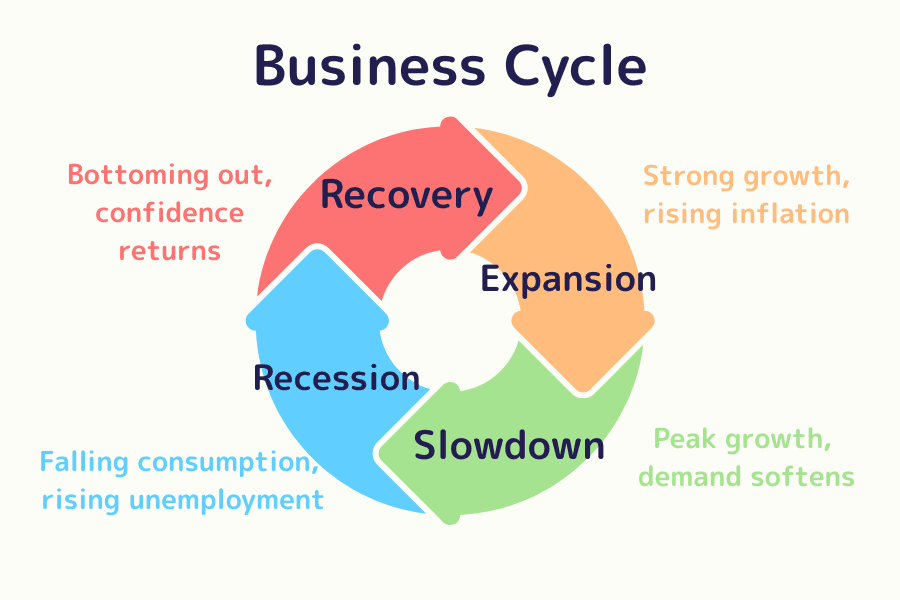
| Recovery | Bottoming out, confidence returns | Easy money, fiscal stimulus | Add equities and commodities |
| Expansion | Strong growth, rising inflation | Rate hikes, tightening | Hold equity exposure, lean into inflation beneficiaries |
| Slowdown | Peak growth, demand softens | Rates high, awaiting pivot | Defensive assets, bonds |
| Recession | Falling consumption, rising unemployment | Rate cuts, stimulus | Stay defensive, prepare for next recovery |
Recovery: Bottoming Out, Risk Assets Lead
Economic and Policy Backdrop
Recovery is the starting line of the business cycle—the moment the economy clears the previous trough and starts growing again.
Output gradually rebuilds, employment improves and consumer confidence returns. Central banks tend to keep rates low and policy accommodative, while fiscal support is still in place. Liquidity is plentiful, and risk assets attract capital again. Recovery is often the easiest phase to miss, even though it tends to deliver some of the best returns.
How Markets Behave
- Equities: First to price in the rebound. Materials, financials and industrials lead, and overall valuations work their way up from depressed levels.
- Bonds: Yields are still low and bond prices firm; investment-grade is steady and high-yield starts to recover from wide spreads.
- FX: Capital rotates out of safe-haven currencies like the yen and US dollar and into higher-yielding currencies such as the Australian and Canadian dollars.
- Commodities: Demand for energy and industrial metals picks up alongside the recovery in real activity.
Tactical Notes
Recovery is a phase to lean offensive—growth-oriented equities, cyclicals, equity ETFs and commodity CFDs all have a tailwind. Keep some cash on the side to fund pullback buys; recoveries tend to be choppy.
Expansion: Pushing Toward the Peak
Economic and Policy Backdrop
Expansion is the highest-energy phase of the cycle. Corporate earnings grow, capex and consumption expand together, and inflation pressure starts to surface. Central banks gradually hike rates and drain liquidity, while fiscal policy turns more neutral.
Late in this phase, valuation bubbles can build. Strength feels comfortable, but that is precisely when discipline matters most.
How Markets Behave
- Equities: Trend is still up, but valuations push into expensive territory. Technology, energy and consumer discretionary remain favored, though the risk of corrections grows.
- Bonds: Prices fall and yields rise as central banks tighten; short-duration tends to hold up better than long-duration.
- FX: Hiking-cycle currencies (the US dollar, the British pound) outperform, and capital chases rate differentials.
- Commodities: Energy and metals stay elevated as the inflation trade dominates.
Tactical Notes
Stay in equities but start scaling back leverage and taking profits. Rotate toward defensives and high-cash-flow companies, and hold some gold or USD cash as a pre-position for the eventual policy pivot.
Slowdown: Momentum Fades, Markets Turn Defensive
Economic and Policy Backdrop
Slowdown is the transition to adjustment. Growth decelerates, inventories pile up and capex intentions soften. Inflation may still look high, but with growth fading, central banks reach the end of the hiking cycle and markets start to price in the next round of cuts.
How Markets Behave
- Equities: Volatility expands. Defensive sectors like healthcare and utilities outperform; expensive growth stocks see clear corrections.
- Bonds: Yields stay high, and long-duration bonds start to look more attractive.
- FX: The US dollar and the Swiss franc (CHF) tend to firm, supported by both safe-haven flows and rate differentials.
- Gold: When real yields turn down, gold tends to rise and once again plays its defensive role.
Tactical Notes
Shift toward stability. Reduce equity and high-risk allocations, add bonds, gold and cash, and prepare for the recession leg. The emphasis moves from "growth" to "preservation."
Recession: At the Trough, the Setup for the Next Move Forms
Economic and Policy Backdrop
Recession is the bottom of the cycle. GDP contracts for several quarters, unemployment climbs and consumption weakens. Sentiment is bleak—but beneath the surface, governments roll out stimulus and central banks cut rates, releasing liquidity that quietly seeds the next recovery.
How Markets Behave
- Equities: Earnings drop and valuations compress, but the strongest companies often start to stabilize first.
- Bonds: As rates fall, bond prices rise; bonds become the main capital haven.
- FX: Safe havens like the US dollar and the yen attract flows.
- Gold: Demand for protection keeps gold prices in their higher range.
Tactical Notes
Recession is a defensive phase: lean on investment-grade bonds, gold and cash. When sentiment hits its lowest and policy clearly turns supportive, that is the textbook moment to start rebuilding recovery-phase exposure.
3. Key Indicators for Reading the Cycle
Pinning down cycle turns down to the exact week is rarely realistic. But reading the current phase from a basket of economic indicators is a discipline anyone can build. Each indicator signals at a different point in the cycle. Conventionally they are grouped into leading, coincident and lagging indicators.
Leading Indicators: They Move Before the Cycle Turns
Leading indicators tend to shift ahead of the cycle's turning points. They are the workhorses for thinking about where the economy is going next. When they strengthen, recovery is likely on the horizon; when they weaken persistently, slowdown or recession is increasingly probable.
Common leading indicators:
- Manufacturing PMI: Above 50 signals expansion, below 50 signals contraction. One of the most widely tracked forward-looking indicators.
- Stock indices: Equity markets price in earnings and growth expectations early, acting as a mirror for collective forward views.
- Housing starts and durable goods orders: Capture corporate capex appetite and household confidence; rising readings usually flag accelerating activity.
- Consumer confidence index: Measures expectations for personal income and the economy; particularly meaningful for retail and services.
Coincident Indicators: They Move With the Cycle in Real Time
Coincident indicators move roughly in step with the cycle. They are useful for confirming the current phase and capturing the state of the real economy as it happens.
Common coincident indicators:
- GDP growth rate: The headline macro indicator, capturing total domestic output.
- Industrial production index: Reflects activity in manufacturing, energy and mining.
- Retail sales: Real-time read on consumer activity; one of the cleanest measures of domestic demand.
Lagging Indicators: They Confirm Turns After the Fact
Lagging indicators move after the trend has already shifted, which makes them useful for confirming that a turn has actually occurred and for measuring how deep the adjustment ran.
Common lagging indicators:
- Unemployment rate: Typically falls only after a recovery has begun; a key gauge of labor market health.
- Consumer Price Index (CPI): Inflation lags production and demand, making it useful for assessing how persistent price pressure is.
- Corporate default and loan delinquency rates: Spike during recessions and reveal the stress level in the corporate and financial system.
Building Your Own Cycle Dashboard
Combining all three indicator groups lets you build a personal cycle dashboard. When leading indicators turn up and coincident indicators stop falling, recovery signals are forming. Conversely, when leading indicators weaken while coincident data is still strong, you are likely in the late stage of expansion—worth watching carefully.
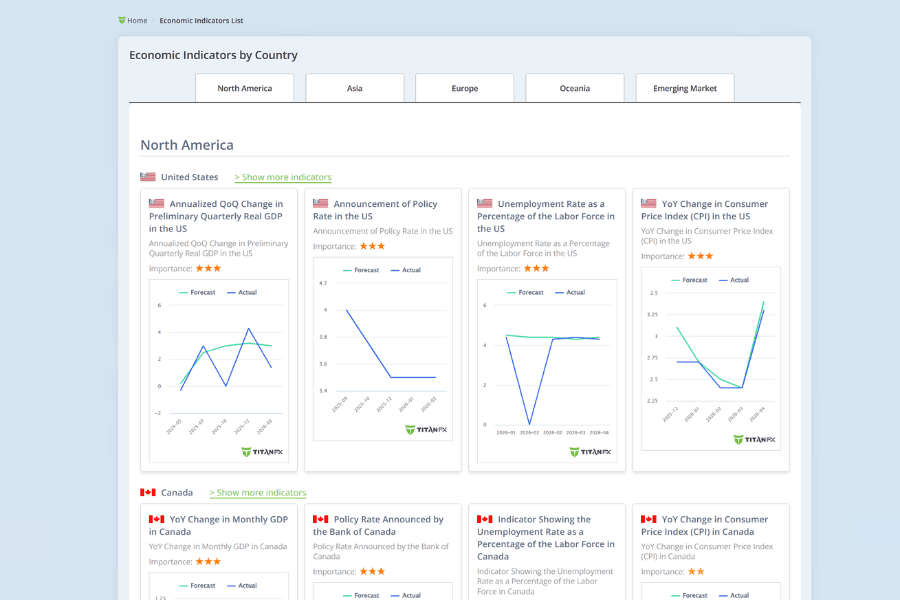
Titan FX offers a free economic indicators page that lets you scan GDP, CPI, non-farm payrolls (NFP), unemployment and other key releases by region, alongside the price action in related instruments. It is a convenient way to stay in step with the cycle.
Further reading: How to use the Titan FX economic indicators page
Tracking these inputs systematically keeps decisions anchored to data rather than emotion, and helps you stay aligned with the rhythm of the cycle.
4. Summary: Move With the Cycle, Not Against It
The business cycle is the heartbeat of the economy and the rhythm of investing. Recovery, expansion, slowdown and recession each carry their own mix of opportunity and risk. Disciplined investors do not chase highs in euphoria or sell into panic—they let the cycle's rhythm guide allocation, building positions in the lows and harvesting in the highs.
Recovery is for stepping in, expansion for steady operation, slowdown for shifting defensive, and recession for waiting and preparing. Once these four phases sit clearly in your head, the noise of day-to-day markets is easier to navigate, and emotional traps become easier to spot.
Investing is less about predicting the future and more about respecting the pattern. Move in step with the cycle, and the market's ups and downs become an engine for steady returns instead of a source of stress.
5. FAQ: Business Cycle and Investment Decisions
Q1. How long does one business cycle last?
Historically, a full cycle has lasted anywhere from a few years to a bit over ten. In the post-1990 US, expansions have averaged 8–10 years and recessions roughly six months to under two years, with the post-GFC expansion an unusually long example. Future cycles are not guaranteed to look the same—policy shifts, technology and geopolitics can stretch or shorten them—so historical ranges are best treated as rough guidance rather than fixed expectations.
Q2. Can a single indicator tell you which phase the economy is in?
Relying on one indicator is risky. High equity prices, for example, can show up in both expansion and the early stage of slowdown, leading to misreads. Combining a leading indicator (e.g., PMI), a coincident one (GDP) and a lagging one (unemployment) gives you three different time horizons; when their direction lines up, the read is far more reliable than any single number.
Q3. What is the difference between a recession and a slowdown?
A slowdown means growth is decelerating but the economy is still expanding. A recession, by the NBER definition, is a broad-based decline in economic activity that lasts more than a few months; two consecutive quarters of negative GDP is often cited as a rule of thumb. In practice the line between late slowdown and early recession is fuzzy, which is why markets tend to price in a probability of recession rather than wait for a definitive call.
Q4. How does the business cycle affect FX markets?
FX is one of the markets most sensitive to differences in cycle phase across countries. When the US is in expansion and hiking while Europe or Japan is in slowdown and cutting, capital chases the rate differential and can produce extended dollar trends. The takeaway: the business cycle hits FX as a relative story between two currencies, not as a single-currency narrative.
Q5. How should retail investors actually use the business cycle?
The practical approach is to tilt with the cycle rather than rebuild the portfolio from scratch. Slightly heavier in risk assets during recovery, slightly heavier in defensives and cash during slowdown—small shifts compound. Keeping a personal cycle dashboard of five or six indicators (PMI, consumer confidence, employment, CPI, etc.) updated monthly turns "guessing the market" into "reading the data."
Titan FX Economic CalendarFurther Reading
- GDP (Gross Domestic Product) explained: the master gauge of the economy
- CPI (Consumer Price Index): how to read it and what it means for FX
- Monetary policy: the central bank toolkit and market transmission
- NFP (US non-farm payrolls): reading the print and trading the reaction
- Safe-haven currencies: when JPY, USD and CHF do their job
Titan FX Research and Review Team — covering forex (FX), commodities (oil, precious metals, agricultural products), stock indices, US equities, and crypto assets, producing educational content for retail and institutional investors.
Primary Sources by Category
- Official data and regulators: US NBER (National Bureau of Economic Research) Business Cycle Dating Committee, IMF World Economic Outlook, OECD Composite Leading Indicators (CLI), Cabinet Office of Japan "Indexes of Business Conditions".
- Market data and liquidity: Bloomberg Markets, Reuters, ISM Manufacturing/Services PMI, Conference Board Leading Economic Index (LEI).
- Academic research: Burns and Mitchell, "Measuring Business Cycles" (NBER, 1946); Robert J. Gordon, "Productivity Growth, Inflation, and Unemployment"; Mankiw, "Macroeconomics" (standard textbook).
- Industry and third-party references: Investopedia (Business Cycle), Federal Reserve Economic Data (FRED), Titan FX Research economic calendar.