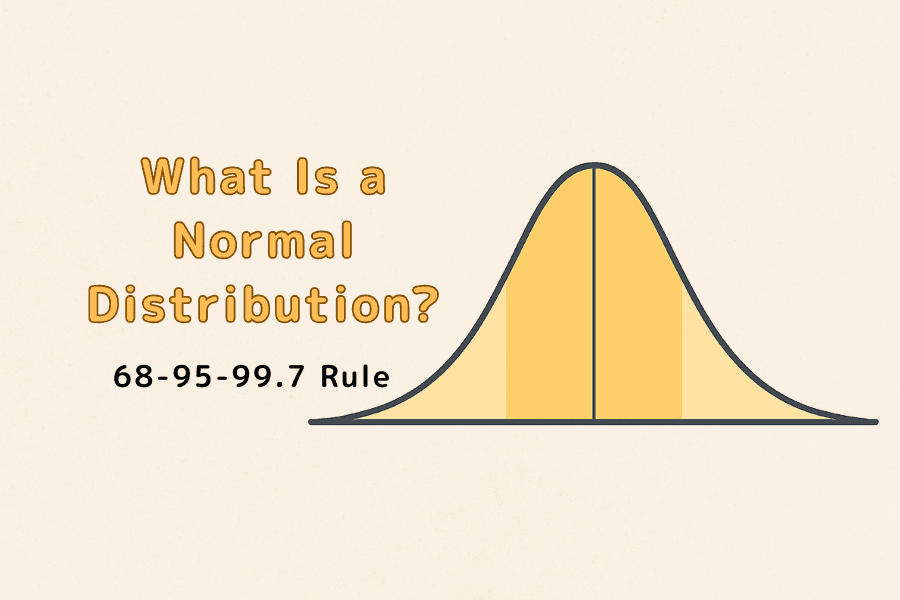
Normal Distribution
Price movements may look random at first glance, but the way they scatter follows statistical regularities. Reading those patterns — and judging risk and volatility rationally — starts with the idea of the normal distribution. From short-term traders to long-term investors, it is a statistical foundation worth knowing.
- Definition: a symmetric bell curve where mean = median = mode
- 68-95-99.7 rule: ~68/95/99.7% of data fall within ±1/±2/±3 standard deviations
- Trading use: Bollinger Bands, VaR, and the Sharpe ratio assume it
- Fat tails: extreme events happen far more often than the model predicts
- Mindset: use it as a baseline framework, not an absolute, with strict risk control
1. What Is the Normal Distribution?
The normal distribution (also called the Gaussian distribution) is an extremely common data distribution in statistics, known as the "bell curve" for its symmetric bell shape. Data cluster near the mean, and the further from the mean, the lower the probability. In a normal distribution the mean, median, and mode coincide, and dispersion is measured by the standard deviation. As an empirical rule:
- about 68% of data fall within ±1 standard deviation
- about 95% within ±2 standard deviations
- about 99.7% within ±3 standard deviations
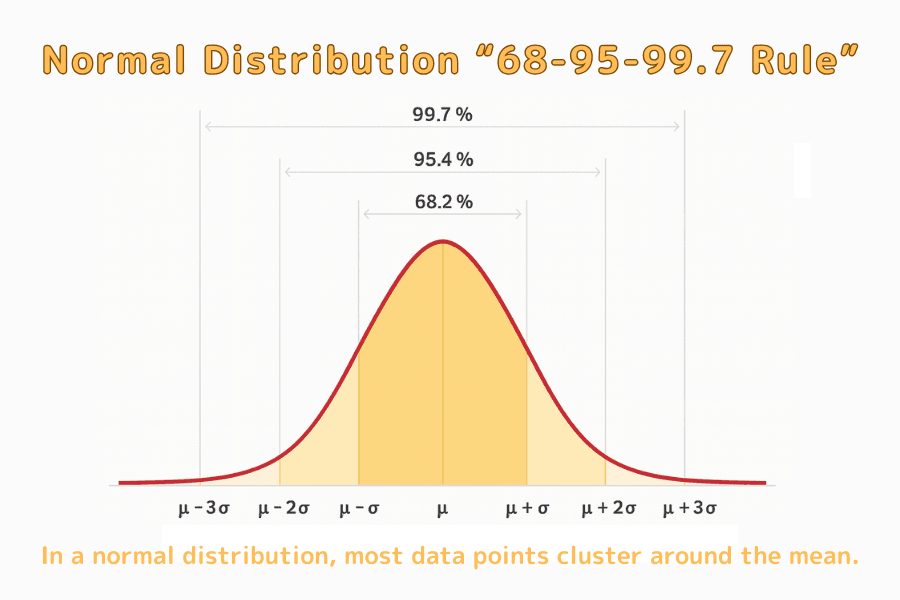
This "68-95-99.7 rule" lets traders quickly judge whether a move is within the normal range or has deviated from the mean with potential opportunity. Although a theoretical model, it has practical value in analyzing asset returns, measuring risk, and designing indicators.
2. The Normal Distribution and Market Price Moves
Market moves look chaotic but carry statistical regularities. Many assets' daily-return distributions are roughly bell-shaped: most returns sit near the mean with small moves, while extreme up/down moves are less likely. For example, with a 0% mean and 1% standard deviation of daily returns, the normal distribution implies about 68% of trading days fall within ±1%. This lets traders judge the "normality" of a move with a basis.
However, real markets do not always follow the normal distribution. Major historical events show extreme moves occur far more often than the theoretical value - this is fat-tail risk. The normal distribution is a good tool for understanding moves but must be paired with risk awareness and dynamic adjustment to navigate complex markets steadily.
3. Using the Normal Distribution in Trading Strategy
The normal distribution is not just a shape but a core assumption of many indicators and risk models. Bollinger Bands build on its concept, using the mean and standard deviation to draw a "reasonable range" of price, helping judge overextension or mean-reversion opportunity.
In risk management, VaR (Value at Risk) also relies on the normal distribution, estimating the maximum likely loss over a period at a confidence level. For example, if a portfolio's 1-day VaR is $10,000 at 95% confidence, then in normal conditions there is a 95% chance the daily loss does not exceed $10,000.
The Sharpe ratio measures return per unit of risk, and its denominator - standard deviation - is a volatility measure assuming returns are near-normal. Through these, the normal distribution makes entry/exit rules, position sizing, and loss control more scientific. Still, strategies that depend on statistical models should be monitored live for continued validity, since market behavior can evolve and is not always normal.
4. Limits and Misconceptions
A powerful, intuitive tool, but its market application has real limits. The biggest issue: real return distributions do not fully follow the normal distribution.
Statistically, the normal distribution is "thin-tailed," meaning extreme events have very low probability. Yet events deemed "once in a century," like the Lehman collapse or the COVID crash, happened far more often than imagined. This is fat-tail risk, one of the market's biggest unexpected-risk sources.
The normal model also assumes continuous, calm volatility, but in reality news, liquidity, and sentiment cause gaps, panic selling, and sustained overshoots that deviate from the model. For traders, blind faith in the normal distribution leads to underestimating risk, especially with leverage, stop placement, or backtest reliance. Useful as an analytical framework, in practice pair it with Monte Carlo simulation, extreme value theory, and scenario analysis plus risk control to avoid the model's "comfort trap."
5. Practical Use in Forex Trading
Forex moves are driven by many factors - central-bank policy, economic data, bond yields, geopolitics. While hard to describe purely with a normal distribution, using the normal model as a baseline framework for risk and volatility remains daily practice for many professionals.
For example:
Volatility estimation: from a pair's historical standard deviation, estimate a near-term "reasonable range" as a basis for stop and take-profit levels.
Mean-reversion strategy: when price leaves the statistical normal range (e.g., ±2σ), there may be a mean-reversion opportunity - the basis of many Bollinger or standard-deviation-channel strategies.
Event risk control: around major data or central-bank meetings, return distributions tend to deviate from normal; combine normal-based forecasts with real observation to adjust leverage and exposure dynamically.
Risk-model building: institutional and EA (automated) traders often evaluate maximum loss, average return, and win rate on a normal-distribution basis and optimize parameters accordingly.
Although forex often does not fully follow the normal distribution, mastering this model helps analyze markets, design strategies, and control risk more systematically. Treating it as a supporting lens rather than an absolute basis is a key step to better trading decisions.
6. Frequently Asked Questions (FAQ)
Q1. What are the normal distribution and the 68-95-99.7 rule?
The normal distribution is a symmetric bell curve where data cluster around the mean. The 68-95-99.7 rule says about 68%/95%/99.7% of data fall within ±1/±2/±3 standard deviations of the mean, letting you quickly judge whether a move is within the normal range.
Q2. Why should traders understand the normal distribution?
Many indicators and risk models assume it: Bollinger Bands use the mean and standard deviation to draw a reasonable volatility range; VaR estimates the maximum likely loss at a given confidence level; the Sharpe ratio uses standard deviation to measure return per unit of risk. Understanding it makes strategy and position design more systematic.
Q3. What is fat-tail risk?
Extreme moves (like the Lehman collapse or the COVID crash) occur far more often than the normal distribution predicts - this is fat-tail risk. It is one of the market's biggest sources of unexpected risk and means a normal-only model badly underestimates crash probability.
Q4. Can I apply the normal distribution directly to forex?
Not as an absolute basis. Forex returns deviate from normal via gaps and panic driven by news, liquidity, and sentiment. The practical approach is to use the normal model as a baseline framework for risk and volatility, then adjust leverage and positions dynamically with real observation.
Q5. What is the most common pitfall when using the normal distribution?
Underestimating extreme risk - especially with leverage, stop placement, or backtest reliance. Pair it with tools like Monte Carlo simulation, extreme value theory, and scenario analysis, plus strict risk control, to avoid the model's comfort trap.
7. Conclusion
The normal distribution comes from statistics but plays a practical role in forex trading. It helps us understand the range of price moves, identify extreme conditions, and provides a reference for strategy design and risk control. Of course, markets are always full of variables and no model can fully predict the future. But by mastering the normal distribution, we can think about trading more systematically, measure risk, and make decisions more robust. The key is to use it as a supporting framework rather than an absolute - and to stay prepared for fat tails.
Further Reading
- Bollinger Bands
- What Is the Sharpe Ratio?
- What Is Maximum Drawdown?
- What Is a Stop-Loss?
- What Is Technical Analysis?
Titan FX's financial market research and analysis team produces investor education content across a wide range of financial instruments, including foreign exchange (FX), commodities (crude oil, precious metals, and agricultural products), stock indices, U.S. equities, and crypto assets.
Primary Sources by Category
- Statistics fundamentals: Investopedia / Corporate Finance Institute (Normal Distribution / Empirical Rule)
- Financial-engineering application: normal-assumption models such as Black-Scholes (general framework); standard definitions of VaR and the Sharpe ratio
- Tail risk: general statistics and risk-management knowledge on fat-tailed distributions